All Projects → slanatech → Dashblocks

slanatech / Dashblocks

Licence: mit
Enable Analytics in your Apps

Projects that are alternatives of or similar to Dashblocks

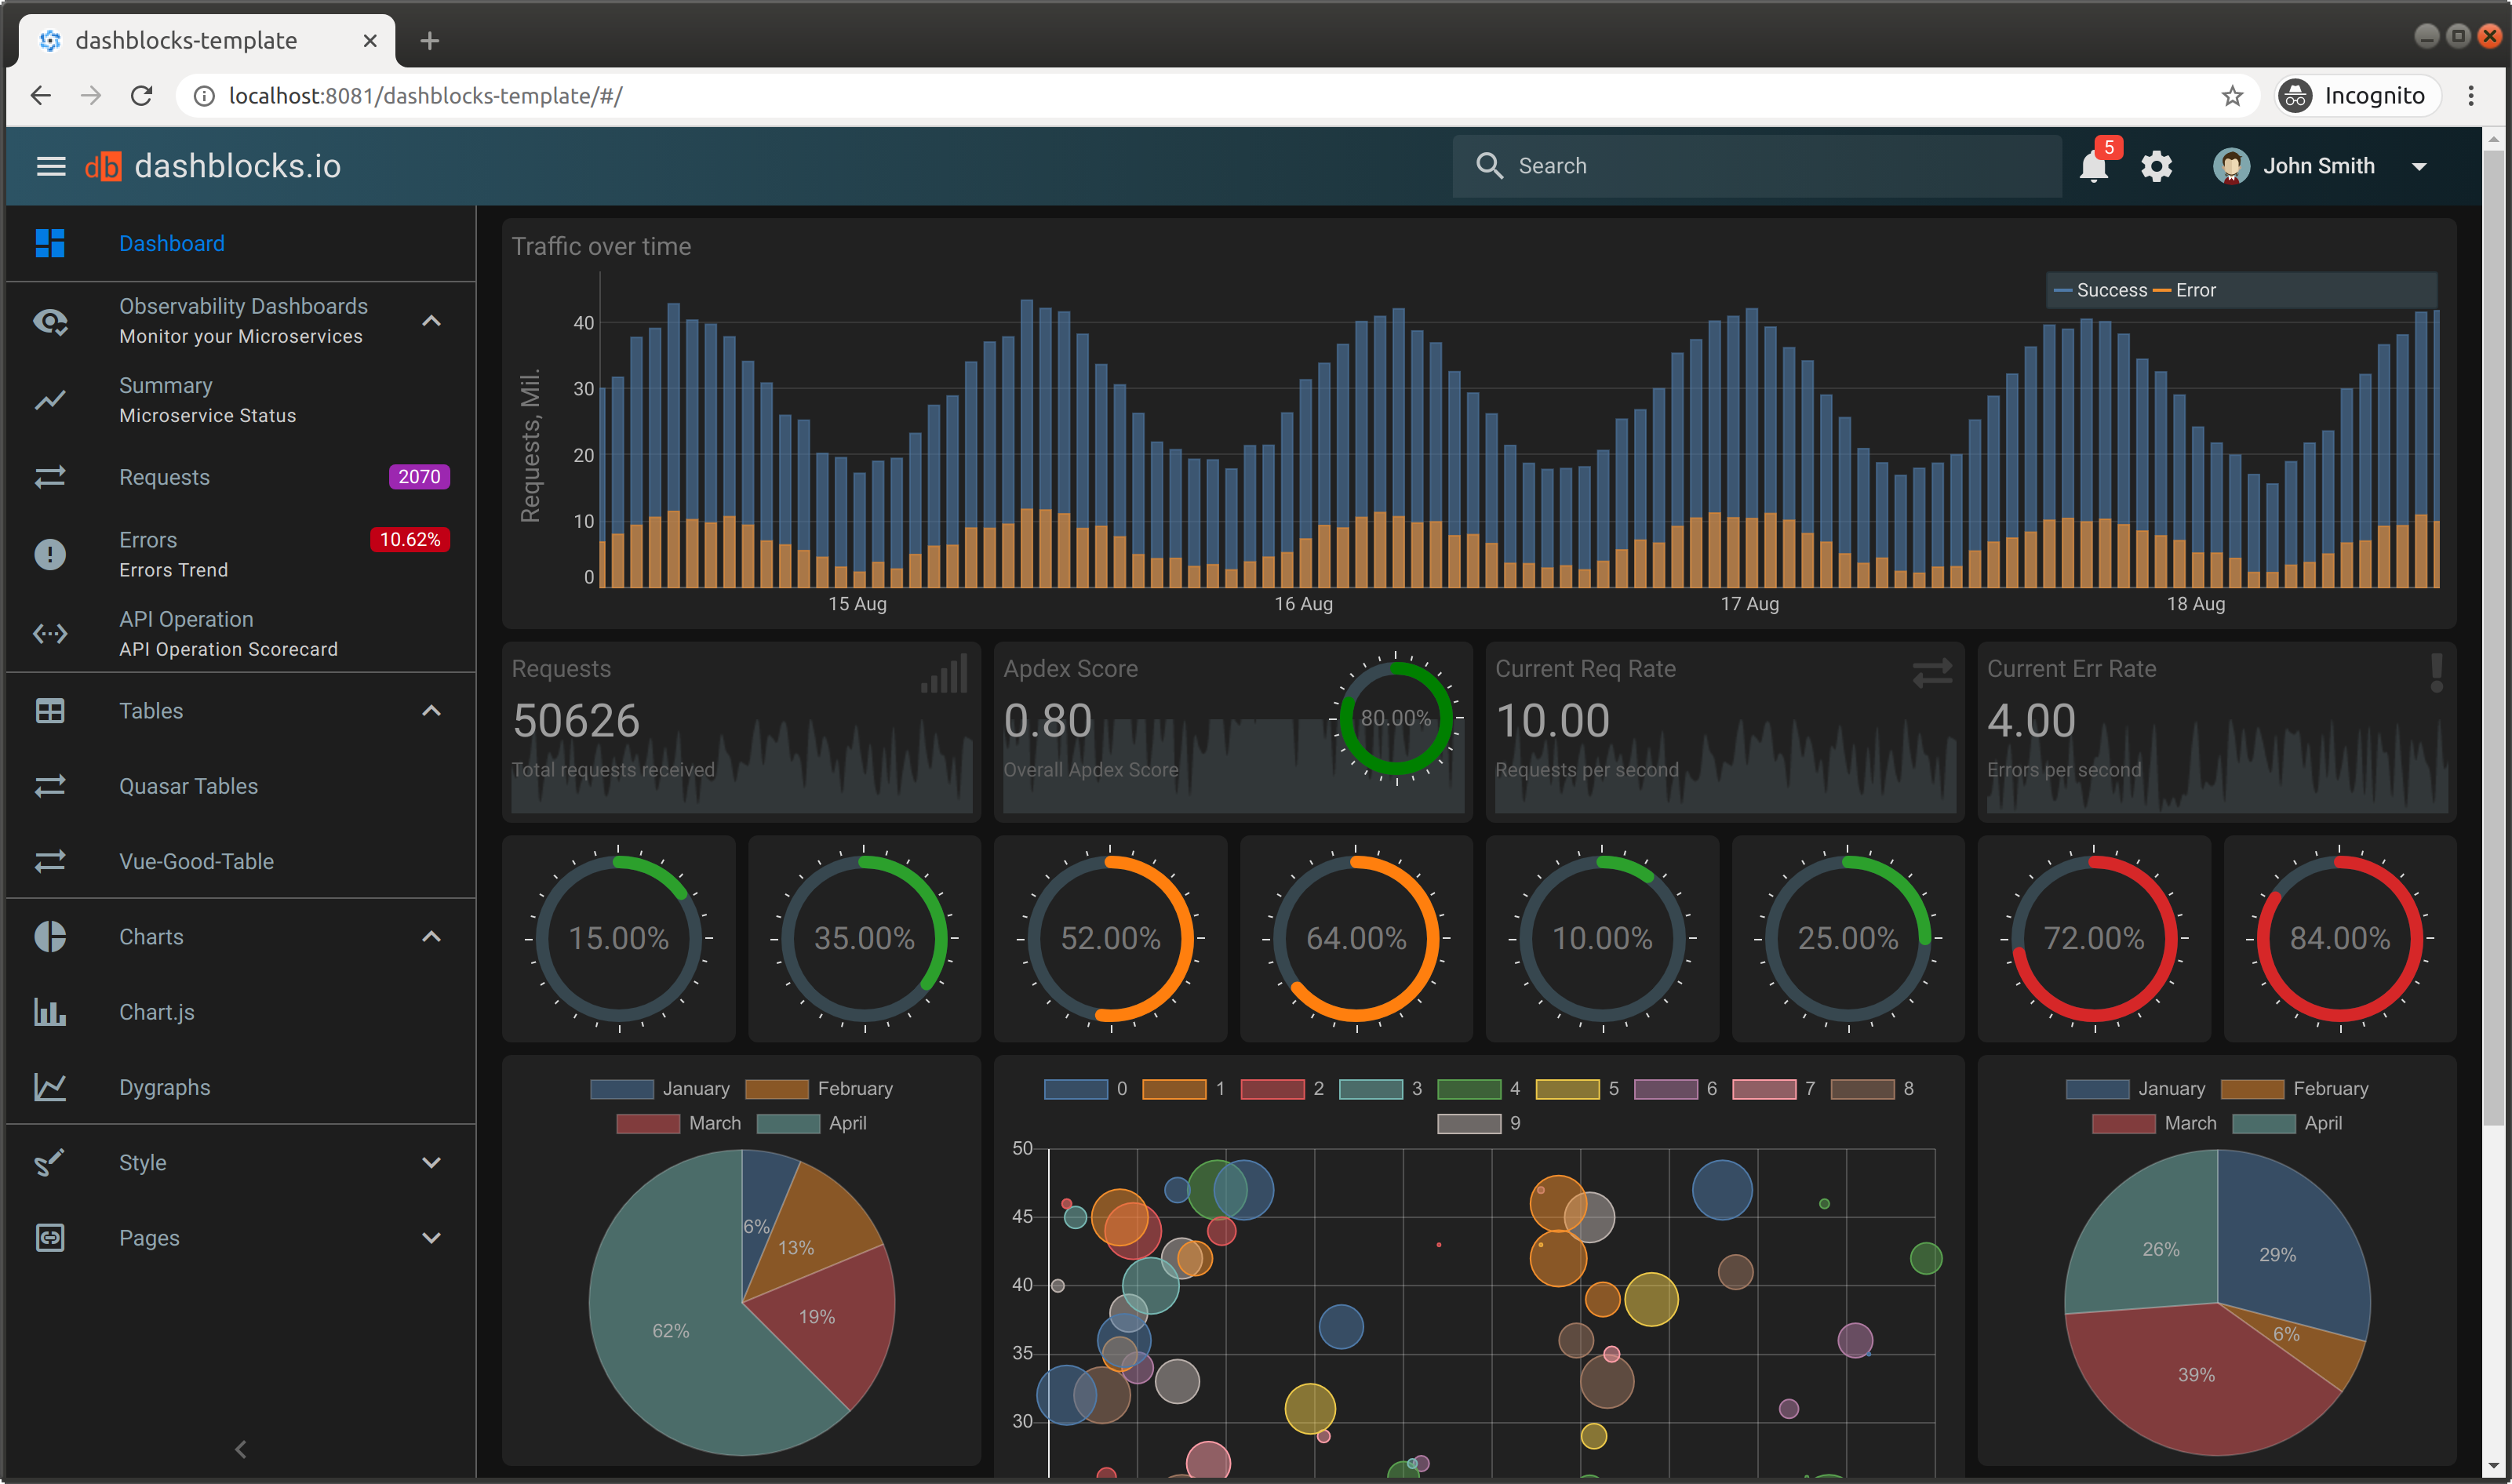
dashblocks-template
Dashblocks Vue Material Admin Template
Stars: ✭ 143 (+197.92%)
Mutual labels:  d3, charts, chartjs, plotly
Flask jsondash
🐍 📊 📈 Build complex dashboards without any front-end code. Use your own endpoints. JSON config only. Ready to go.
Stars: ✭ 3,215 (+6597.92%)
Mutual labels:  charts, plotly, dashboard, d3
Chartbrew
Open-source web platform for creating charts out of different data sources (databases and APIs) 📈📊
Stars: ✭ 199 (+314.58%)
Mutual labels:  analytics, charts, chartjs, dashboard
Plotly.js
Open-source JavaScript charting library behind Plotly and Dash
Stars: ✭ 14,268 (+29625%)
Mutual labels:  charts, plotly, d3
Abixen Platform
Abixen Platform
Stars: ✭ 530 (+1004.17%)
Mutual labels:  analytics, charts, dashboard
Plotly.py
The interactive graphing library for Python (includes Plotly Express) ✨
Stars: ✭ 10,701 (+22193.75%)
Mutual labels:  plotly, dashboard, d3
Dashboards
Responsive dashboard templates 📊✨
Stars: ✭ 10,914 (+22637.5%)
Mutual labels:  analytics, charts, dashboard
Awesome
A curated list of awesome Chart.js resources and libraries
Stars: ✭ 621 (+1193.75%)
Mutual labels:  charts, chartjs
Chartkick
Create beautiful JavaScript charts with one line of Ruby
Stars: ✭ 5,903 (+12197.92%)
Mutual labels:  charts, chartjs
Metabase
The simplest, fastest way to get business intelligence and analytics to everyone in your company 😋
Stars: ✭ 26,803 (+55739.58%)
Mutual labels:  analytics, dashboard
Explorer
Data Explorer by Keen - point-and-click interface for analyzing and visualizing event data.
Stars: ✭ 725 (+1410.42%)
Mutual labels:  analytics, charts
Flask Profiler
a flask profiler which watches endpoint calls and tries to make some analysis.
Stars: ✭ 622 (+1195.83%)
Mutual labels:  analytics, dashboard
Keen Js
https://keen.io/ JavaScript SDKs. Track users and visualise the results. Demo http://keen.github.io/keen-dataviz.js/
Stars: ✭ 588 (+1125%)
Mutual labels:  analytics, charts
Chartkick.py
Create beautiful Javascript charts with minimal code
Stars: ✭ 695 (+1347.92%)
Mutual labels:  charts, chartjs
Countly Server
Countly helps you get insights from your application. Available self-hosted or on private cloud.
Stars: ✭ 4,857 (+10018.75%)
Mutual labels:  analytics, dashboard
React Plotly.js
A plotly.js React component from Plotly 📈
Stars: ✭ 701 (+1360.42%)
Mutual labels:  plotly, d3
Uplot
📈 A small, fast chart for time series, lines, areas, ohlc & bars
Stars: ✭ 6,808 (+14083.33%)
Mutual labels:  analytics, charts
Bowtie
Create a dashboard with python!
Stars: ✭ 724 (+1408.33%)
Mutual labels:  plotly, dashboard
Eda miner
Swiss army knife, but for visualization, analytics, and machine learning. View docs here: http://edaminer.com/docs/ and a demo (don't abuse) here: http://edaminer.com/
Stars: ✭ 13 (-72.92%)
Mutual labels:  analytics, dashboard
Umami
Umami is a simple, fast, website analytics alternative to Google Analytics.
Stars: ✭ 9,228 (+19125%)
Mutual labels:  analytics, charts

https://dashblocks.io

dashblocks

https://dashblocks.io | GUIDE | DEMO

Enable Analytics in your Apps

npm version

Note: under active development

Declarative Interactive Dashboards

Dashblocks enables easily creating sophisticated interactive dashboards simply by declaring dashboard structure as json or javascript object.

Dashblocks uses popular charting libraries to render chars: d3, Chart.js, Dygraphs, Plotly.js

DEMO

dashboard

MORE DEMOS

Dashblocks aims to simplify enabling robust In-App Analytics:

  • Use declarative approach to define dashboard layout
  • Provide reasonable out of the box defaults for all chart types, such as colors
  • Support dark / light modes out of the box
  • Enable interactivity by providing event handling on dashboard level
  • Streamline dynamic updates of dashboard data, for example based on user interaction with dashboard
  • Even dynamically generate Dashboard itself based on the data - thanks to declarative approach

Dashblocks Template

https://github.com/slanatech/dashblocks-template

Dashblocks Vue Material Admin Template is build based on Quasar Framework, Vuex, Vuejs and Dashblocks.

We focus on providing beautiful interactive Dashboards out of the box, and helping to enable In-App Analytics in your Apps.

DASHBLOCKS TEMPLATE DEMO

Installation

npm install dashblocks --save

Usage

Create Dashboard in your Vue app as a Vue Component. In Dashboard component you define:

  • Dashboard Layout - add widgets to your dashboard, specifying how many columns and rows each widget takes. Dashblocks provides 16-columns CSS Grid layout. Pass additional options to widgets to adjust appearance as needed.
  • Set Data for each widget on a dashboard

Here is an example dashboard:

<template>
  <db-dashboard v-if="ready" :dbspec="dbspec" :dbdata="dbdata" :dark="isDark"> </db-dashboard>
</template>

<script>
import { DbData, DbDashboard } from 'dashblocks';

export default {
  name: 'SampleDashboard',
  components: {
    DbDashboard
  },
  data() {
    return {
      isDark: false,
      dbdata: new DbData(),
      // Declare Dashboard Layout. Add widgets to your dashboard, specifying how many columns and rows
      // each widget takes. Dashblocks provides 16-columns CSS Grid layout.
      // Pass additional options to widgets to adjust appearance as needed.
      dbspec: {
        layout: {
          type: 'grid'
        },
        widgets: [
          {
            id: 'w1',
            type: 'DbDygraphsBar',
            cspan: 16,
            height: 250,
            properties: {
              options: {
                stackedGraph: true,
                title: 'Traffic over time',
                ylabel: 'Requests, Mil.',
                labels: ['Date', 'Success', 'Error'],
                legend: 'always'
              }
            }
          },
          {
            id: 'w2',
            type: 'DbChartjsPie',
            cspan: 4,
            height: 250
          },
          {
            id: 'w3',
            type: 'DbChartjsPie',
            cspan: 4,
            properties: {
              options: {
                legend: {
                  position: 'right'
                }
              }
            }
          },
          {
            id: 'w4',
            type: 'DbChartjsBar',
            cspan: 4
          },
          {
            id: 'w5',
            type: 'DbChartjsBar',
            cspan: 4
          }
        ]
      },
      ready: false
    };
  },
  mounted() {
    this.initialize();
    this.ready = true;
  },
  methods: {
    initialize: function() {
      // Initialize dashboard data - set data for each dashboard widget
      // This is obviously a sample that generates random data
      // In real dashboards you would get data from database, backend APIs, vuex, etc
      let dthData = [];
      let sTS = Date.now() - 100 * 3600 * 1000;
      for (let i = 0; i < 100; i++) {
        dthData.push([new Date(sTS + i * 3600 * 1000), Math.random(), Math.random()]);
      }

      this.dbdata.setWData('w1', {
        data: dthData
      });

      let dataOneSeries = {
        labels: ['January', 'February', 'March', 'April'],
        datasets: [
          {
            label: 'Data One',
            data: [10, 20, 30, 100]
          }
        ]
      };

      let dataTwoSeries = {
        labels: ['January', 'February', 'March', 'April'],
        datasets: [
          {
            label: 'Data One',
            data: [10, 20, 30, 100]
          },
          {
            label: 'Data Two',
            data: [50, 10, 70, 11]
          }
        ]
      };

      this.dbdata.setWData('w2', {
        data: JSON.parse(JSON.stringify(dataOneSeries))
      });

      this.dbdata.setWData('w3', {
        data: JSON.parse(JSON.stringify(dataOneSeries))
      });

      this.dbdata.setWData('w4', {
        data: JSON.parse(JSON.stringify(dataOneSeries))
      });
      this.dbdata.setWData('w5', {
        data: JSON.parse(JSON.stringify(dataTwoSeries))
      });
    }
  }
};
</script>

https://github.com/slanatech/dashblocks-template/blob/master/src/views/SampleDashboard.vue

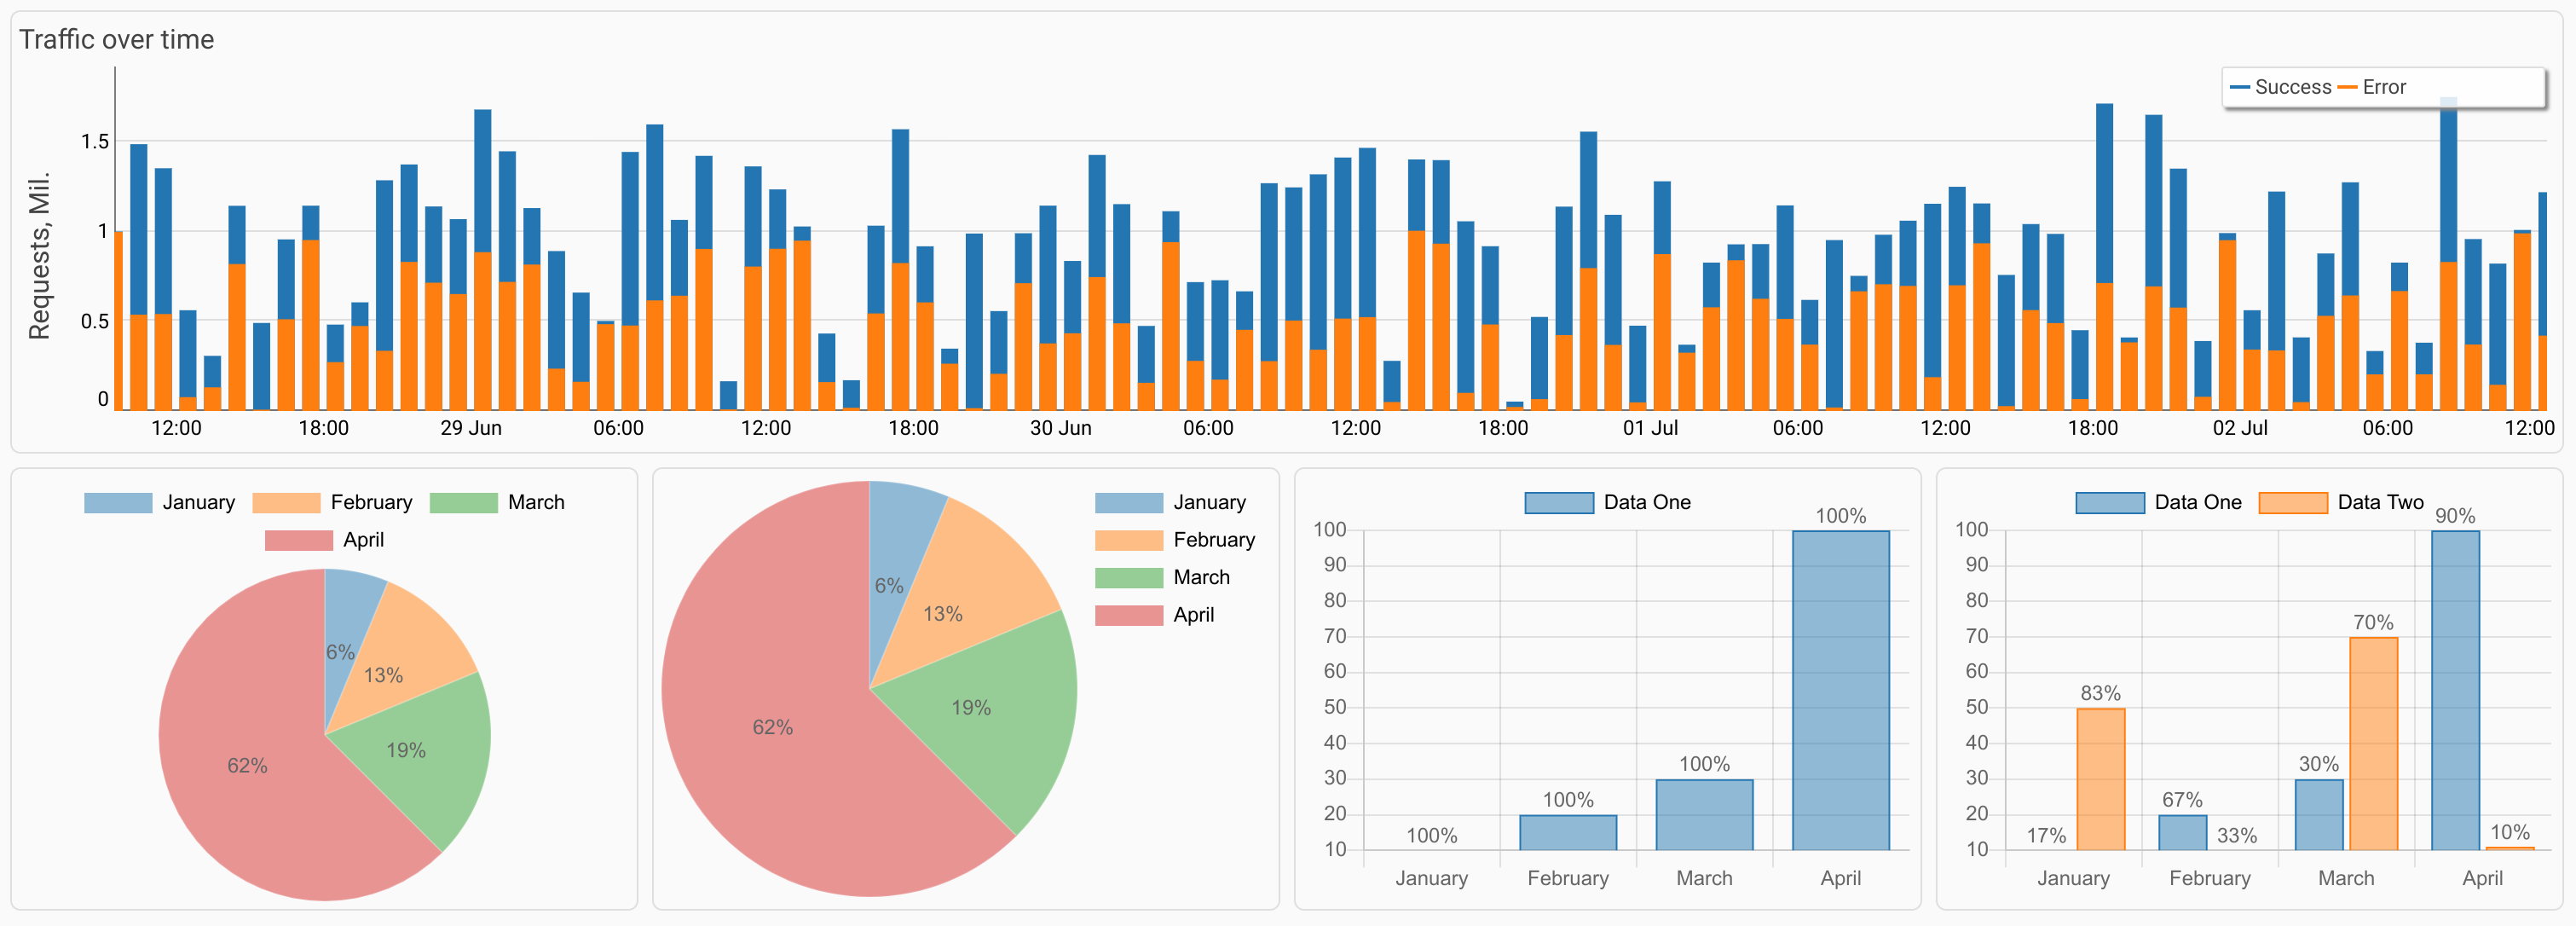
And here is what you get:

sample

More samples:

Roadmap

Roadmap and plans are roughly defined in TODO

License

MIT

Note that the project description data, including the texts, logos, images, and/or trademarks, for each open source project belongs to its rightful owner. If you wish to add or remove any projects, please contact us at [email protected].