qyvlik / Chart.qml
Licence: mit
Chart.qml like Chart.js
Stars: ✭ 100
Projects that are alternatives of or similar to Chart.qml
Chartkick.py
Create beautiful Javascript charts with minimal code
Stars: ✭ 695 (+595%)
Mutual labels: chart, chartjs
Luckysheet
Luckysheet is an online spreadsheet like excel that is powerful, simple to configure, and completely open source.
Stars: ✭ 9,772 (+9672%)
Mutual labels: chart, canvas
Tui.chart
🍞📊 Beautiful chart for data visualization.
Stars: ✭ 5,041 (+4941%)
Mutual labels: chart, canvas
Hqchart
HQChart - H5, 微信小程序 沪深/港股/数字货币/期货/美股 K线图(kline),走势图,缩放,拖拽,十字光标,画图工具,截图,筹码图. 分析家语法,通达信语法,(麦语法),第3方数据替换接口
Stars: ✭ 1,126 (+1026%)
Mutual labels: chart, canvas
Awesome Qt Qml
A curated list of awesome Qt and QML libraries, resources, projects, and shiny things.
Stars: ✭ 1,118 (+1018%)
Mutual labels: qtquick, qml
Deep Viz
A React component library, providing concise and beautiful diversity charts with Canvas, SVG, E-map, WebGL, Dom, based on data visualization experience and commercial data display practice.
Stars: ✭ 55 (-45%)
Mutual labels: chartjs, canvas
Wx Charts
微信小程序图表charts组件,Charts for WeChat Mini Program
Stars: ✭ 4,633 (+4533%)
Mutual labels: chart, canvas
Taoquick
a cool QtQuick/qml component library and demo(一套酷炫的QtQuick/Qml基础库和示例)
Stars: ✭ 481 (+381%)
Mutual labels: qtquick, qml
Go Chartjs
golang library to make https://chartjs.org/ plots (this is vanilla #golang, not gopherjs)
Stars: ✭ 42 (-58%)
Mutual labels: chart, chartjs
Laravel Chartjs
Simple package to facilitate and automate the use of charts in Laravel 5.x using Chartjs v2 library
Stars: ✭ 404 (+304%)
Mutual labels: chart, chartjs
Kaidan
[Replaced by https://invent.kde.org/network/kaidan] Kaidan, a simple and user-friendly Jabber/XMPP client for every device and platform.
Stars: ✭ 67 (-33%)
Mutual labels: qtquick, qml
Chart.qml
// draw a bar
object bar(data,option)

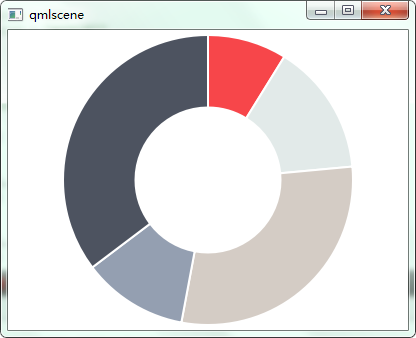
// draw a doughnut
object doughnut(data,option)

// draw a line
object line(data,option)

// draw a pie
object pie(data,option)

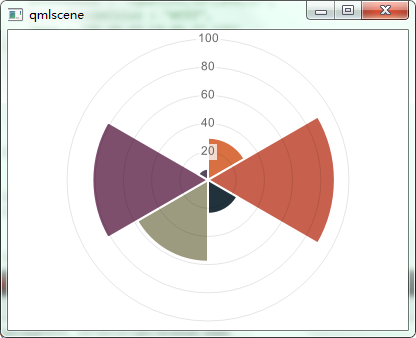
// draw a polarArea
object polarArea(data,option)

// draw a radar
object radar(data,option)
bar
bar({
    labels : ["一月","February","March","April","May","June","July"],
    datasets : [
        {
            fillColor : "rgba(220,220,220,0.5)",
            strokeColor : "rgba(220,220,220,1)",
            data : [test,59,90,81,56,55,40]
        },
        {
            fillColor : "rgba(151,187,205,0.5)",
            strokeColor : "rgba(151,187,205,1)",
            data : [28,48,40,19,96,27,100]
        }
    ]
    });
doughnut
doughnut([
             {
                 value: 30,
                 color:"#F7464A"
             },
             {
                 value : 50,
                 color : "#E2EAE9"
             },
             {
                 value : 100,
                 color : "#D4CCC5"
             },
             {
                 value : 40,
                 color : "#949FB1"
             },
             {
                 value : 120,
                 color : "#4D5360"
             }

         ]);
line
line({
         labels : ["January","February","March","April","May","June","July"],
         datasets : [
             {
                 fillColor : "rgba(220,220,220,0.5)",
                 strokeColor : "rgba(220,220,220,1)",
                 pointColor : "rgba(220,220,220,1)",
                 pointStrokeColor : "#fff",
                 data : [65,59,90,81,56,55,40]
             },
             {
                 fillColor : "rgba(151,187,205,0.5)",
                 strokeColor : "rgba(151,187,205,1)",
                 pointColor : "rgba(151,187,205,1)",
                 pointStrokeColor : "#fff",
                 data : [28,48,40,19,96,27,100]
             }
         ]
     });
pie
pie([
        {
            value: 30,
            color:"#F38630"
        },
        {
            value : 50,
            color : "#E0E4CC"
        },
        {
            value : 100,
            color : "#69D2E7"
        }
    ]);
polarArea
polarArea([
              {
                  value : 30,
                  color: "#D97041"
              },
              {
                  value : 90,
                  color: "#C7604C"
              },
              {
                  value : 24,
                  color: "#21323D"
              },
              {
                  value : 58,
                  color: "#9D9B7F"
              },
              {
                  value : 82,
                  color: "#7D4F6D"
              },
              {
                  value : 8,
                  color: "#584A5E"
              }
          ]);
radar
radar( {
          labels : ["Eating","Drinking","Sleeping","Designing","Coding","Partying","Running"],
          datasets : [
              {
                  fillColor : "rgba(220,220,220,0.5)",
                  strokeColor : "rgba(220,220,220,1)",
                  pointColor : "rgba(220,220,220,1)",
                  pointStrokeColor : "#fff",
                  data : [65,59,90,81,56,55,40]
              },
              {
                  fillColor : "rgba(151,187,205,0.5)",
                  strokeColor : "rgba(151,187,205,1)",
                  pointColor : "rgba(151,187,205,1)",
                  pointStrokeColor : "#fff",
                  data : [28,48,40,19,96,27,100]
              }
          ]
      });
Note that the project description data, including the texts, logos, images, and/or trademarks,
for each open source project belongs to its rightful owner.
If you wish to add or remove any projects, please contact us at [email protected].


