sunny0826 / Cms Grafana Builder
Licence: apache-2.0
helps you run a grafana server that include aliyun cms dashboard.
Stars: ✭ 26
Programming Languages
python
139335 projects - #7 most used programming language
Projects that are alternatives of or similar to Cms Grafana Builder
Reporter
Service that generates a PDF report from a Grafana dashboard
Stars: ✭ 581 (+2134.62%)
Mutual labels: grafana, grafana-dashboard
fronius-to-influx
Collect Fronius inverter data and save in Influxdb for Grafana
Stars: ✭ 31 (+19.23%)
Mutual labels: grafana, grafana-dashboard
tado-exporter
A Prometheus exporter for tado smart heating solution
Stars: ✭ 32 (+23.08%)
Mutual labels: grafana, grafana-dashboard
Prometheusalert
Prometheus Alert是开源的运维告警中心消息转发系统,支持主流的监控系统Prometheus,Zabbix,日志系统Graylog和数据可视化系统Grafana发出的预警消息,支持钉钉,微信,华为云短信,腾讯云短信,腾讯云电话,阿里云短信,阿里云电话等
Stars: ✭ 822 (+3061.54%)
Mutual labels: aliyun, grafana
Prometheus
A docker-compose stack for Prometheus monitoring
Stars: ✭ 3,383 (+12911.54%)
Mutual labels: grafana, grafana-dashboard
Prometheus-grafana
Monitor your Kubernetes cluster resources and applications
Stars: ✭ 21 (-19.23%)
Mutual labels: grafana, grafana-dashboard
grafonnet-playground
Playground for grafanna with jsonnet
Stars: ✭ 25 (-3.85%)
Mutual labels: grafana, grafana-dashboard
burrow-kafka-dashboard
Kubernetes Kafka Overview, Burrow consumer lag stats, Kafka disk usage
Stars: ✭ 37 (+42.31%)
Mutual labels: grafana, grafana-dashboard
atop-graphite-grafana-monitoring
Tools to extract raw system counters from atop, aggregate them to generate high level performance metrics, whose are then injected into a Graphite database and visualize through Grafana dashboards.
Stars: ✭ 15 (-42.31%)
Mutual labels: grafana, grafana-dashboard
ruuvitag-demo
Demo of reading Bluetooth Low Energy sensor measurements of RuuviTag environmental sensors and feeding them to MQTT, a database and dashboards
Stars: ✭ 14 (-46.15%)
Mutual labels: grafana, grafana-dashboard
Darknet chinesetrading
🚇暗网中文网监控爬虫(DEEPMIX)
Stars: ✭ 649 (+2396.15%)
Mutual labels: grafana, grafana-dashboard
Pihole Exporter
A Prometheus exporter for PI-Hole's Raspberry PI ad blocker
Stars: ✭ 352 (+1253.85%)
Mutual labels: grafana, grafana-dashboard
grafana-aws-cost-explorer-backend
Grafana Backend for AWS Cost Explorer
Stars: ✭ 24 (-7.69%)
Mutual labels: grafana, grafana-dashboard
victoriametrics-ru-links
Список постов и видеозаписей об VictoriaMetrics на русском языке
Stars: ✭ 1 (-96.15%)
Mutual labels: grafana, grafana-dashboard
kafka-consumer-lag-monitoring
Client tool that exports the consumer lag of Kafka consumer groups to Prometheus or your terminal
Stars: ✭ 45 (+73.08%)
Mutual labels: grafana, grafana-dashboard
nifi-prometheus-reporter
A reporting task in Nifi which is capable of sending monitoring statistics as prometheus metrics to a prometheus pushgateway.
Stars: ✭ 48 (+84.62%)
Mutual labels: grafana, grafana-dashboard
yearn-exporter
Realtime and historical Yearn metrics
Stars: ✭ 80 (+207.69%)
Mutual labels: grafana, grafana-dashboard
idrac snmp-grafana
SNMP Based Dashboard to Monitor Dell Hosts via iDRAC
Stars: ✭ 88 (+238.46%)
Mutual labels: grafana, grafana-dashboard
nfCollector
Collects Netflow version 1, 5, 6, 7, 9 & IPFIX & stores them on InfluxData time-series DB (InfluxDB)
Stars: ✭ 30 (+15.38%)
Mutual labels: grafana, grafana-dashboard
Grabana
User-friendly Go library for building Grafana dashboards
Stars: ✭ 313 (+1103.85%)
Mutual labels: grafana, grafana-dashboard
cms-grafana
English | 简体中文
Aliyun CMS Grafana Dashboard
Current chart version is 0.5.1
Introduction
This chart helps you run a grafana server that include aliyun cms dashboard.
Quick Start
You can use the docker to experience the full functionality, with this should only be applied to local, production environments please use helm.
docker run -d -p 3000:3000 -e ACCESS_KEY_ID={your_access_key_id} -e ACCESS_SECRET={your_access_secret} guoxudongdocker/grafana-cms-run:0.5.0
Installing the Chart
Helm v3
Download cms-grafana-0.5.0.tgz package to install in release.
To install the chart with the release name my-release:
# start
$ helm install my-release cms-grafana-0.5.0.tgz \
--namespace {your_namespace} \
--set access_key_id={your_access_key_id} \
--set access_secret={your_access_secret} \
--set region_id={your_aliyun_region_id} \
--set password={admin_password}

# set ingress and open tls
helm install my-release cms-grafana-0.5.0.tgz \
--namespace {your_namespace} \
--set access_key_id={your_access_key_id} \
--set access_secret={your_access_secret} \
--set region_id={your_aliyun_region_id} \
--set password={admin_password} \
--set ingress.enabled=true \
--set ingress.hosts[0].host="{your_host}",ingress.hosts[0].paths[0]="/" \
--set ingress.tls[0].secretName="{your_tls_secret_name}",ingress.tls[0].hosts[0]="{your_tls_host}"
Please resolve the DNS to ingress.
Viewing the Grafnan dashboard
To do without ingress, you can use kubectl port-forward.
kubectl port-forward -n {your_namespace} deployment/my-release-cms-grafana 8080:8080 &
Visit http://localhost:8080 in your web browser.
Uninstall
To uninstall/delete the my-release deployment:
$ helm uninstall my-release -n {your_namespace}
Chart Values
| Key | Type | Default | Description |
|---|---|---|---|
| access_key_id | string | "" |
Aliyun Access Key Id. |
| access_secret | string | "" |
Aliyun Access Secret. |
| affinity | object | {} |
|
| anonymous | bool | false |
grafana auth anonymous enables |
| backend_image.pullPolicy | string | "Always" |
Init image backend policy. |
| backend_image.repository | string | "guoxudongdocker/grafana-build" |
Image source repository of backend image. |
| backend_image.tag | string | "0.5.0" |
Image tag of backend image. |
| backend_resources.limits.cpu | string | "200m" |
|
| backend_resources.limits.memory | string | "256Mi" |
|
| backend_resources.requests.cpu | string | "100m" |
|
| backend_resources.requests.memory | string | "256Mi" |
|
| cronjob_image.repository | string | "guoxudongdocker/curl" |
Image source repository of cronjob image. |
| cronjob_image.tag | string | "latest" |
Image tag of cronjob image. |
| dashboard | string | "dashboard,ecs,rds,mongodb,oss,eip,redis,slb" |
module of dashboard |
| image.pullPolicy | string | "IfNotPresent" |
Image pull policy. |
| image.repository | string | "grafana/grafana" |
Image source repository name. |
| ingress.annotations | object | {} |
|
| ingress.enabled | bool | false |
Whether to open ingress. |
| ingress.hosts | list | [{"host":"grafana.chart-example.local","paths":["/"]}] |
Ingress hosts. |
| ingress.tls | list | [] |
|
| init_image.pullPolicy | string | "Always" |
Init image pull policy. |
| init_image.repository | string | "guoxudongdocker/cms-grafana-jsonnet" |
Image source repository of init image. |
| init_image.tag | string | "0.1.0" |
Image tag of init image. |
| nodeSelector | object | {} |
|
| password | string | "admin" |
Grafana admin password. |
| plugins | string | "farski-blendstat-panel,grafana-simple-json-datasource,yesoreyeram-boomtheme-panel,https://github.com/sunny0826/aliyun-cms-grafana/archive/master.zip;aliyun-cms-grafana" |
Grafana plugin list. |
| region_id | string | "cn-shanghai" |
Aliyun Region Id. |
| replicaCount | int | 1 |
replica count. |
| resources.limits.cpu | string | "200m" |
|
| resources.limits.memory | string | "256Mi" |
|
| resources.requests.cpu | string | "100m" |
|
| resources.requests.memory | string | "256Mi" |
|
| schedule | string | "30 2 * * *" |
CronJob schedule. |
| service.port | int | 80 |
|
| service.type | string | "ClusterIP" |
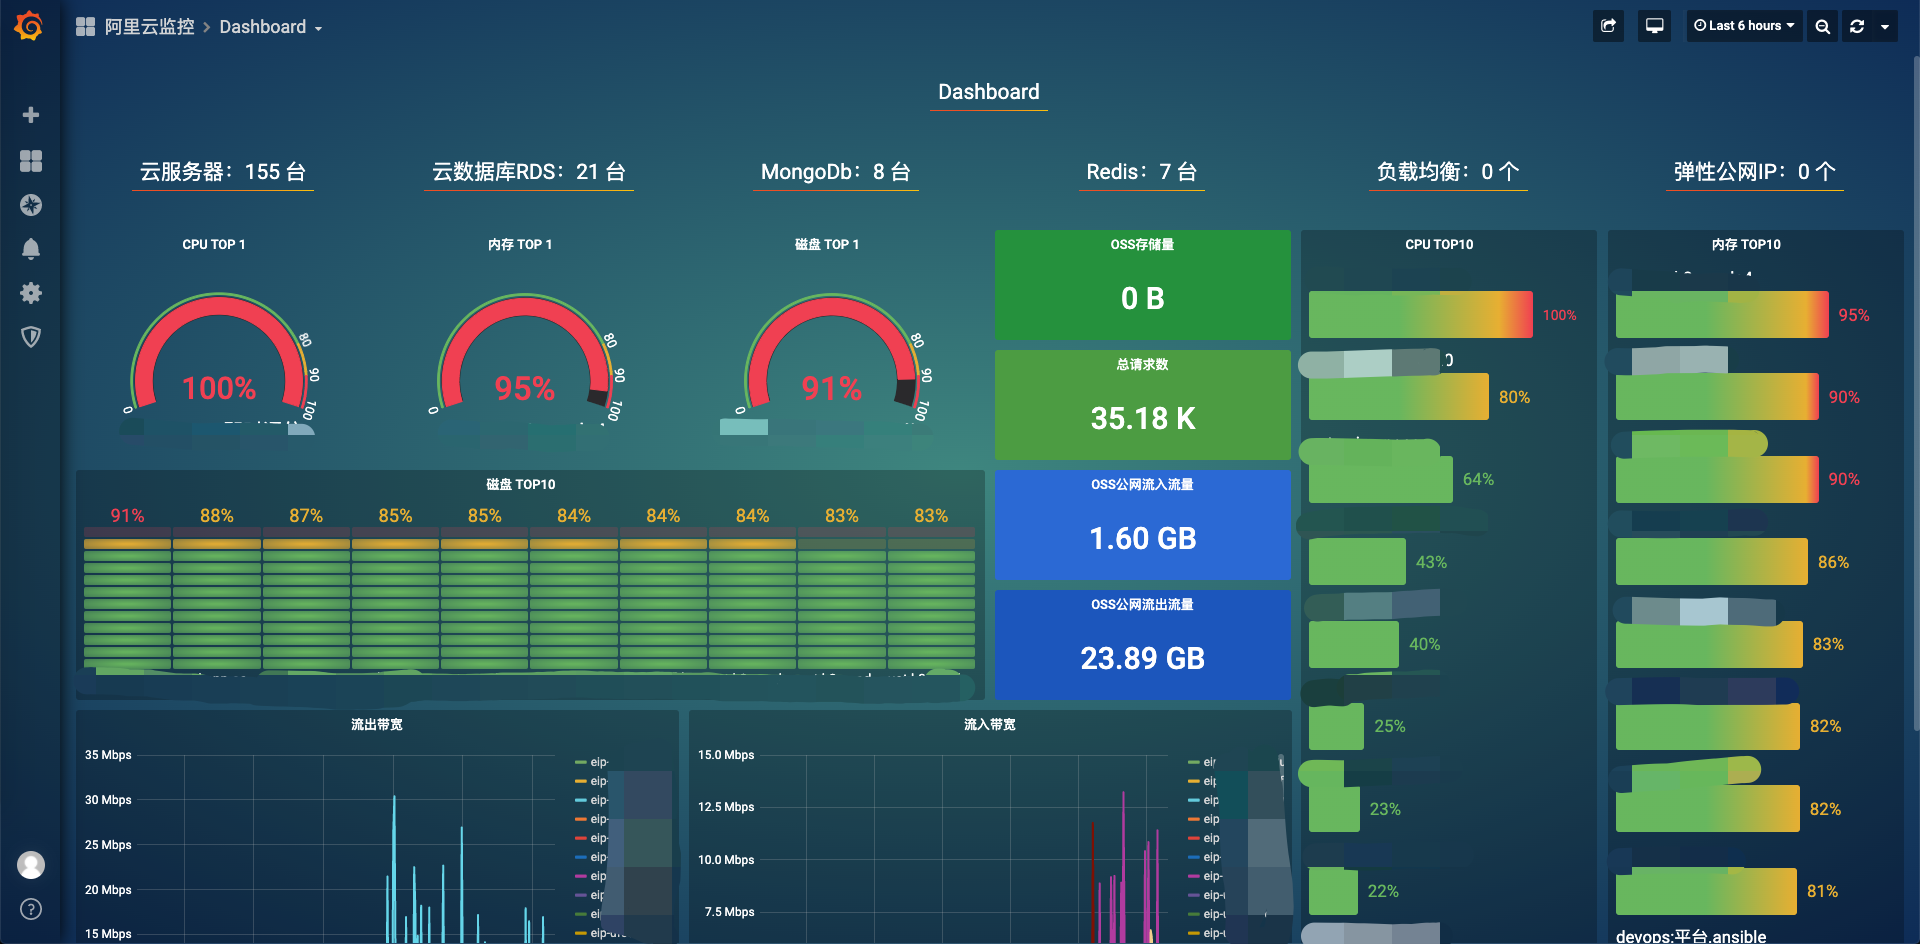
Dashboard
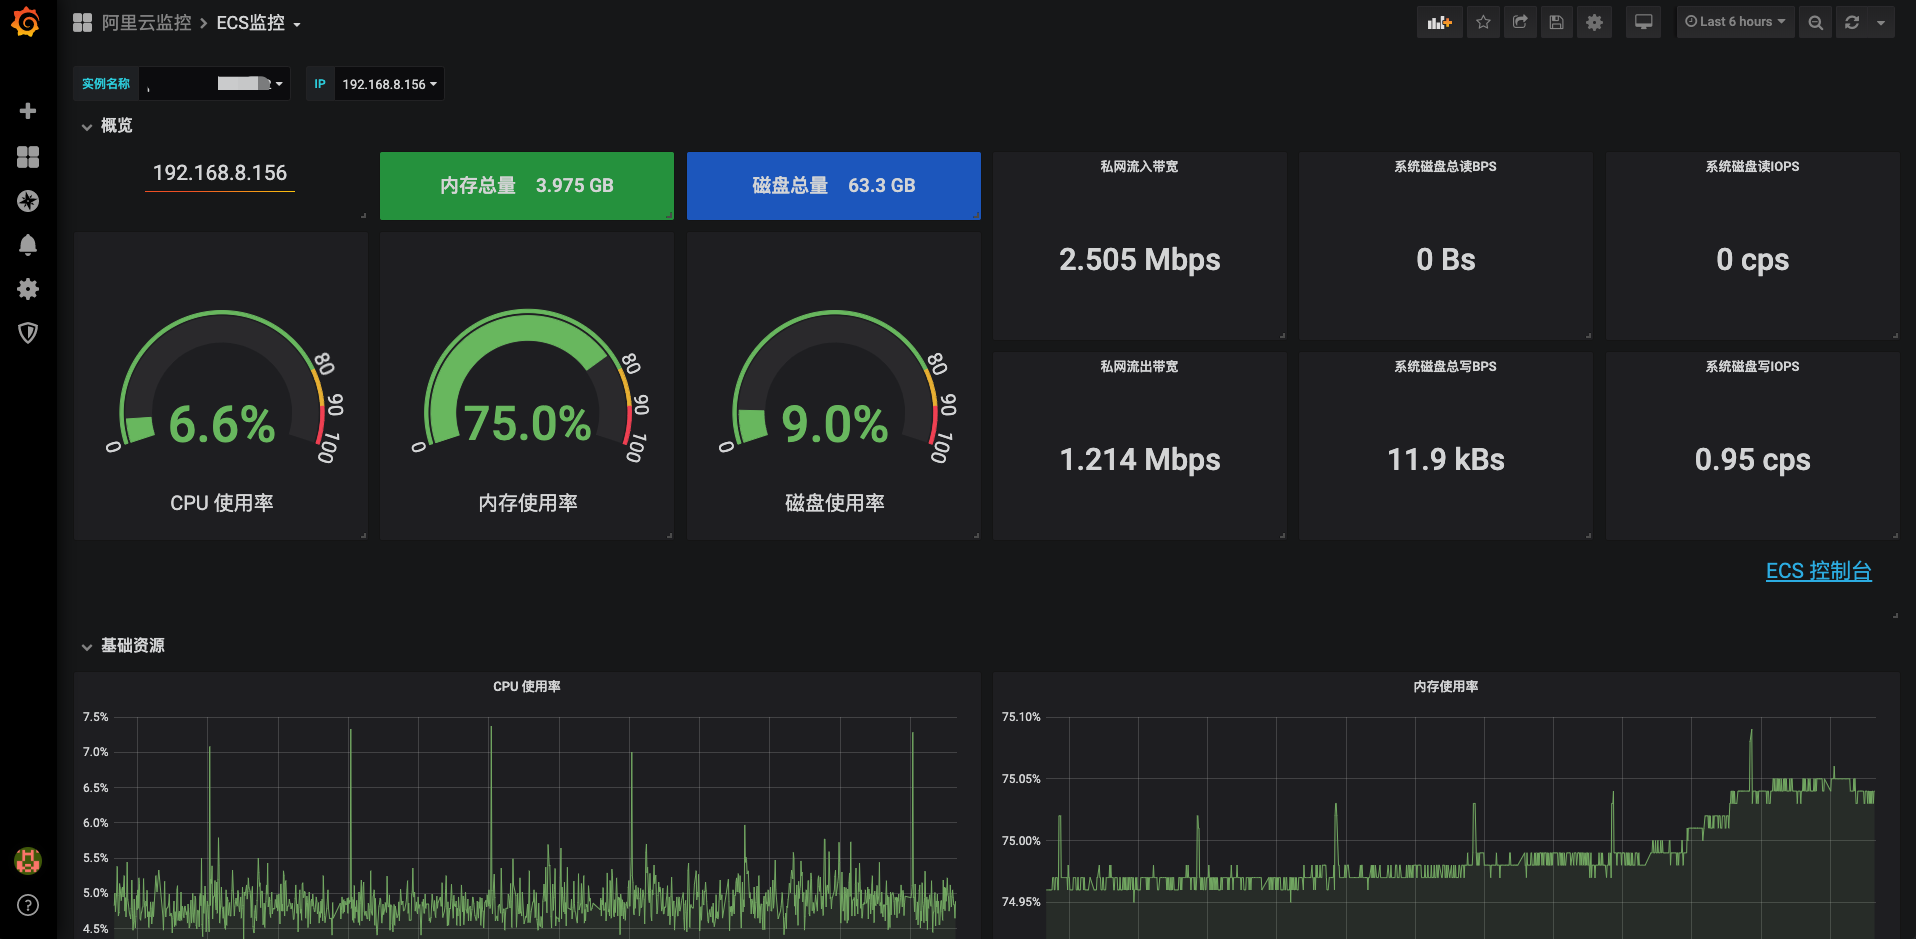
ECS
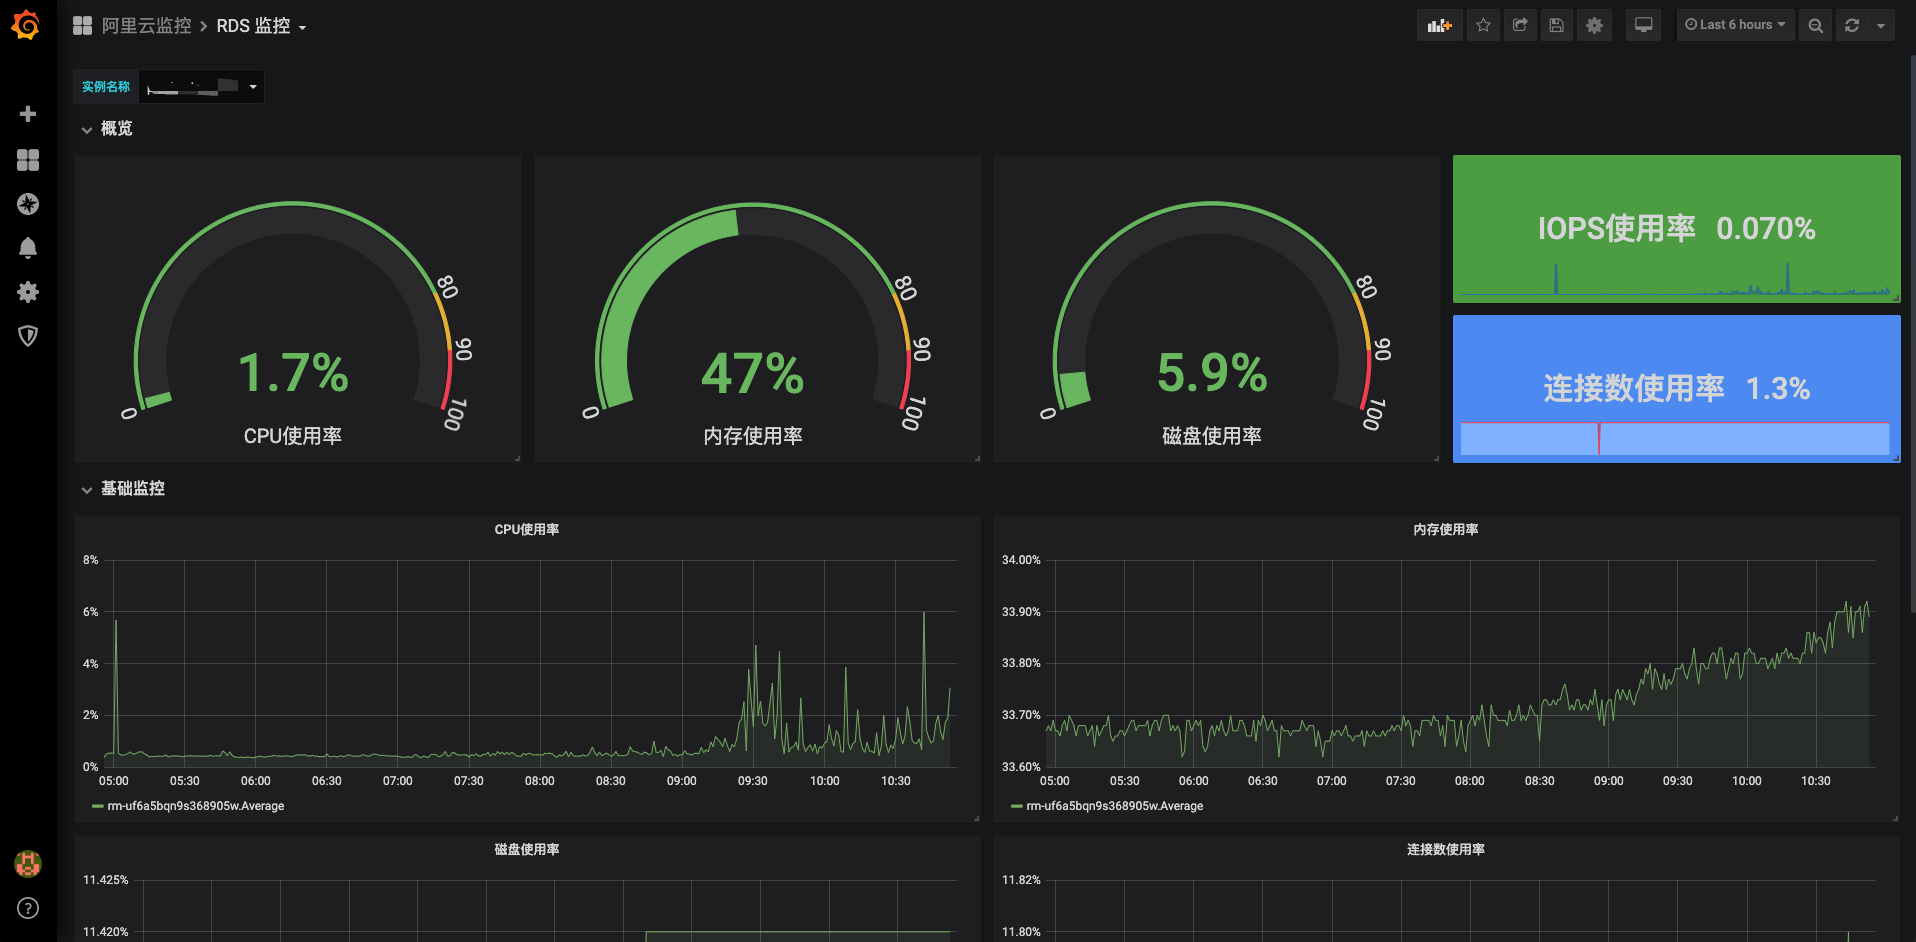
RDS
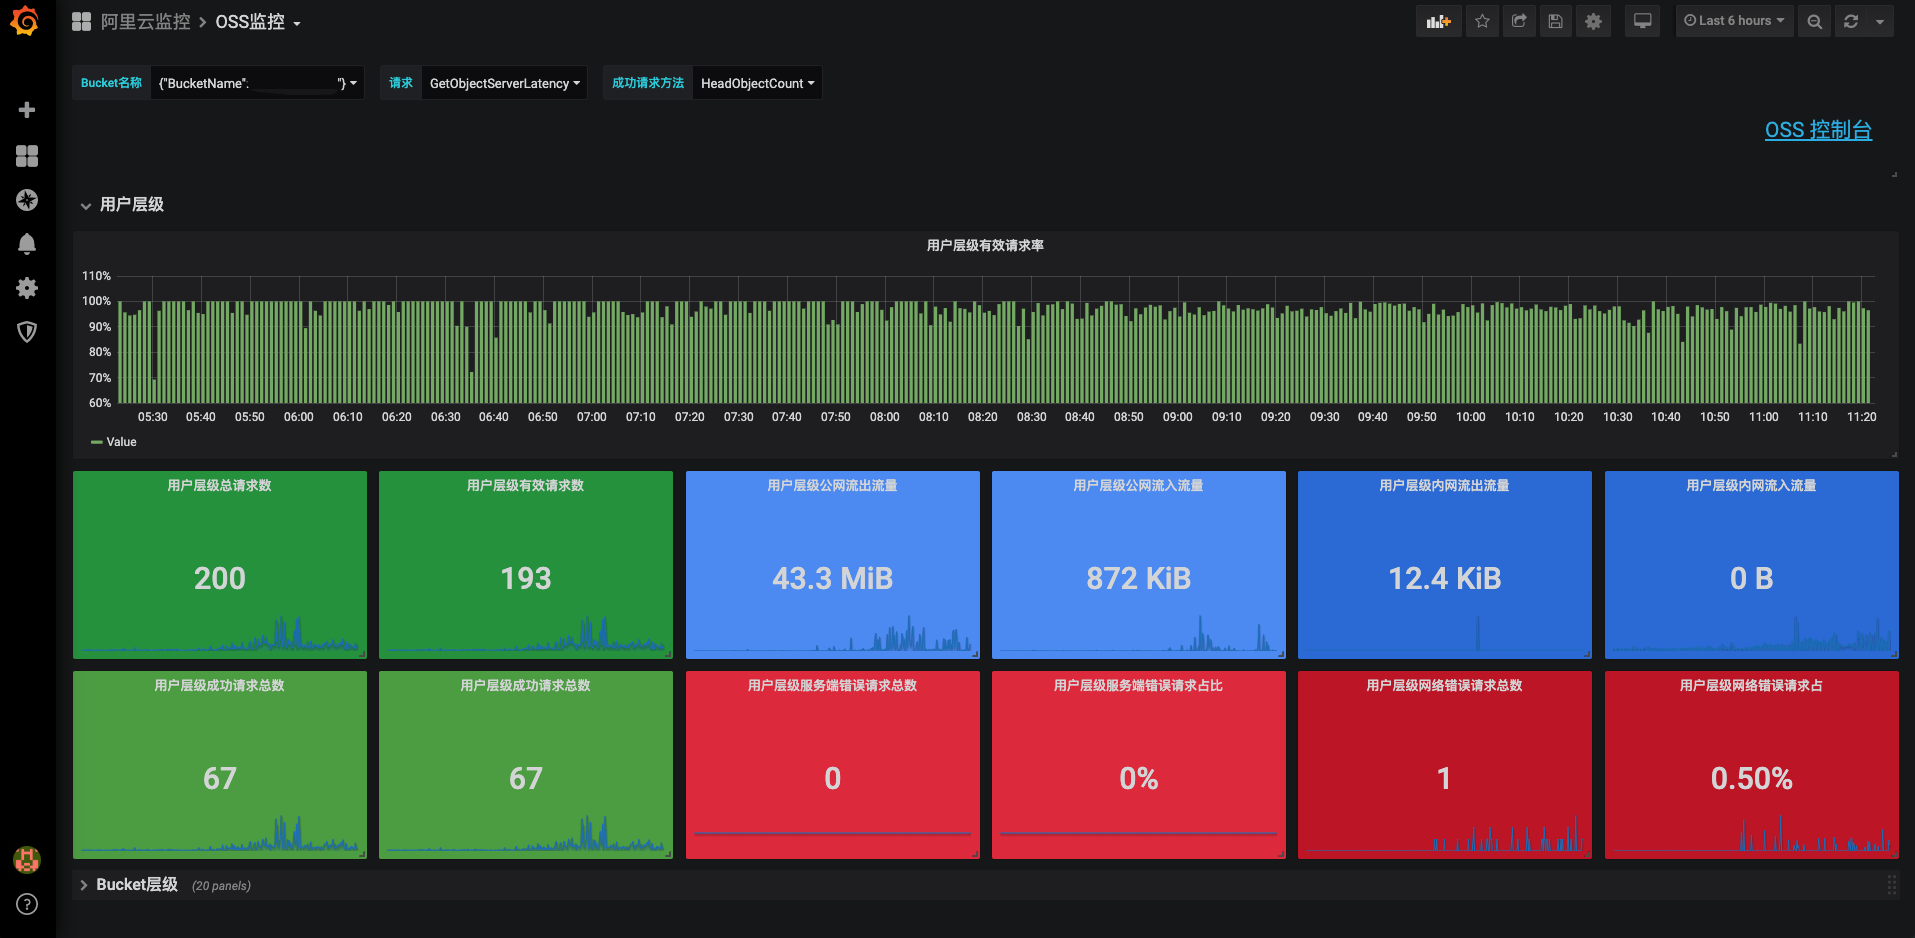
OSS
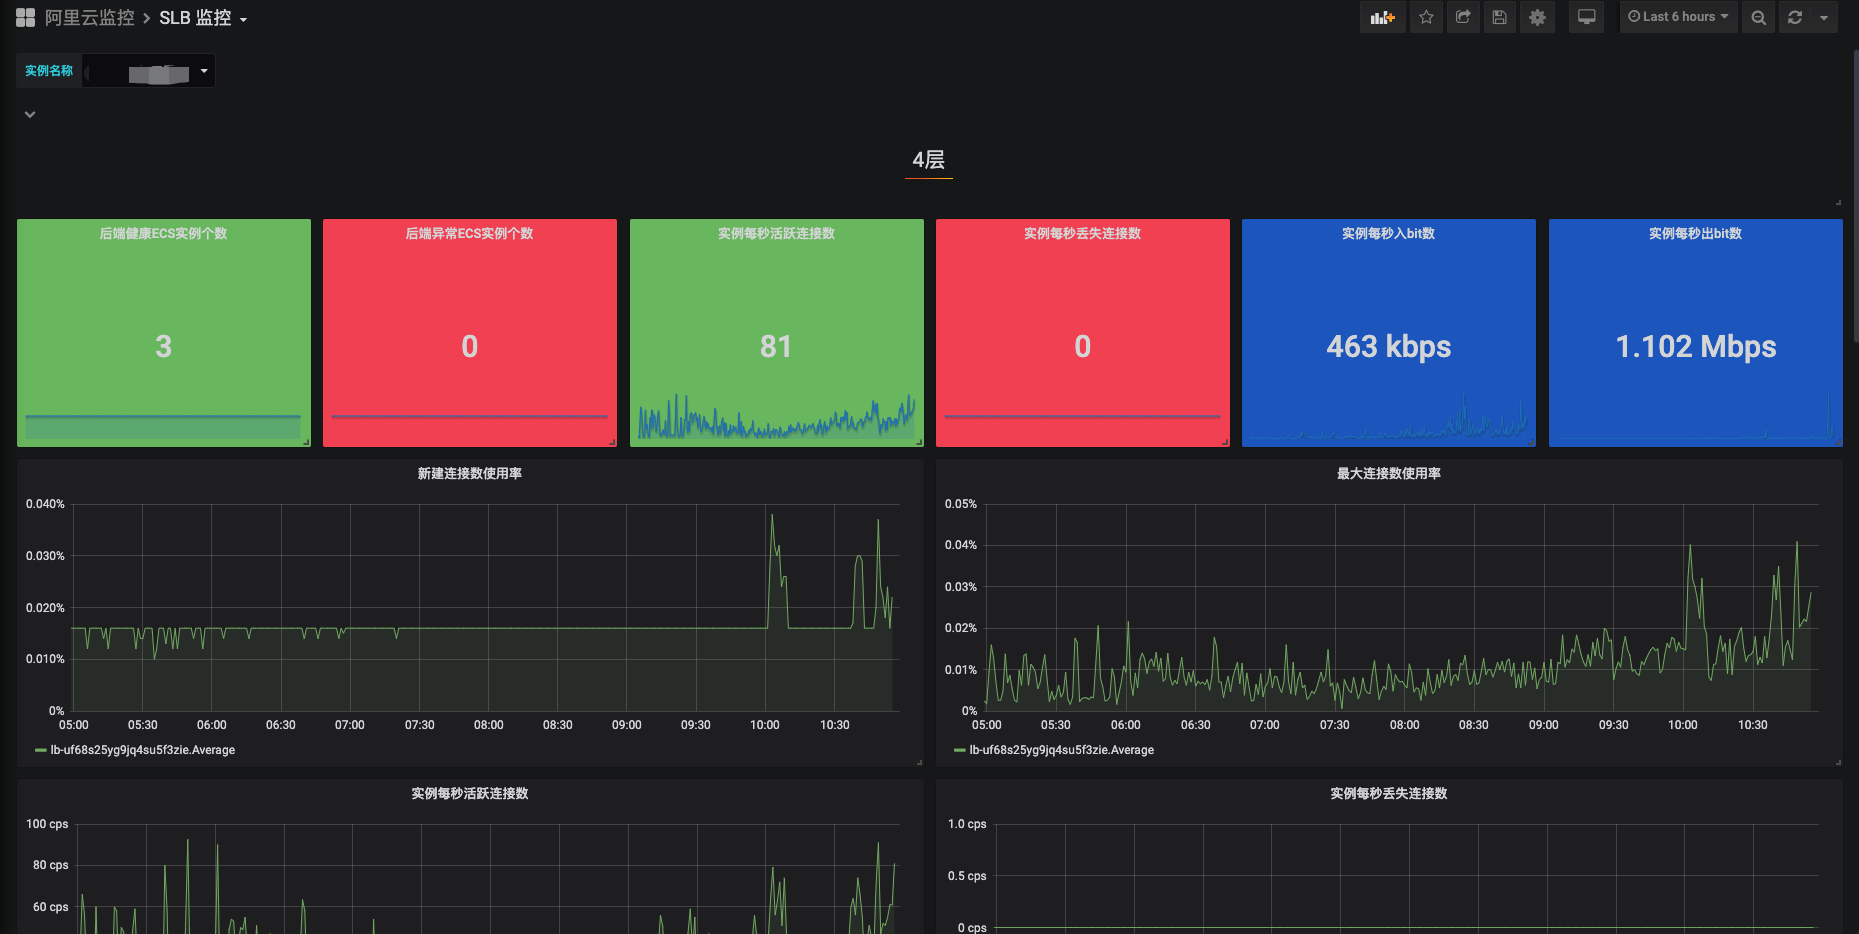
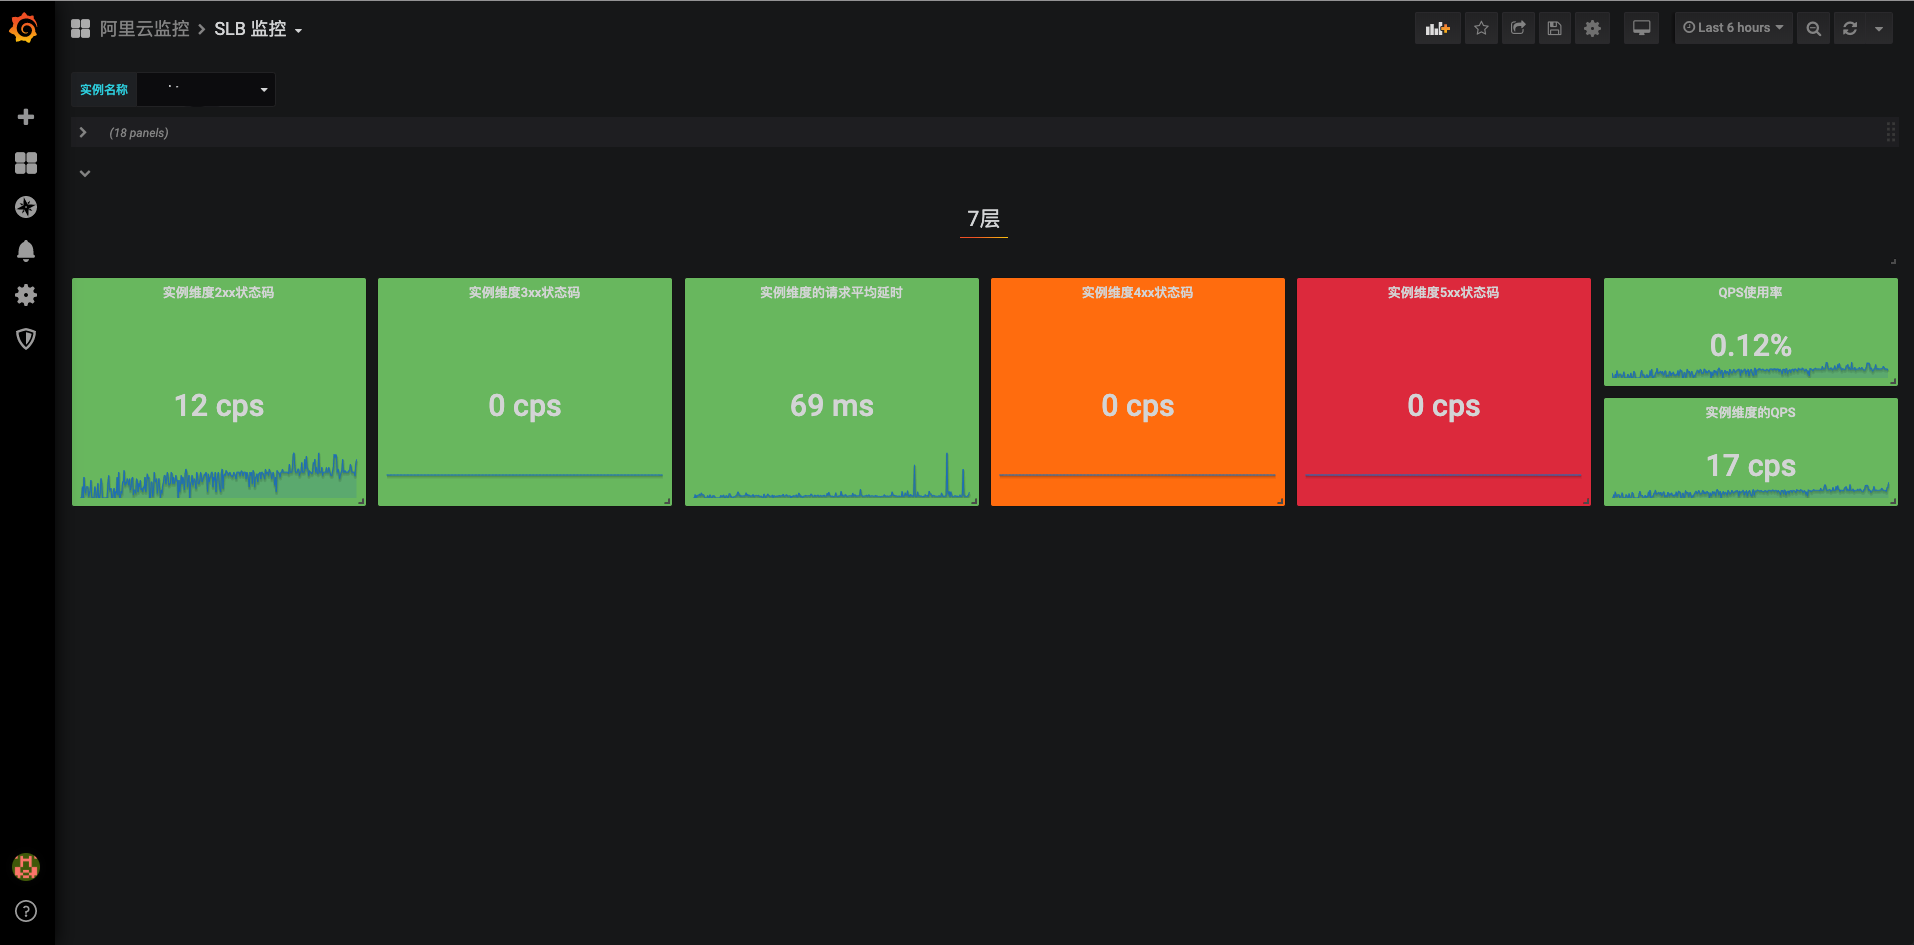
SLB
Layer 4
Layer 7
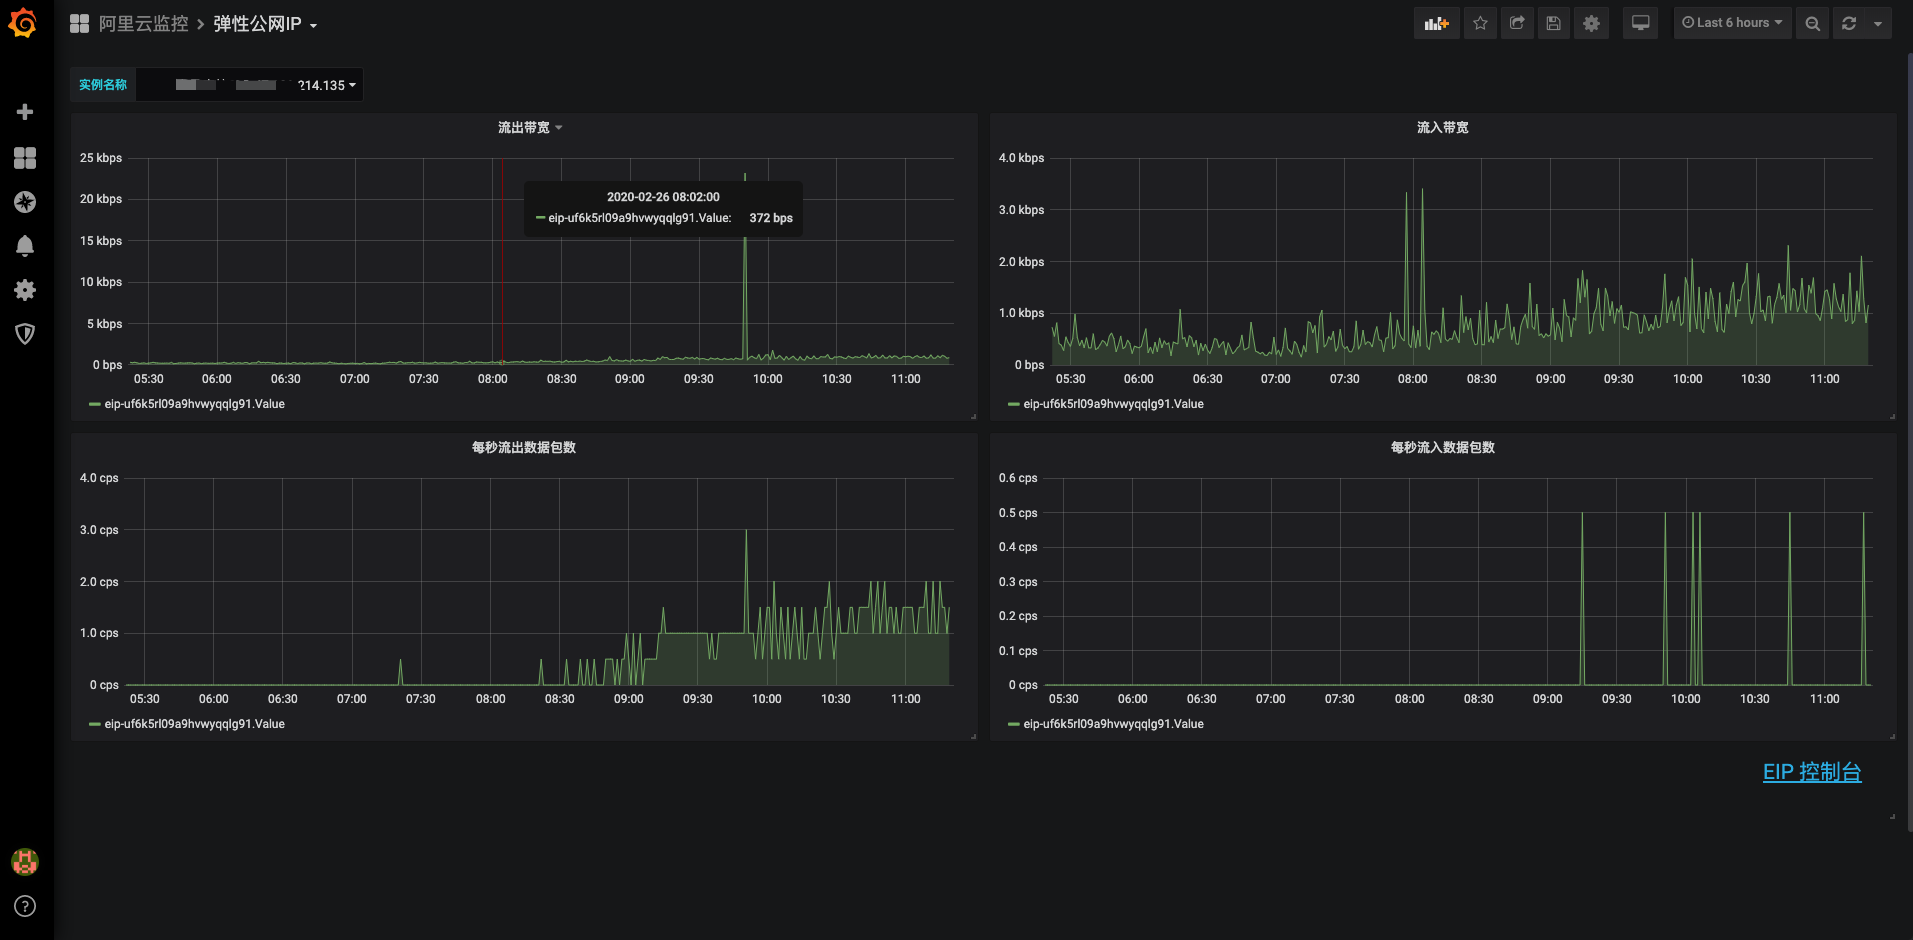
EIP
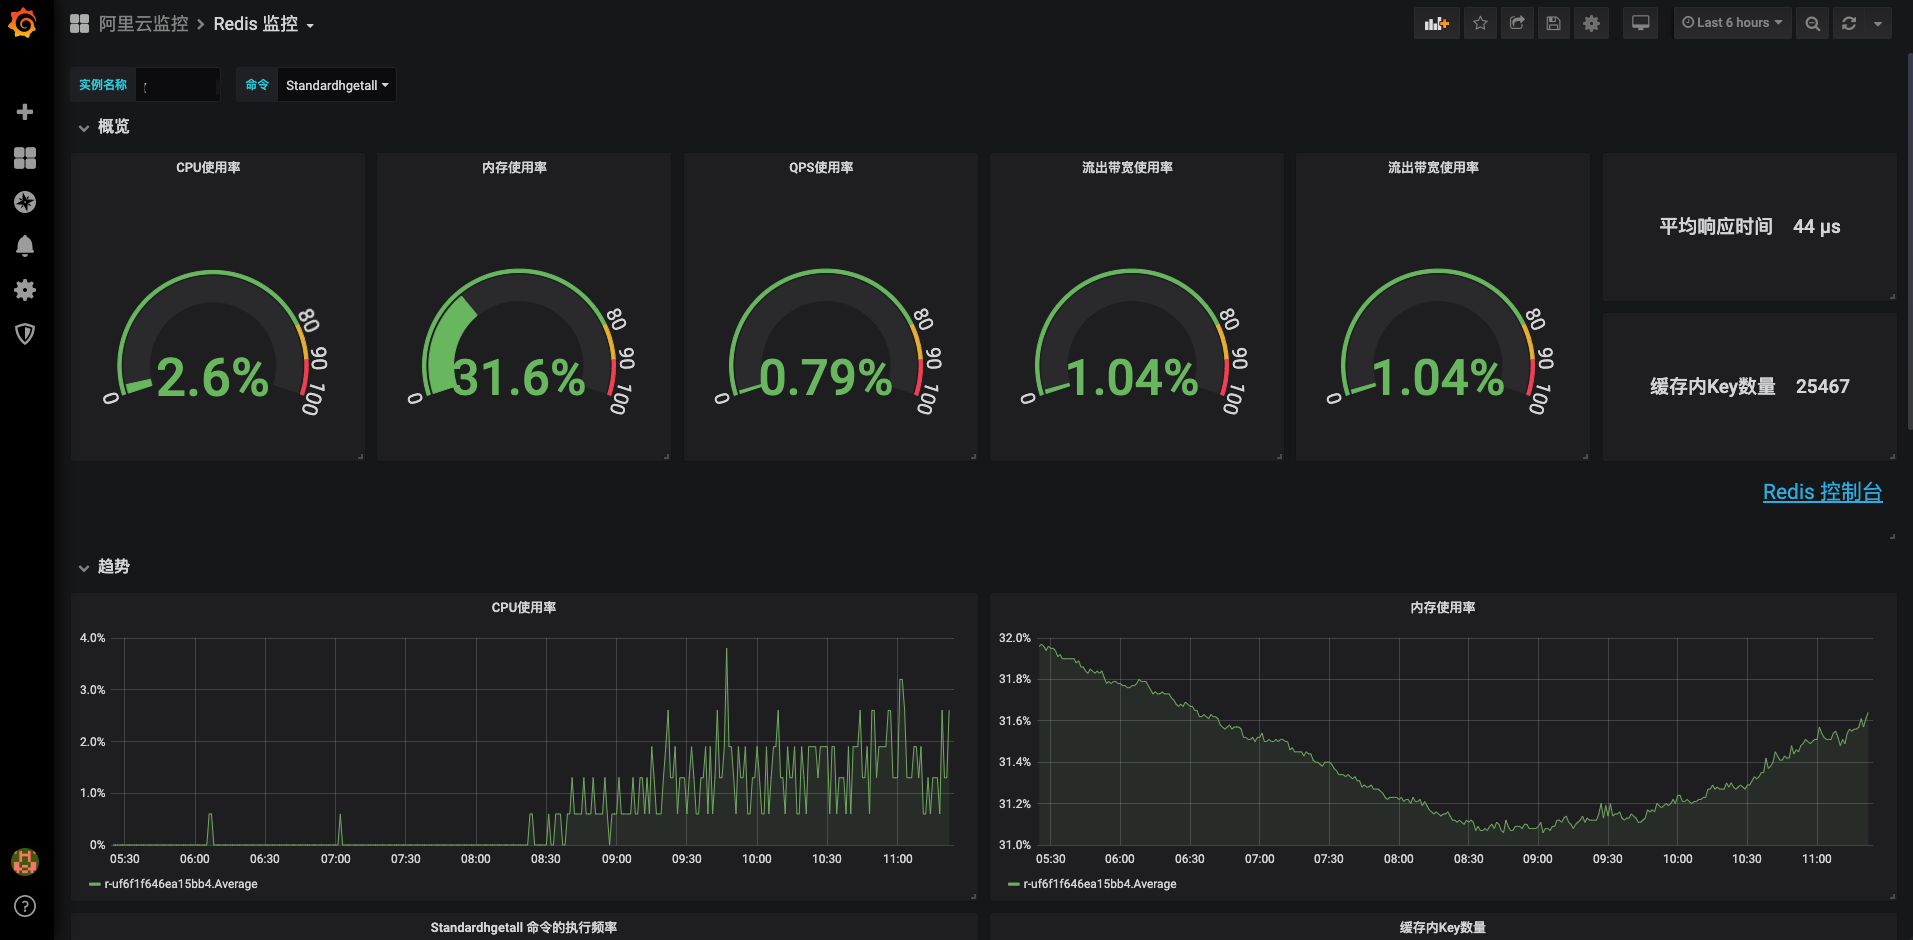
Redis
Note that the project description data, including the texts, logos, images, and/or trademarks,
for each open source project belongs to its rightful owner.
If you wish to add or remove any projects, please contact us at [email protected].


