Table of Contents
Synopsis
The Tech Track is given at @CMDA in 2018 between 8 October and 30 November.
- Courses: Frontend Applications, Functional Programming, Frontend Data
- Coordinator: Titus Wormer
- Lecturers: Titus Wormer (@wooorm) and Laurens Aarnoudse (@razpudding)
- Semester: Information Design
- Semester coordinators: Frank Kloos and Maaike van Cruchten
- Credit: 9 ECTS
- Academic year: 2018-2019
- Period: Semester 1 (fall)
- Programme: Communication and Multimedia Design (full time bachelor)
- Language: Dutch instructions and English resources
- Entry requirements: N/A
Description
In Tech Track you’ll advance your web dev skills, learn how to learn libraries and frameworks, and to create interactive visualisations from external data.
Tech Track is an elective track of three courses given in Information Design (fall semester), building further on knowledge acquired in Internetstandaarden, Inleiding Programmeren, Frontend 1, Frontend 2, and Backend.
If you’d like to continue with web development after this track, pick Minor Everything Web in the spring semester.
Here are a few examples of what students made in frontend applications:
@jessedijkman1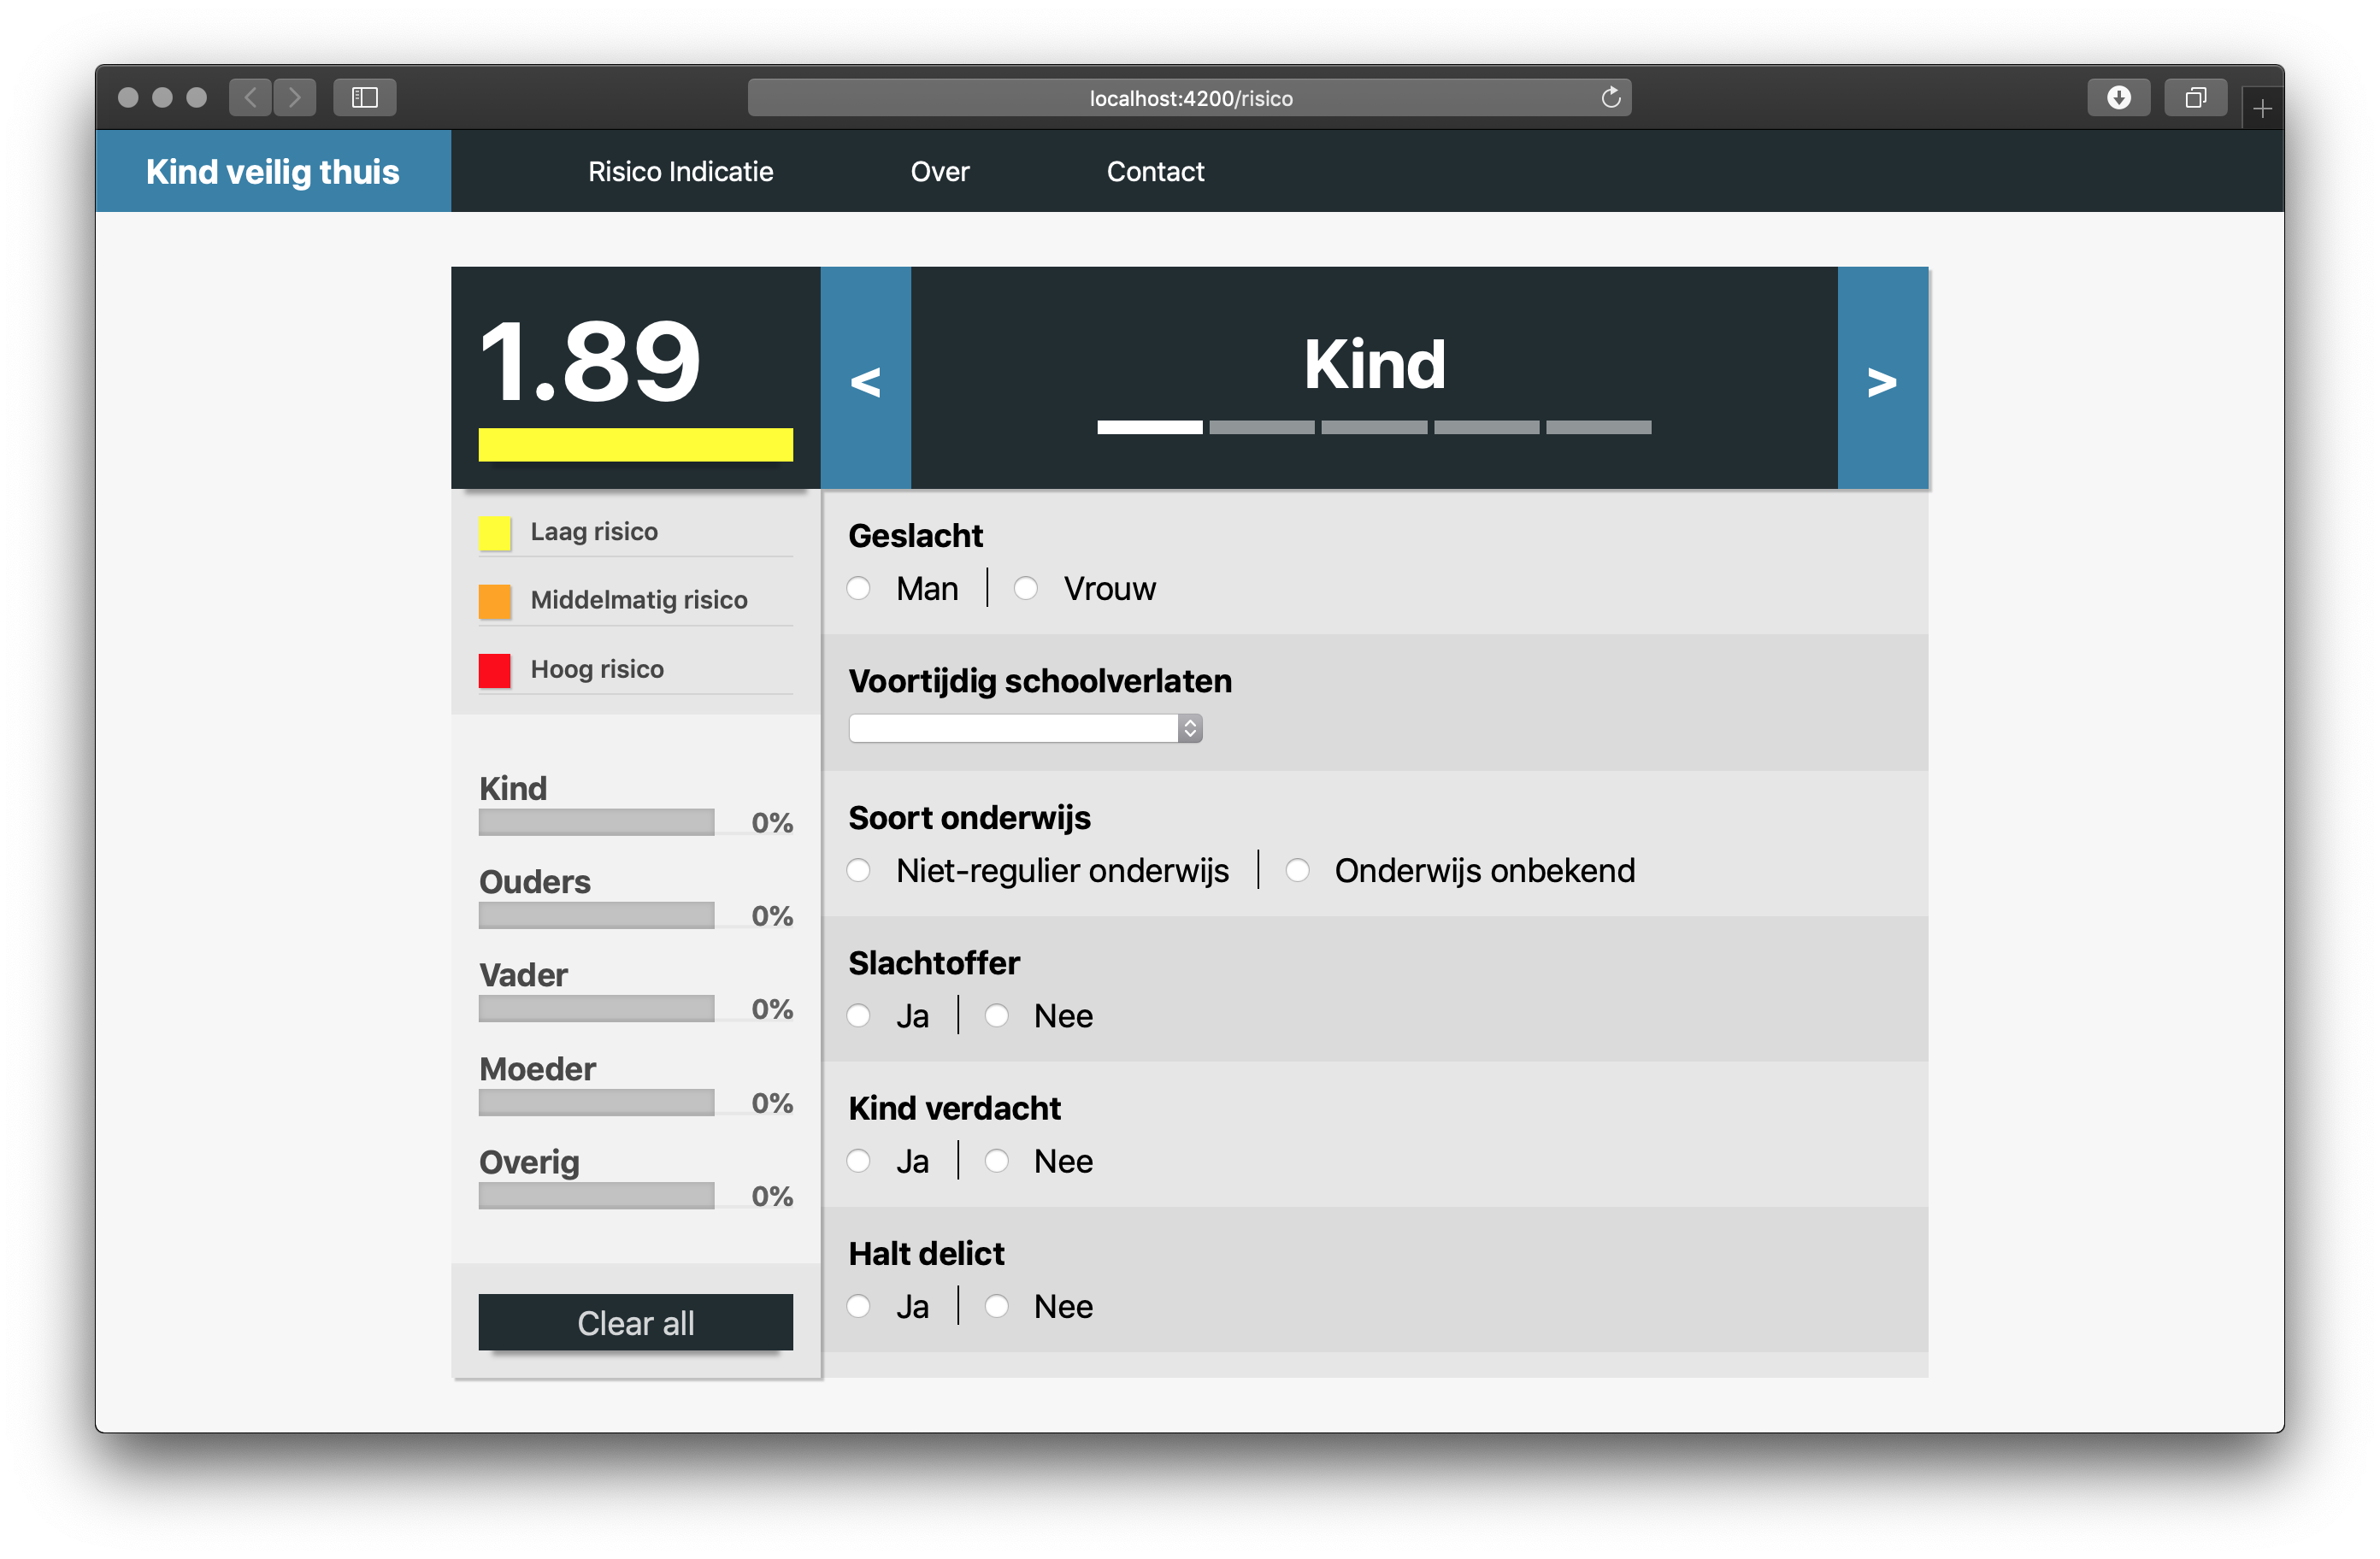 |
@rbntimes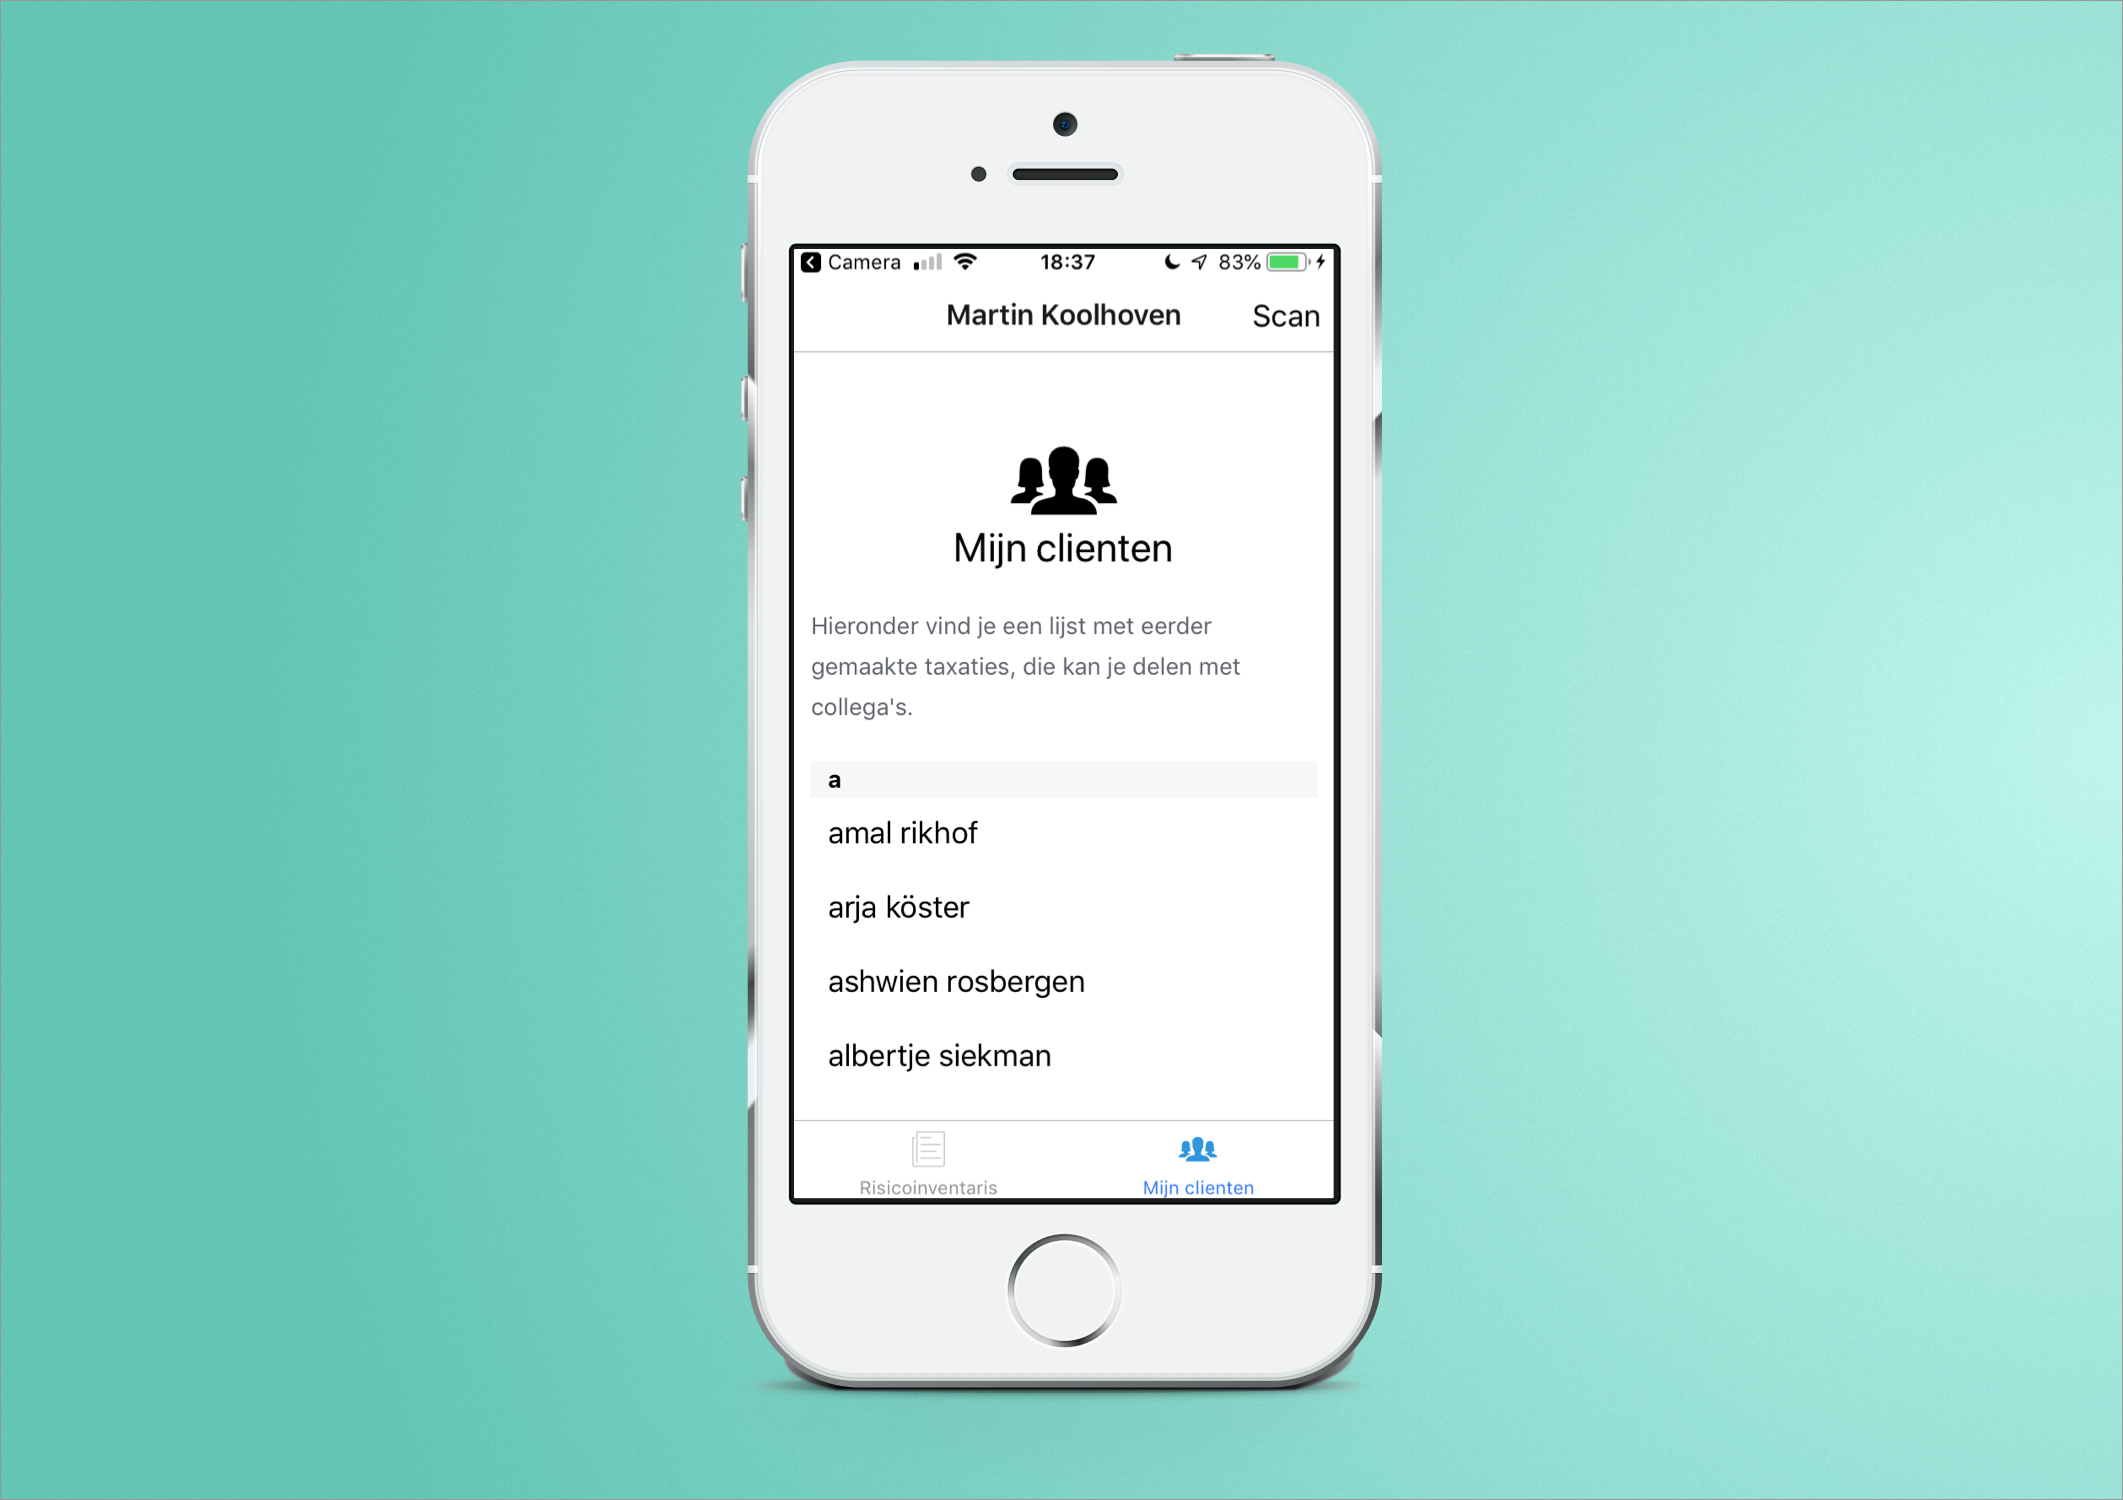 |
@timruiterkamp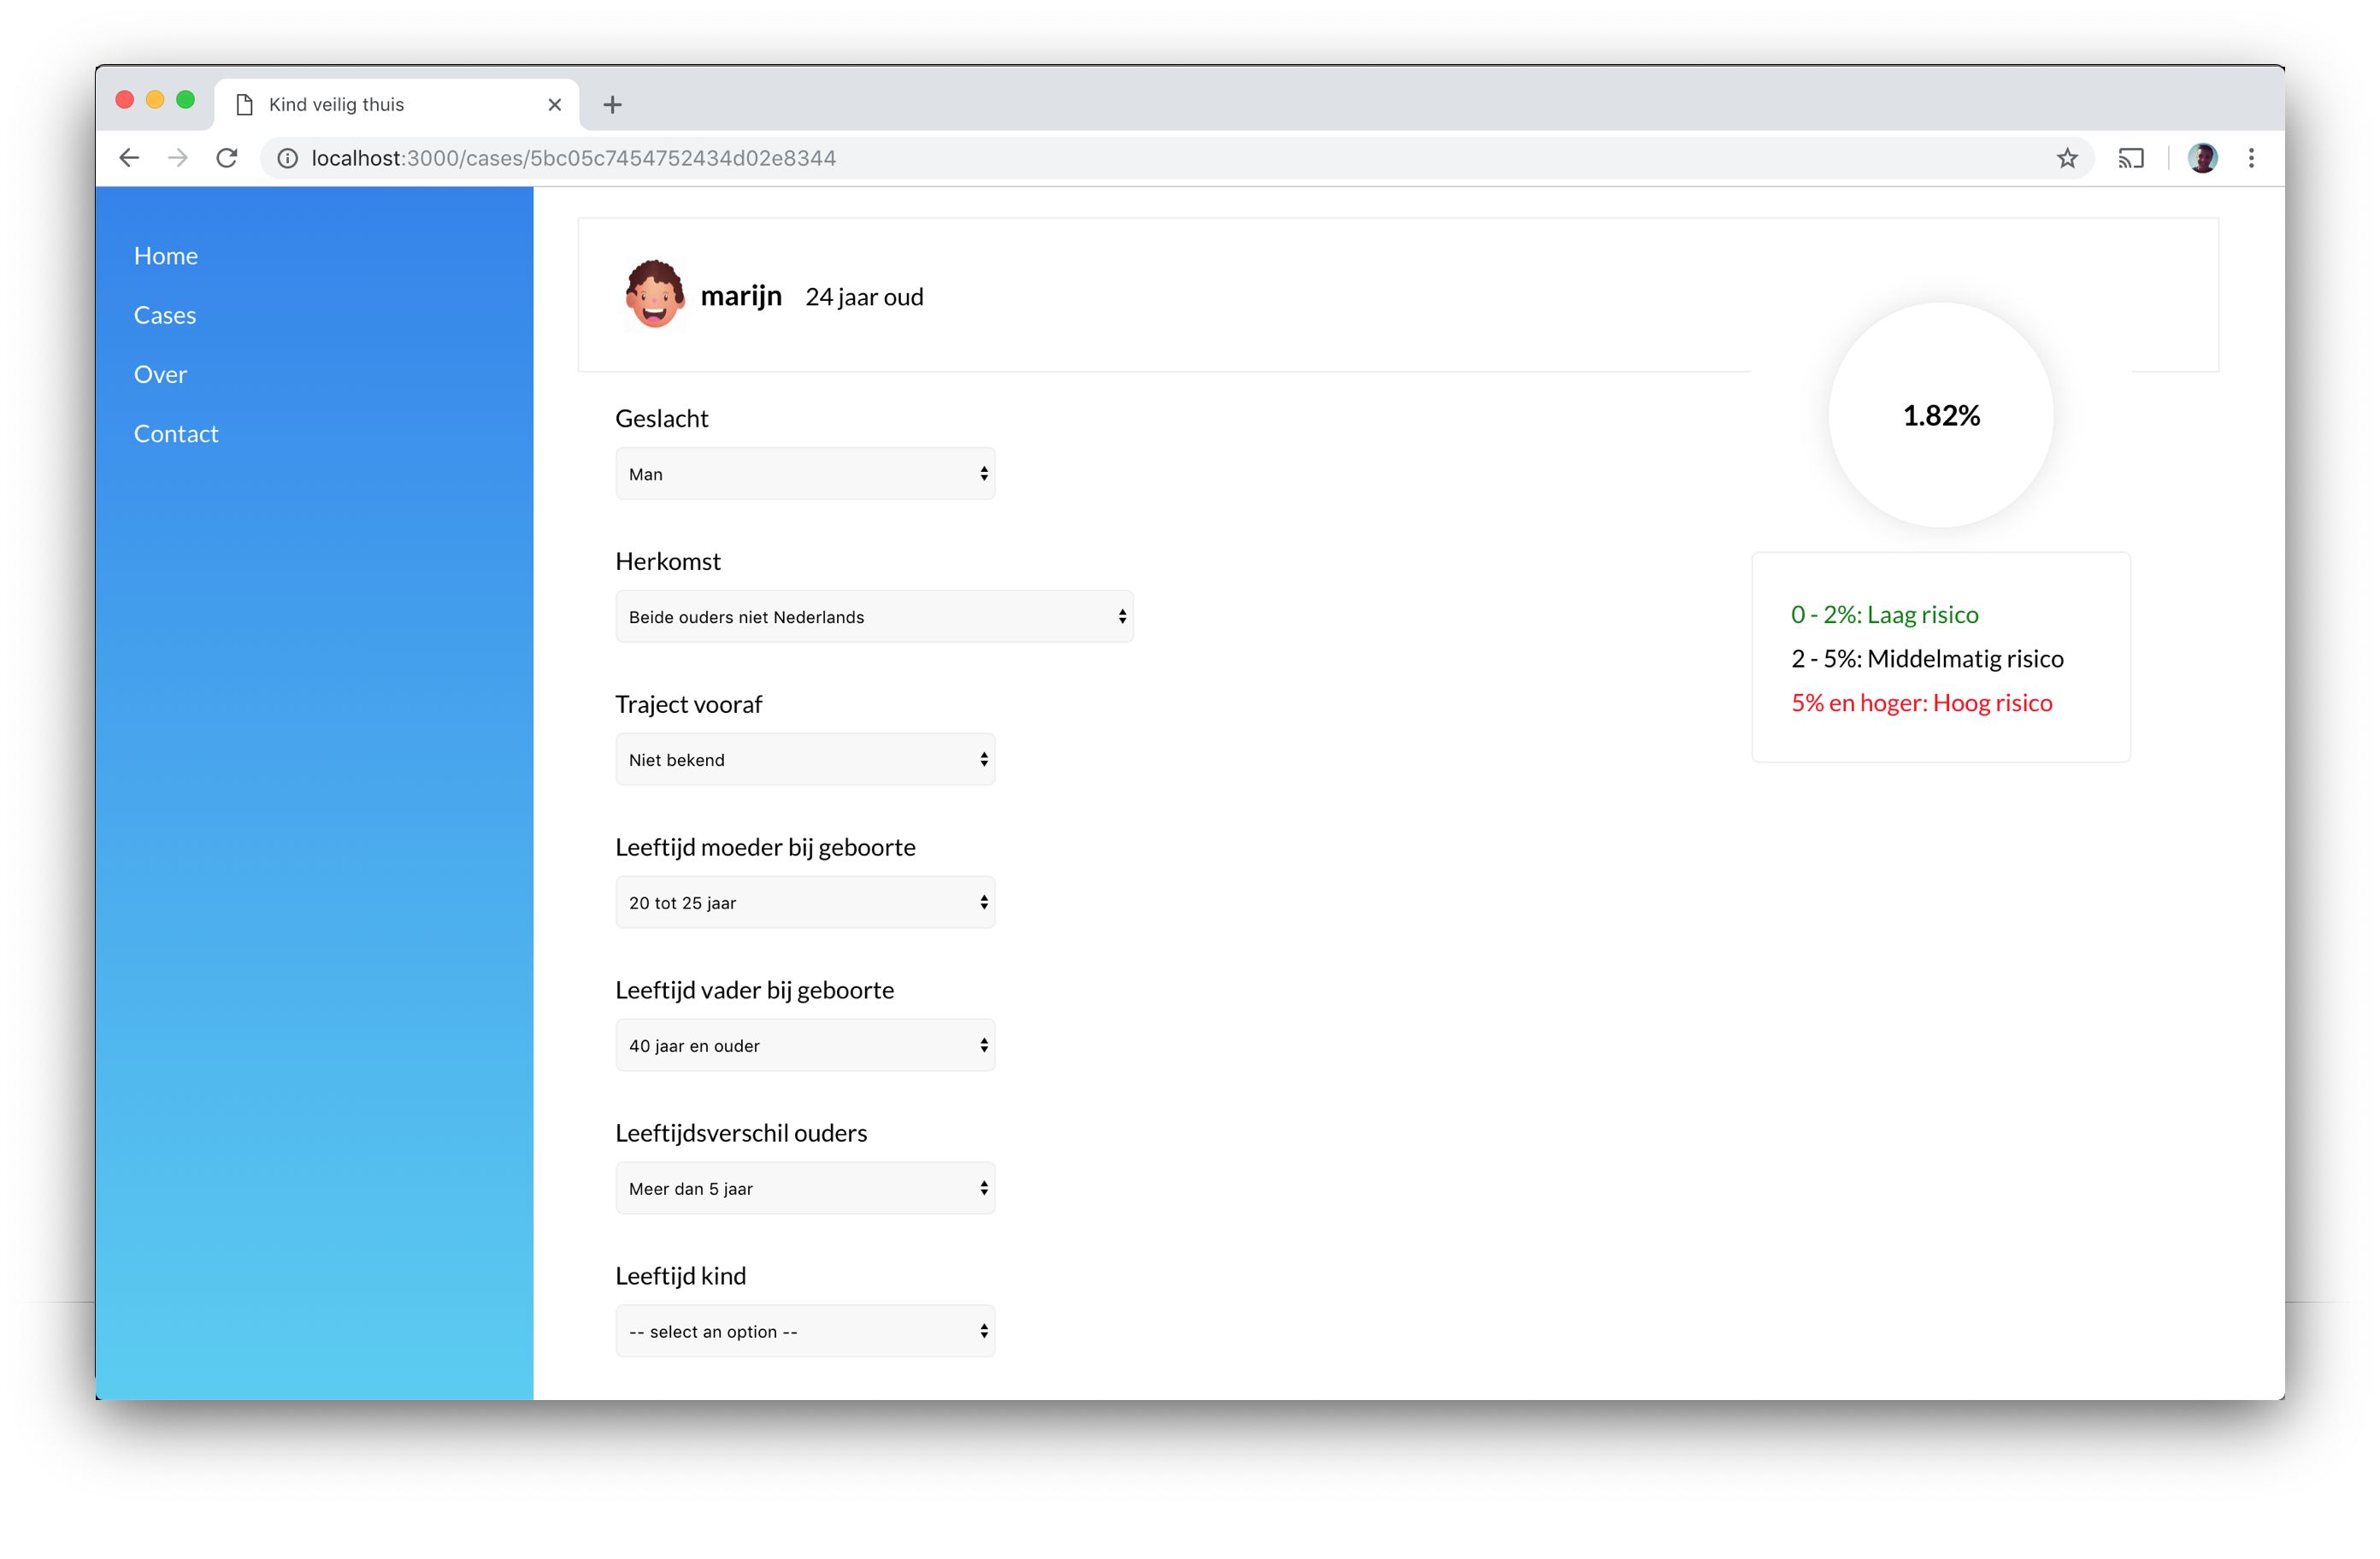 |
@maanlamp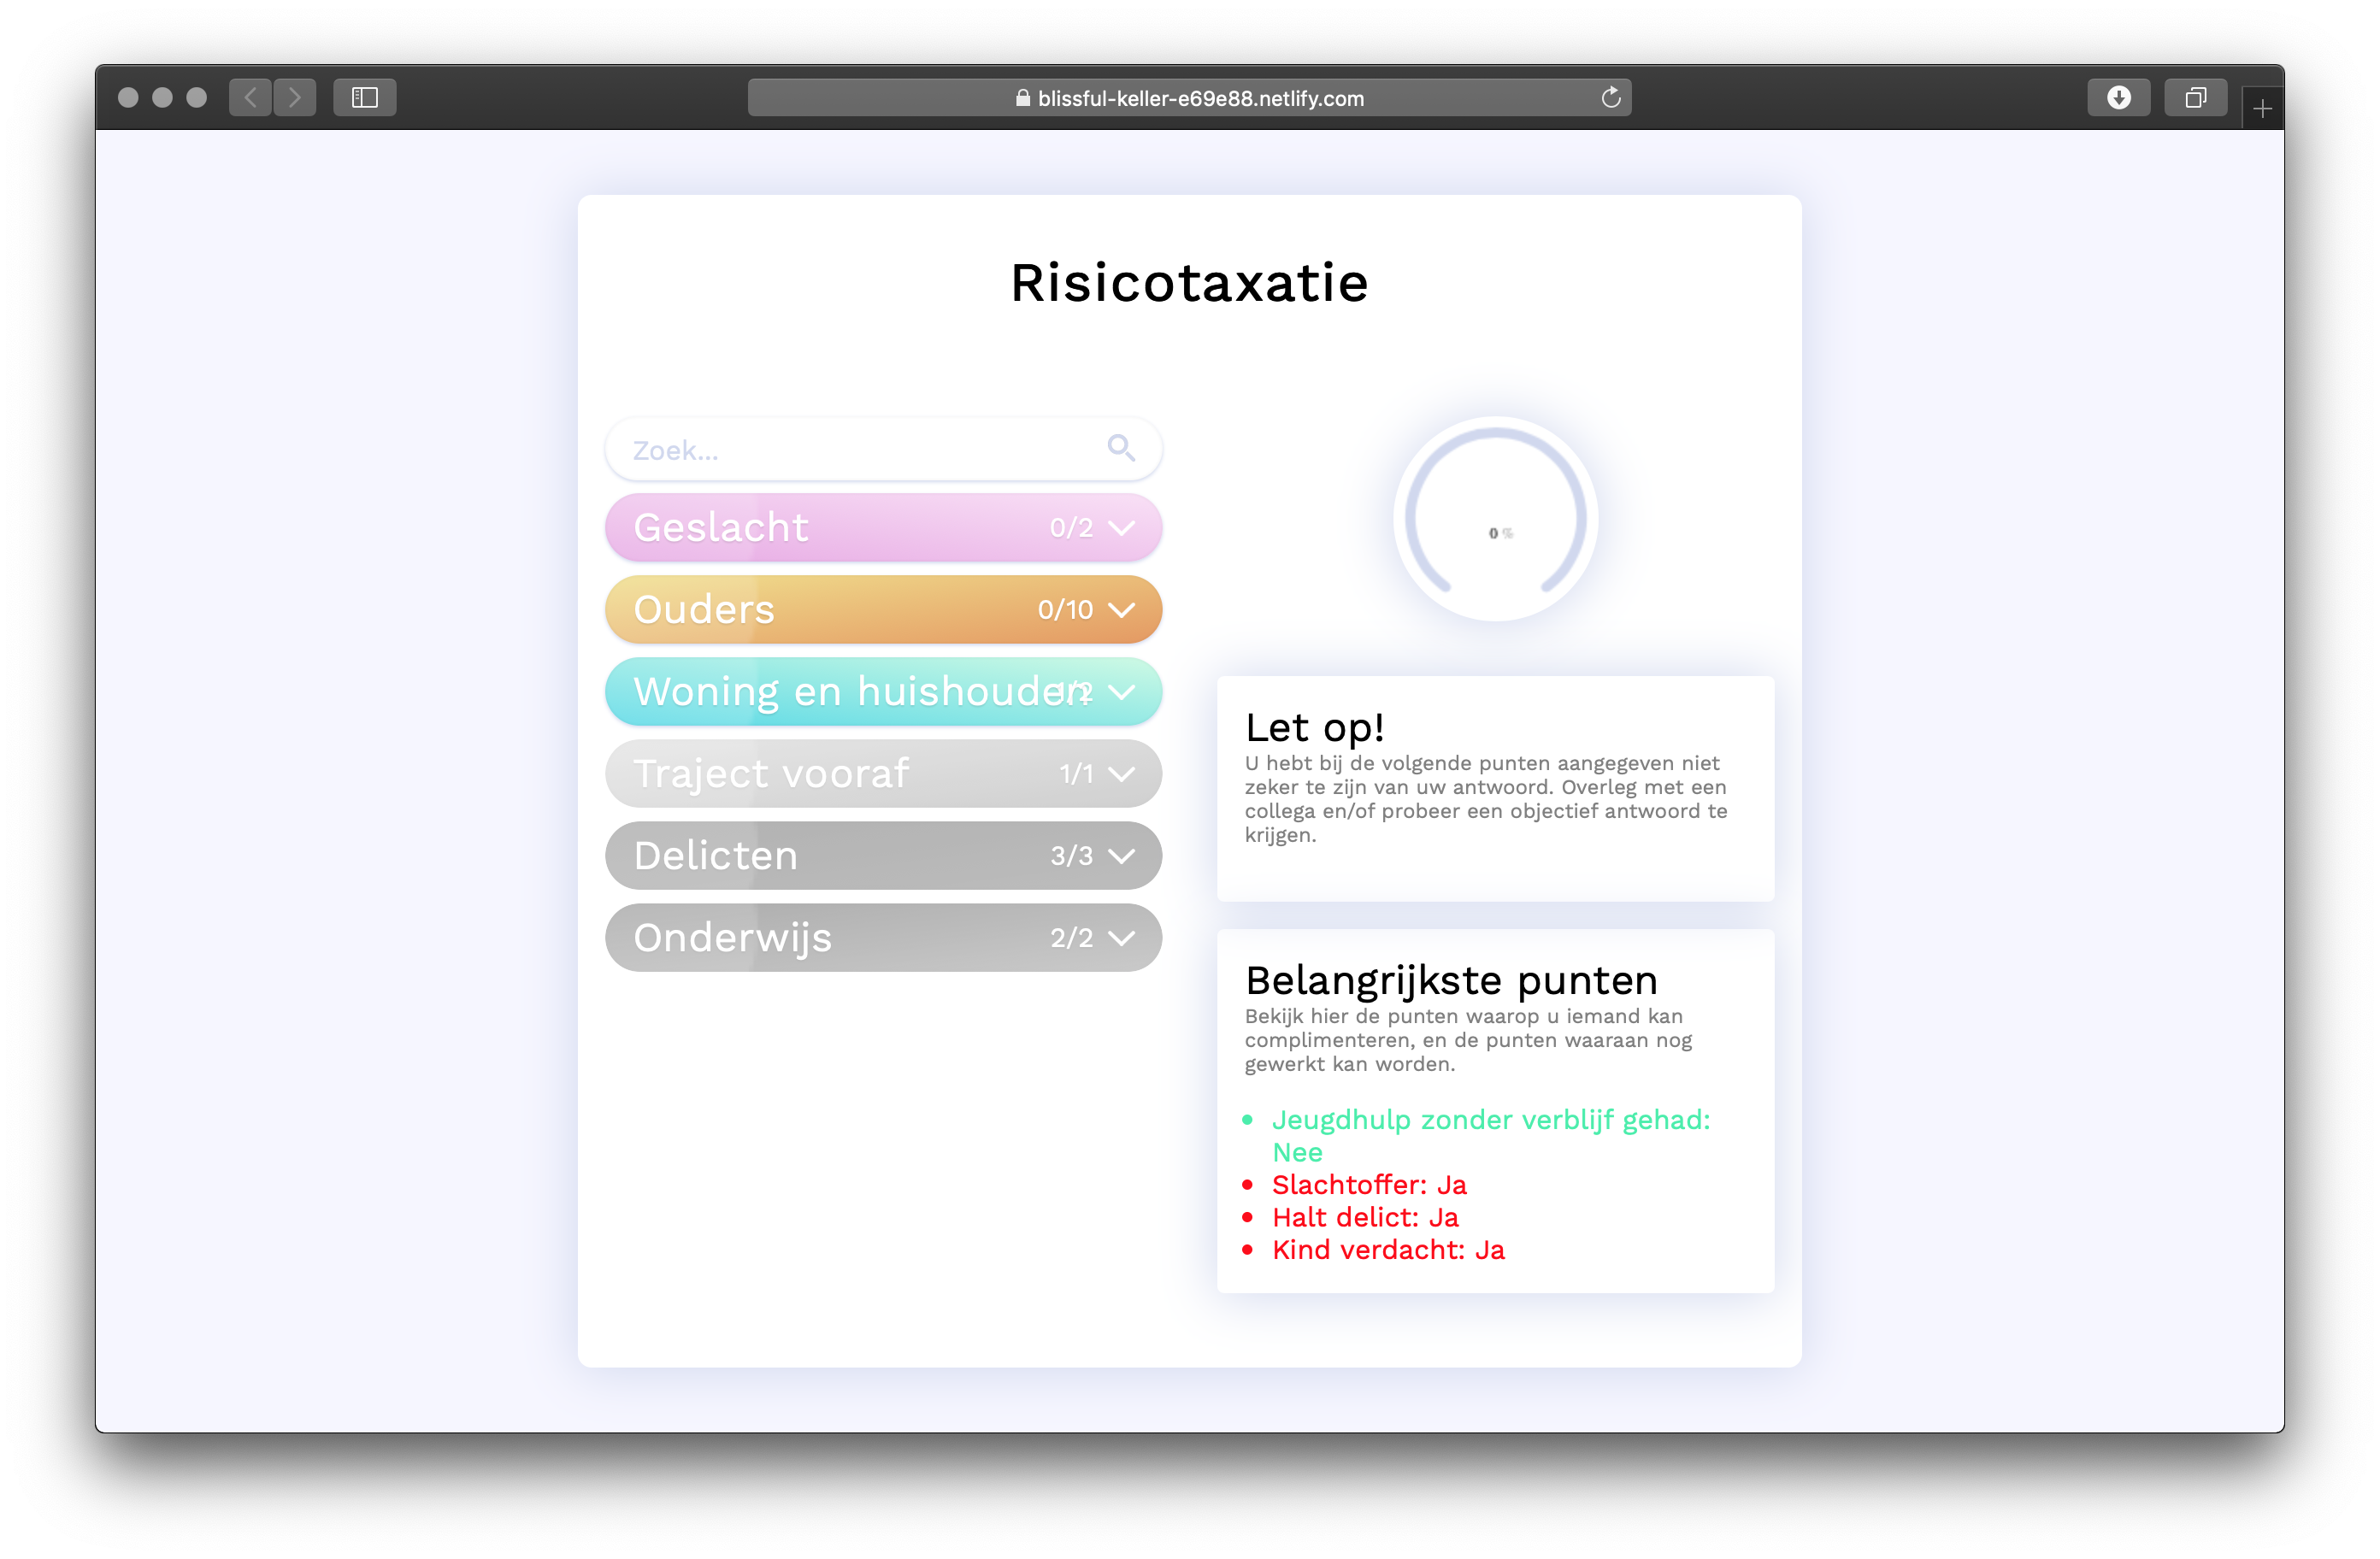 |
Communication
- GitHub — Main source of information, assignments, examples, important dates, and more
- Slack (tech-track channel) — General chatter and Q&A
- Moodle — Nothing
- Website — URL you can send other people
Goals
Main goals
The 2 main goals in this track are that you’re able to:
Subgoals
In practice you’ll learn to:
- read docs
- write docs
- debug code
- refactor code
- manipulate elements
- load external data
- transform data
- use svg
- use scales
- use data joins
- apply motion
Grade
| Course | Points |
|---|---|
| Frontend Applications | 3 ECTS |
| Functional Programming | 3 ECTS |
| Frontend Data | 3 ECTS |
| Total | 9 ECTS |
Materials
Resources used in this track
🆓 GitHub account (required) — Sign Up🆓 Text Editor (required) — Atom or Code🆓 Node (required)🆓 Eloquent JavaScript (optional)🆓 Professor Frisby’s Mostly Adequate Guide to Functional Programming (optional)🆓 Functional-Light JavaScript (optional)🆓 King, Ritchie S. Visual Storytelling with D3. Addison-Wesley, 2015 (optional)🆓 Meeks, Elijah. D3.js in Action. O’Reilly Media, 2017 (optional)🆓 Navarro Castillo, Pablo. Mastering D3.js. Packt Publishing, 2014 (optional)🆓 D3.js Essentials on Lynda (optional)
💁 The three books are free for HvA students through Safari Bookshelves. Lynda is free for HvA students through our portal.
Resources to refresh your memory
🆓 Codecademy (course) — Intro to JavaScript: Learn to code interactively🆓 Re-introduction to JavaScript (article) — Short re-introduction to JavaScript🆓 JavaScript Essentials (course) — Learn JavaScript on Lynda (free for AUAS students through our portal)🆓 JavaScript For Cats (book) — Intro to JavaScript for new programmers🆓 JavaScript 30 (course) — 30 day vanilla JavaScript coding challenge🆓 Command-line bootcamp (tutorial) — Learn how to work at the command-line🆓 node-handbook (article) — Learn Node the Node way🆓 NodeSchool (meetup) — Open source workshops that teach web software skills🆓 Programming 101: Learn English (video)💸 Learn Node (course) — Learn to build apps with Node, Express, and more (offers student discount)
Resources used in previous courses
- Duckett, Jon. HTML & CSS. John Wiley & Sons, 2015 (internetstandaarden)
- Howe, Shay. Learn to Code HTML & CSS. New Riders, 2014 (internetstandaarden)
- Duckett, Jon. JavaScript & jQuery. John Wiley & Sons, 2015 (inleiding programmeren)
- Simpson, Kyle. YDKJS: Up & Going. O’Reilly Media, 2015 (frontend 2)
- Simpson, Kyle. YDKJS: Scope & Closures. O’Reilly Media, 2015 (frontend 2)
- Simpson, Kyle. YDKJS: this & Object Prototypes. O’Reilly Media, 2015 (frontend 2)
- Simpson, Kyle. YDKJS: Types & Grammar. O’Reilly Media, 2015 (frontend 2)
- Simpson, Kyle. YDKJS: Async & Performance. O’Reilly Media, 2015 (frontend 2)
- Simpson, Kyle. YDKJS: ES6 & Beyond. O’Reilly Media, 2016 (frontend 2)
Bugs
If you have questions:
- Read the manual for the technology in question (Git, GitHub, Node, npm, react, vue, ember, d3)
- Search StackOverflow
- Use a search engine like DuckDuckGo
- Ask questions on Slack
- Contact a lecturer
Semester
This track is given in the Information Design semester (fall). Information Design is all about data visualisation and infographics. In six courses and two projects students learn how to visualise data and complex information.
After the initial three courses on data visualisation, students choose either a visual or technical track of another three courses. After both tracks, the two groups come back together and show and combine their skills in two projects.
In the tech track students learn how to build visualisations into reality. Albeit technical, the track tests your creativity.

Programme
This track is given at Communication and Multimedia Design, a design bachelor focused on interactive digital products and services. CMD is part of the Faculty of Digital Media and Creative Industries at the Amsterdam University of Applied Sciences.

Conduct
This track has a Code of Conduct. Anyone interacting with this repository, organisation, or community is bound by it.
Staff and students of the Amsterdam University of Applied Sciences (Hogeschool van Amsterdam) are additionally bound by the Regulation Undesirable Conduct (Regeling Ongewenst Gedrag).
License
Unless stated otherwise, code is MIT © Titus Wormer, docs and images are CC-BY-4.0.