Coz: Finding Code that Counts with Causal Profiling
Coz is a new kind of profiler that unlocks optimization opportunities missed by traditional profilers. Coz employs a novel technique we call causal profiling that measures optimization potential. This measurement matches developers' assumptions about profilers: that optimizing highly-ranked code will have the greatest impact on performance. Causal profiling measures optimization potential for serial, parallel, and asynchronous programs without instrumentation of special handling for library calls and concurrency primitives. Instead, a causal profiler uses performance experiments to predict the effect of optimizations. This allows the profiler to establish causality: "optimizing function X will have effect Y," exactly the measurement developers had assumed they were getting all along.
Full details of Coz are available in our paper, Coz: Finding Code that Counts with Causal Profiling (pdf), SOSP 2015, October 2015 (recipient of a Best Paper Award).
Installation
On Debian, Ubuntu, Fedora, you can install Coz via apt:
% sudo apt install coz-profiler
An OpenSUSE package was prepared by user @zethra and is available at https://build.opensuse.org/package/show/home:zethra/coz-profiler.
Coz should work on any modern Linux system (specifically, running
version 2.6.32 or later, with support for the perf_event_open system
call) with a Python 3.x interpreter.
Libraries/Wrappers
| Language | Link |
|---|---|
| Java | JCoz: https://github.com/Decave/JCoz |
| Go | Cozgo: https://github.com/urjitbhatia/cozgo |
Building Coz From Source
To build Coz from source, you will need:
- A copy of the source code for this project
- A compiler with C++0x support (clang++ or g++)
- A Python interpreter (Python 3.x is required)
- The libelfin development libraries (Use latest from https://github.com/aclements/libelfin. Version 0.3 does not work.)
- The
rst2mancommand (for building documentation) - NodeJS and npm (for building the profiler viewer)
Once you have all dependencies in place, build Coz with CMake. On Debian-based distributions, the following commands should take care of the entire process:
$ sudo apt-get install build-essential cmake docutils-common libelfin-dev nodejs npm python3
$ pip install conan --user
$ git clone https://github.com/plasma-umass/coz.git
$ cd coz
$ mkdir build && cd build
$ # This helps to avoid problems with linker failing to find C++ symbols:
$ conan profile update settings.compiler.libcxx=libstdc++11 default
$ conan install ..
$ cmake ..
$ make
Using Coz
Using coz requires a small amount of setup, but you can jump ahead to the section on the included sample applications in this repository if you want to try coz right away.
To run your program with coz, you will need to build it with debug information. You do not need to include debug symbols in the main executable: coz uses the same procedure as gdb to locate debug information for stripped binaries.
Once you have your program built with debug information, you can run it with coz using the command coz run {coz options} --- {program name and arguments}. But, to produce a useful profile you need to decide which part(s) of the application you want to speed up by specifying one or more progress points.
Profiling Modes
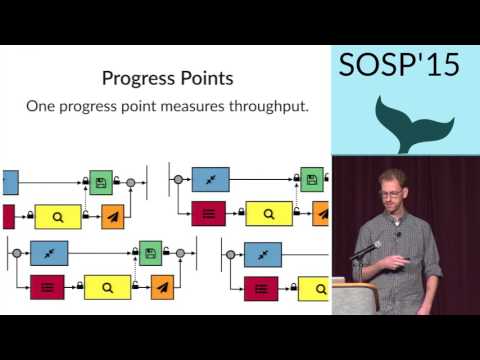
Coz departs from conventional profiling by making it possible to view the effect of optimizations on both throughput and latency. To profile throughput, you must specify a progress point. To profile latency, you must specify a pair of progress points.
Throughput Profiling: Specifying Progress Points
To profile throughput you must indicate a line in the code that corresponds to the end of a unit of work. For example, a progress point could be the point at which a transaction concludes, when a web page finishes rendering, or when a query completes. Coz then measures the rate of visits to each progress point to determine any potential optimization's effect on throughput.
To place a progress point, include coz.h (under the include directory in this repository) and add the COZ_PROGRESS macro to at least one line you would like to execute more frequently. Don't forget to link your program with libdl: use the -ldl option.
By default, Coz uses the source file and line number as the name for your progress points. If you use COZ_PROGRESS_NAMED("name for progress point") instead, you can provide an informative name for your progress points. This also allows you to mark multiple source locations that correspond to the same progress point.
Latency Profiling: Specifying Progress Points
To profile latency, you must place two progress points that correspond to the start and end of an event of interest, such as when a transaction begins and completes. Simply mark the beginning of a transaction with the COZ_BEGIN("transaction name") macro, and the end with the COZ_END("transaction name") macro. Unlike regular progress points, you always need to specify a name for your latency progress points. Don't forget to link your program with libdl: use the -ldl option.
When coz tests a hypothetical optimization it will report the effect of that optimization on the average latency between these two points. Coz can track this information without any knowledge of individual transactions thanks to Little's Law.
Specifying Progress Points on the Command Line
Coz has command line options to specify progress points when profiling the application instead of modifying its source. This feature is currently disabled because it did not work particularly well. Adding support for better command line-specified progress points is planned in the near future.
Processing Results
To plot profile results, go to http://plasma-umass.github.io/coz/ and load your profile. This page also includes several sample profiles from PARSEC benchmarks.
Sample Applications
The benchmarks directory in this repository includes several small benchmarks with progress points added at appropriate locations. To build and run one of these benchmarks with coz, just browse to benchmarks/{bench name} and type make bench (or make test for a smaller input size). These programs may require several runs before coz has enough measurements to generate a useful profile. Once you have profiled these programs for several minutes, go to http://plasma-umass.github.io/coz/ to load and plot your profile.
CMake
When you install coz it installs a cmake config file. To add coz to a cmake project simply use the command find_package(coz-profiler). This will import a target for the library and includes called coz::coz and a target for the coz binary coz::profiler. For guidance on how to use these targets refer to the CMake documentation.
Limitations
Coz currently does not support interpreted or JIT-compiled languages such as Python, Ruby, or JavaScript. Interpreted languages will likely not be supported at any point, but support for JIT-compiled languages that produce debug information could be added in the future.
License
All source code is licensed under the BSD 2-clause license unless otherwise indicated. See LICENSE.md for details.
Sample applications (in the benchmarks directory) include several Phoenix programs and pbzip2, which are licensed separately and included with this release for convenience.