All Projects → wgliang → Goappmonitor

wgliang / Goappmonitor

Licence: apache-2.0
Golang application performance data monitoring.

Programming Languages

go
31211 projects - #10 most used programming language

Projects that are alternatives of or similar to Goappmonitor

Stackimpact Go
DEPRECATED StackImpact Go Profiler - Production-Grade Performance Profiler: CPU, memory allocations, blocking calls, errors, metrics, and more
Stars: ✭ 276 (-42.26%)
Mutual labels:  monitoring, tracing, agent, profiler, performance-analysis, performance-metrics, performance-tuning
Stackimpact Nodejs
DEPRECATED StackImpact Node.js Profiler - Production-Grade Performance Profiler: CPU, memory allocations, async calls, errors, metrics, and more
Stars: ✭ 46 (-90.38%)
Mutual labels:  monitoring, tracing, agent, profiler, performance-analysis, performance-metrics, performance-tuning
Stackimpact Java
StackImpact Java Profiler - Production-Grade Performance Profiler: CPU, locks, runtime metrics, and more
Stars: ✭ 7 (-98.54%)
Mutual labels:  monitoring, agent, profiler, performance-analysis, performance-metrics, performance-tuning
Myperf4j
High performance Java APM. Powered by ASM. Try it. Test it. If you feel its better, use it.
Stars: ✭ 2,281 (+377.2%)
Mutual labels:  monitoring, agent, profiler, performance-analysis, performance-metrics, performance-tuning
Inspectit
inspectIT is the leading Open Source APM (Application Performance Management) tool for analyzing your Java (EE) applications.
Stars: ✭ 513 (+7.32%)
Mutual labels:  monitoring, agent, performance-analysis, performance-metrics, performance-tuning
Stackimpact Python
DEPRECATED StackImpact Python Profiler - Production-Grade Performance Profiler: CPU, memory allocations, blocking calls, exceptions, metrics, and more
Stars: ✭ 671 (+40.38%)
Mutual labels:  monitoring, profiler, performance-metrics, performance-tuning
Spm Agent Nodejs
NodeJS Monitoring Agent
Stars: ✭ 51 (-89.33%)
Mutual labels:  monitoring, tracing, agent, performance-metrics
Profimp
Python import profiler
Stars: ✭ 52 (-89.12%)
Mutual labels:  profiler, performance-analysis, performance-tuning
Spm Agent Mongodb
Sematext Agent for monitoring MongoDB
Stars: ✭ 7 (-98.54%)
Mutual labels:  monitoring, agent, performance-metrics
Pcm
Processor Counter Monitor
Stars: ✭ 1,240 (+159.41%)
Mutual labels:  monitoring, performance-analysis, performance-metrics
Pinpoint
APM, (Application Performance Management) tool for large-scale distributed systems.
Stars: ✭ 11,883 (+2385.98%)
Mutual labels:  monitoring, tracing, agent
Scouter
Scouter is an open source APM (Application Performance Management) tool.
Stars: ✭ 1,792 (+274.9%)
Mutual labels:  monitoring, agent, performance-metrics
Sparklens
Qubole Sparklens tool for performance tuning Apache Spark
Stars: ✭ 345 (-27.82%)
Mutual labels:  performance-analysis, performance-metrics, performance-tuning
Apm Agent Php
Elastic APM PHP Agent
Stars: ✭ 129 (-73.01%)
Mutual labels:  monitoring, tracing, performance-analysis
Sitespeed.io
Sitespeed.io is an open source tool that helps you monitor, analyze and optimize your website speed and performance, based on performance best practices advices from the coach and collecting browser metrics using the Navigation Timing API, User Timings and Visual Metrics (FirstVisualChange, SpeedIndex & LastVisualChange).
Stars: ✭ 4,255 (+790.17%)
Mutual labels:  monitoring, performance-analysis, performance-metrics
ruby-sensor
💎 Ruby Distributed Tracing & Metrics Sensor for Instana
Stars: ✭ 23 (-95.19%)
Mutual labels:  tracing, performance-metrics
compile-time-perf
Measures high-level timing and memory usage metrics during compilation
Stars: ✭ 64 (-86.61%)
Mutual labels:  performance-metrics, performance-analysis
perfmonger
No description or website provided.
Stars: ✭ 39 (-91.84%)
Mutual labels:  performance-metrics, performance-analysis
javametrics
Application Metrics for Java™ instruments the Java runtime for performance monitoring, providing the monitoring data visually with its built in dashboard
Stars: ✭ 19 (-96.03%)
Mutual labels:  agent, performance-metrics
performance-budget-plugin
Perfromance budget plugin for Webpack (https://webpack.js.org/)
Stars: ✭ 65 (-86.4%)
Mutual labels:  performance-metrics, performance-analysis

goappmonitor

goappmonitor

Build Status codecov GoDoc Join the chat at https://gitter.im/goappmonitor/Lobby Code Health Go Report Card License

Golang application performance data monitoring.

GoAppMonitor is a library which provides a monitor on your golang applications. It contains system level based monitoring and business level monitoring(custom monitoring).Just add the repository into your apps and register what you want to monitoring.

Summary

Using GoAppMonitor to monitor the golang applications, in general as following:

In your golang application code, the user calls the statistics function provided by goappmonitor; when the statistics function is called, the appmonitor generates a statistical record, and is stored in memory.GoAppMonitor will automatically and regularly record these statistics push to the agent such as Open-Falcon agent.

Version

Current version support:

  • v0.0.2

    • Open-Falcon (Open source monitoring system of Xiaomi)
    • InfluxDB (Scalable datastore for metrics, events, and real-time analytics)

todo....

  • support more agent frameworks,such as elasticsearch...
  • go processes manager and debug online...

Install

go get github.com/wgliang/goappmonitor

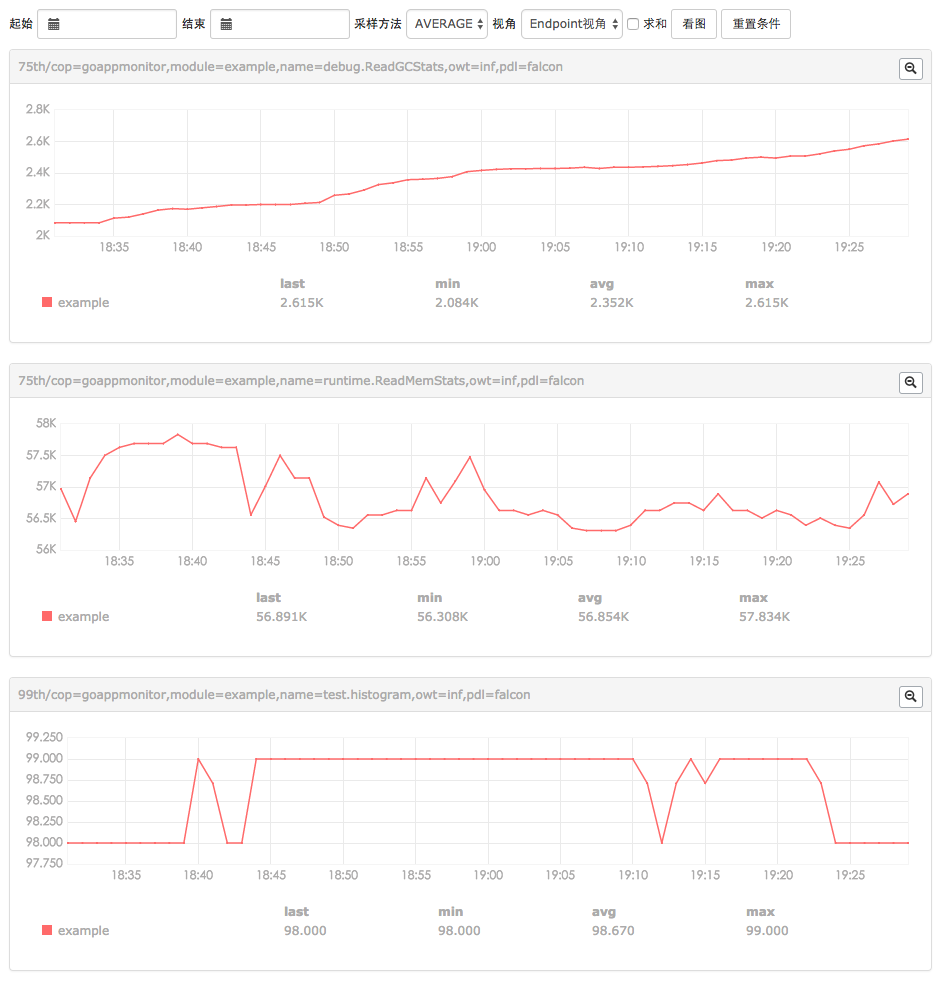
Demo

demo

Usage

Below is an example which shows some common use cases for goappmonitor. Check example for more usage.

Detail API

package main

import (
	"math/rand"
	"time"

	appm "github.com/wgliang/goappmonitor"
)

// Base or system performance data,such as memeory,gc,network and so on.
func baseOrsystem() {
	for _ = range time.Tick(time.Second * time.Duration(10)) {
		// (commonly used) Meter, used to sum and calculate the rate of change. Use scenarios
		// such as the number of home visits statistics, CG etc..
		pv := int64(rand.Int31n(100))
		appm.Meter("appm.meter", pv)
		appm.Meter("appm.meter.2", pv-50)

		// (commonly used) Gauge, used to preserve the value of the instantaneous value of the
		// type of record. Use scenarios such as statistical queue length, statistics CPU usage,
		// and so on.
		queueSize := int64(rand.Int31n(100) - 50)
		appm.Gauge("appm.gauge", queueSize)

		cpuUtil := float64(rand.Int31n(10000)) / float64(100)
		appm.GaugeFloat64("appm.gauge.float64", cpuUtil)
	}
}

// Custom or business performance data,such as qps,num of function be called, task queue and so on.
func customOrbusiness() {
	for _ = range time.Tick(time.Second) {
		// Histogram, using the exponential decay sampling method, the probability distribution of
		// the statistical object is calculated. Using scenarios such as the probability distribution
		// of the statistics home page to access the delay
		delay := int64(rand.Int31n(100))
		appm.Histogram("appm.histogram", delay)
	}
}

func main() {
	var ch chan int
	go baseOrsystem()
	go customOrbusiness()
	<-ch
}

Credits

Repository is base on goperfcounter of niean

Logo is desigend by xuri

Note that the project description data, including the texts, logos, images, and/or trademarks, for each open source project belongs to its rightful owner. If you wish to add or remove any projects, please contact us at [email protected].