All Projects → swapnil1104 → Curvegraphview

swapnil1104 / Curvegraphview

Licence: apache-2.0
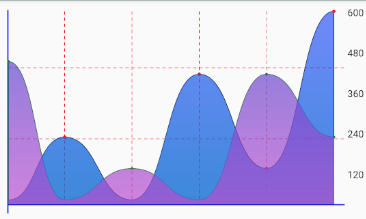
A highly customizable and performant custom view to render curved line graph.

Programming Languages

java
68154 projects - #9 most used programming language

Projects that are alternatives of or similar to Curvegraphview

Image-Support
Add badge with counter to ImageView Android.
Stars: ✭ 128 (-60.12%)
Mutual labels:  custom-view, android-development
Reel Search Android
Reel Search for Android is a UI/UX design for autocomplete action. It is a beautiful minimalistic addition to any use case.
Stars: ✭ 110 (-65.73%)
Mutual labels:  android-development, custom-view
Tableview
TableView is a powerful Android library for displaying complex data structures and rendering tabular data composed of rows, columns and cells.
Stars: ✭ 2,928 (+812.15%)
Mutual labels:  android-development, custom-view
Android Ratingreviews
Simple star rating system bars, a view similar to the ones seen on Google Playstore. ⭐🌟✨
Stars: ✭ 110 (-65.73%)
Mutual labels:  graph, android-development
RxLoading
RxJava library for showing a loading (i.e. progress bar) state while waiting for async data with minimal effort and advanced options.
Stars: ✭ 49 (-84.74%)
Mutual labels:  custom-view, android-development
android-tableview-kotlin
Android's missing TableView component.
Stars: ✭ 40 (-87.54%)
Mutual labels:  custom-view, android-development
Sparklinelayout
Simple and lightweight library for drawing sparklines / graphs. Support markers and gradients.
Stars: ✭ 291 (-9.35%)
Mutual labels:  graph, custom-view
The Pit Of The Android Studio
👍 👍 👏 🌟 ⭐️ ⭐️ Everything about the Android Studio and Intellij IDEAfor example:Install,common problems and solutions,each libraries for android and androidx library,code and peoject templates,etc.全面总结Android Studio以及Intellij IDEA的填坑指南,详解AS版本号、Gradle版本、BuildTools三者的对照关系,AS模板配置,gradle插件,Android自带注解库详解,support详解等干货。
Stars: ✭ 296 (-7.79%)
Mutual labels:  android-development
Libfirm
graph based intermediate representation and backend for optimising compilers
Stars: ✭ 305 (-4.98%)
Mutual labels:  graph
Rotatable
Helper class to make any view rotatable
Stars: ✭ 295 (-8.1%)
Mutual labels:  custom-view
Struc2vec
This repository provides a reference implementation of struc2vec.
Stars: ✭ 291 (-9.35%)
Mutual labels:  graph
Android Cleanarchitecture Kotlin
This is a movies sample app in Kotlin, which is part of a serie of blog posts I have written about architecting android application using different approaches.
Stars: ✭ 3,646 (+1035.83%)
Mutual labels:  android-development
Constellation
A graph-focused data visualisation and interactive analysis application.
Stars: ✭ 309 (-3.74%)
Mutual labels:  graph
Ngraph.graph
Graph data structure in JavaScript
Stars: ✭ 295 (-8.1%)
Mutual labels:  graph
Flutter Candlesticks
Elegant OHLC Candlestick and Trade Volume charts for @Flutter
Stars: ✭ 318 (-0.93%)
Mutual labels:  graph
Effectiveshapeview
android custom imageview, effective shape view
Stars: ✭ 291 (-9.35%)
Mutual labels:  custom-view
Swiftplot
Swift library for Data Visualization 📊
Stars: ✭ 319 (-0.62%)
Mutual labels:  graph
Country Picker Android
A simple library that displays a beautiful list of all the countries allowing the user to pick the country he wishes and provide details like country code, iso code name,currency and flag.
Stars: ✭ 317 (-1.25%)
Mutual labels:  android-development
Morpheus
Morpheus brings the leading graph query language, Cypher, onto the leading distributed processing platform, Spark.
Stars: ✭ 303 (-5.61%)
Mutual labels:  graph
Graph U Nets
Pytorch implementation of Graph U-Nets (ICML19)
Stars: ✭ 300 (-6.54%)
Mutual labels:  graph

CurveGraphView

Android Arsenal

A highly customizable and performant custom view to render curved line graph.

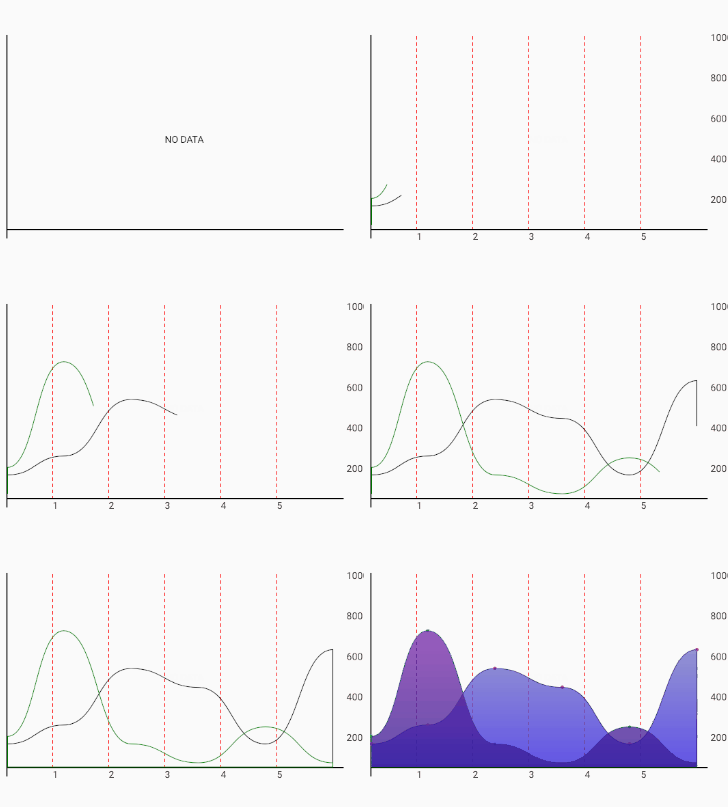
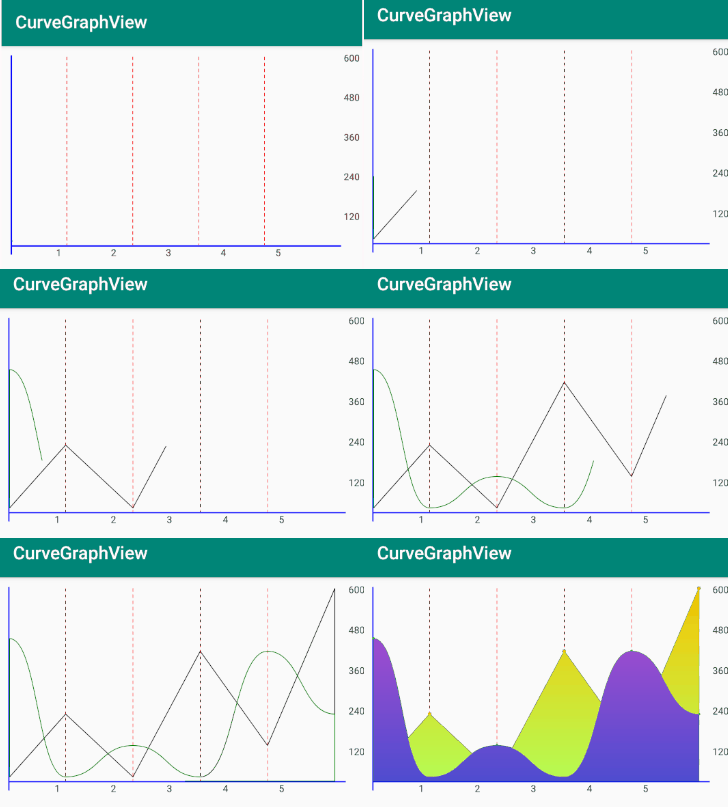
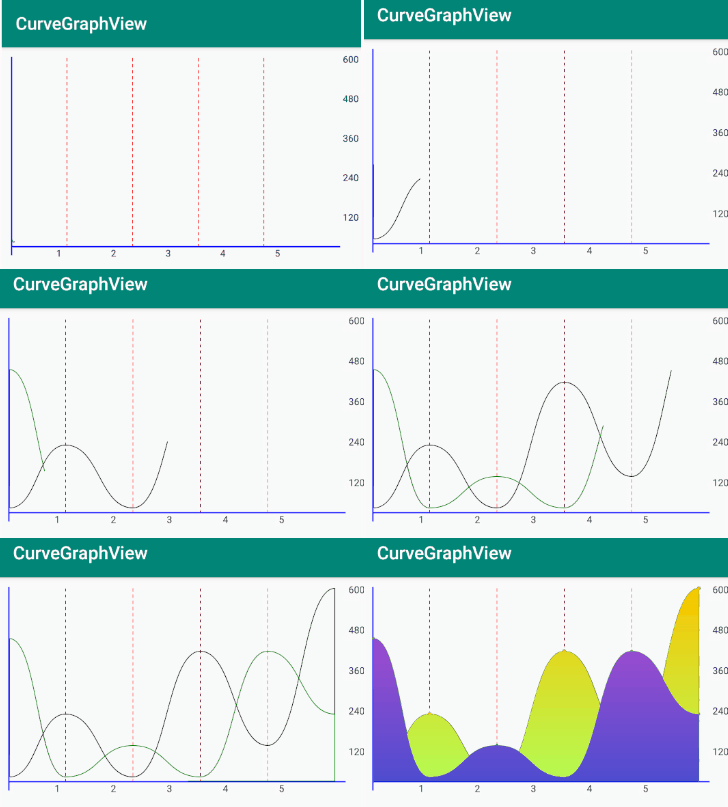
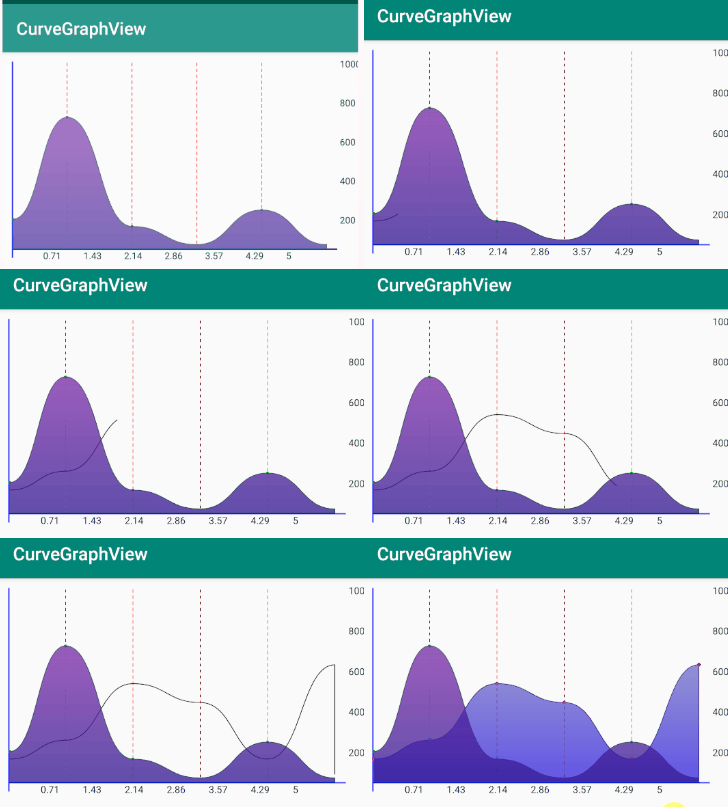
Animation demo Animation with straight & curved Animation with opaque color Animated and non animated graph Horizontal guidelines

Packed with features

  • Add multiple line graphs within one graph plane.
  • Extensible styling options.
  • Performant and light weight.

How to integrate the library in your app?

Step 1: Add it in your root build.gradle at the end of repositories:

allprojects {
    repositories {
        maven { url "https://jitpack.io" }
    }
}

Step 2. Add the dependency

dependencies {
    implementation 'com.github.swapnil1104:CurveGraphView:{current_lib_ver}'
}

Step 3. Add CurveGraphView to your layout file

 <com.broooapps.graphview.CurveGraphView
        android:id="@+id/cgv"
        android:layout_width="0dp"
        android:layout_height="250dp"
        app:layout_constraintBottom_toBottomOf="parent"
        app:layout_constraintEnd_toEndOf="parent"
        app:layout_constraintStart_toStartOf="parent"
        app:layout_constraintTop_toTopOf="parent" />

How to customize the view.

curveGraphView = findViewById(R.id.cgv);

curveGraphView.configure(
    new CurveGraphConfig.Builder(this)
            .setAxisColor(R.color.Blue)                                             // Set number of values to be displayed in X ax
            .setVerticalGuideline(4)                                                // Set number of background guidelines to be shown.
            .setHorizontalGuideline(2)
            .setGuidelineColor(R.color.Red)                                         // Set color of the visible guidelines.
            .setNoDataMsg(" No Data ")                                              // Message when no data is provided to the view.
            .setxAxisScaleTextColor(R.color.Black)                                  // Set X axis scale text color.
            .setyAxisScaleTextColor(R.color.Black)                                  // Set Y axis scale text color
            .setAnimationDuration(2000)                                             // Set Animation Duration
            .build()
);

How to provide data to the view.

Create PointMap object

The graph view points the plot with keeping 2 values in mind, span and value span relates to the x-coordinate, and value relates to the y-coordinate. Create the object by providing values as shown below.

PointMap pointMap = new PointMap();
        pointMap.addPoint(0, 100);
        pointMap.addPoint(1, 500);
        pointMap.addPoint(5, 800);
        pointMap.addPoint(4, 600);

Create GraphData object for each PointMap

A GraphData object expects a PointMap, strokeColor of the graph, and an optional gradientColor. Create a GraphData object as shown below.

GraphData gd = GraphData.builder(this)
       .setPointMap(pointMap)                                                   // PointMap datqa
       .setGraphStroke(R.color.Black)                                           // Graph line stroke color
       .setGraphGradient(R.color.BlueViolet, R.color.RoyalBlue)                 // Graph fill gradient color
       .setStraightLine(true)                                                   // true for straight line; false for curved line graph
       .setPointRadius(10)                                                      // set point radius
       .setPointColor(R.color.Red)                                              // set point color
       .animateLine(true)                                                       // Trigger animation for the particular graph line!
       .build();

Provide the array of GraphData to CurveGraphView

Provide the above constructed data to CurveGraphView via the curveGraphView.setData(int span, int maxVal, GraphData... gds) method. dscription of the params:

  • span: is the range from 0...<span_value> i.e. this is the range of x-axis.
  • maxVal: is the maximum plottable value for Y axis.
  • gds... : is the array of GraphData objects.

Sample Code

curveGraphView = findViewById(R.id.cgv);

curveGraphView.configure(
        new CurveGraphConfig.Builder(this)
                .setAxisColor(R.color.Blue)                                             // Set X and Y axis line color stroke.
                .setIntervalDisplayCount(7)                                             // Set number of values to be displayed in X ax
                .setGuidelineCount(2)                                                   // Set number of background guidelines to be shown.
                .setGuidelineColor(R.color.GreenYellow)                                 // Set color of the visible guidelines.
                .setNoDataMsg(" No Data ")                                              // Message when no data is provided to the view.
                .setxAxisScaleTextColor(R.color.Black)                                  // Set X axis scale text color.
                .setyAxisScaleTextColor(R.color.Black)                                  // Set Y axis scale text color
                .setAnimationDuration(2000)                                             // Set animation duration to be used after set data.
                .build()
);


PointMap pointMap = new PointMap();
pointMap.addPoint(0, 100);
pointMap.addPoint(1, 500);
pointMap.addPoint(4, 600);
pointMap.addPoint(5, 800);

GraphData gd = GraphData.builder(this)
        .setPointMap(pointMap)
        .setGraphStroke(R.color.Black)
        .setGraphGradient(R.color.BlueViolet, R.color.RoyalBlue)
        .build();

PointMap p2 = new PointMap();
p2.addPoint(0, 140);
p2.addPoint(1, 700);
p2.addPoint(2, 100);
p2.addPoint(3, 0);
p2.addPoint(4, 190);

GraphData gd2 = GraphData.builder(this)
        .setPointMap(p2)
        .setGraphStroke(R.color.Green)
        .setGraphGradient(R.color.gradientStartColor, R.color.gradientEndColor)
        .build();


//TODO(Swapnil) Optimize the setting logic code.
/** This needs to be done, onMeasure of Layout isn't called if setData is called in onCreate 
  * If anyone can take this up as their first issue, it'd be great!
  */
new Handler().postDelayed(new Runnable() {
    @Override
    public void run() {
        curveGraphView.setData(5, 1000, gd, gd2);
    }
}, 250);
Note that the project description data, including the texts, logos, images, and/or trademarks, for each open source project belongs to its rightful owner. If you wish to add or remove any projects, please contact us at [email protected].