muatik / Flask Profiler
Programming Languages
Projects that are alternatives of or similar to Flask Profiler
Flask-profiler
Flask-profiler measures endpoints defined in your flask application; and provides you fine-grained report through a web interface.
It gives answers to these questions:
- Where are the bottlenecks in my application?
- Which endpoints are the slowest in my application?
- Which are the most frequently called endpoints?
- What causes my slow endpoints? In which context, with what args and kwargs are they slow?
- How much time did a specific request take?
In short, if you are curious about what your endpoints are doing and what requests they are receiving, give a try to flask-profiler.
With flask-profiler's web interface, you can monitor all your endpoints' performance and investigate endpoints and received requests by drilling down through filters.
Screenshots
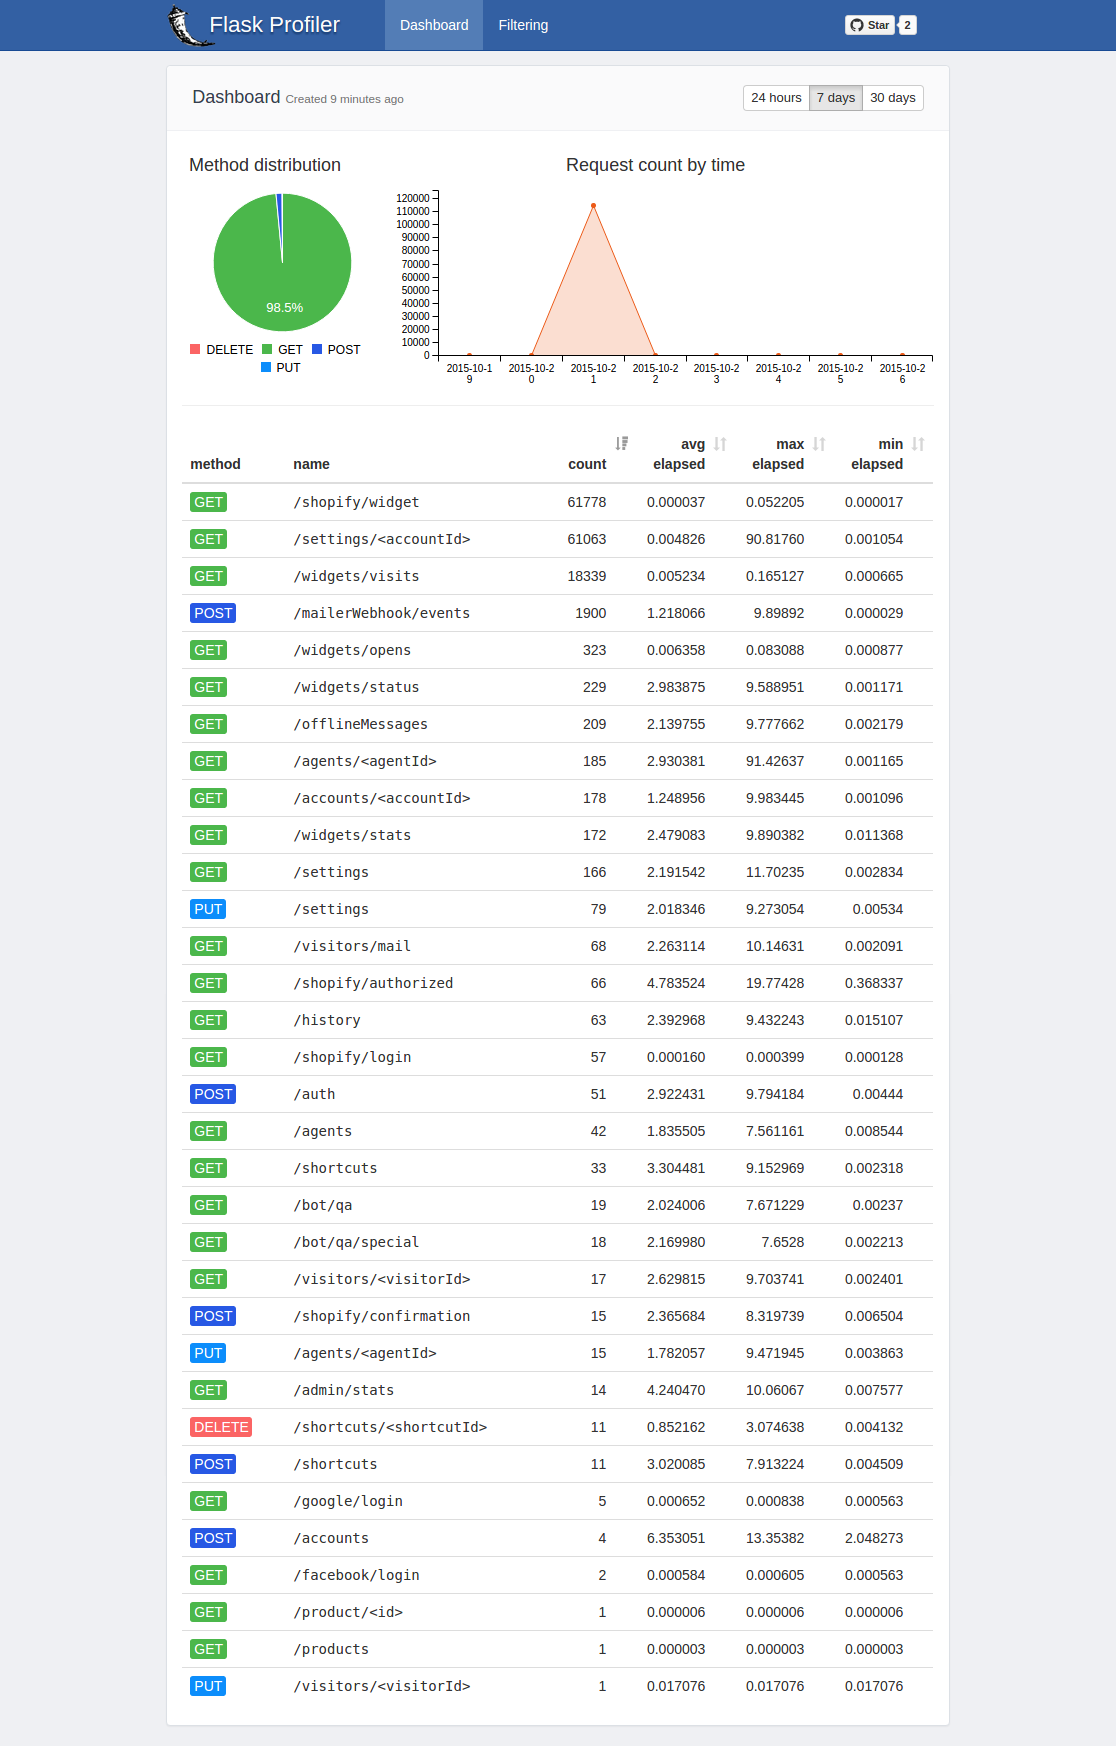
Dashboard view displays a summary.
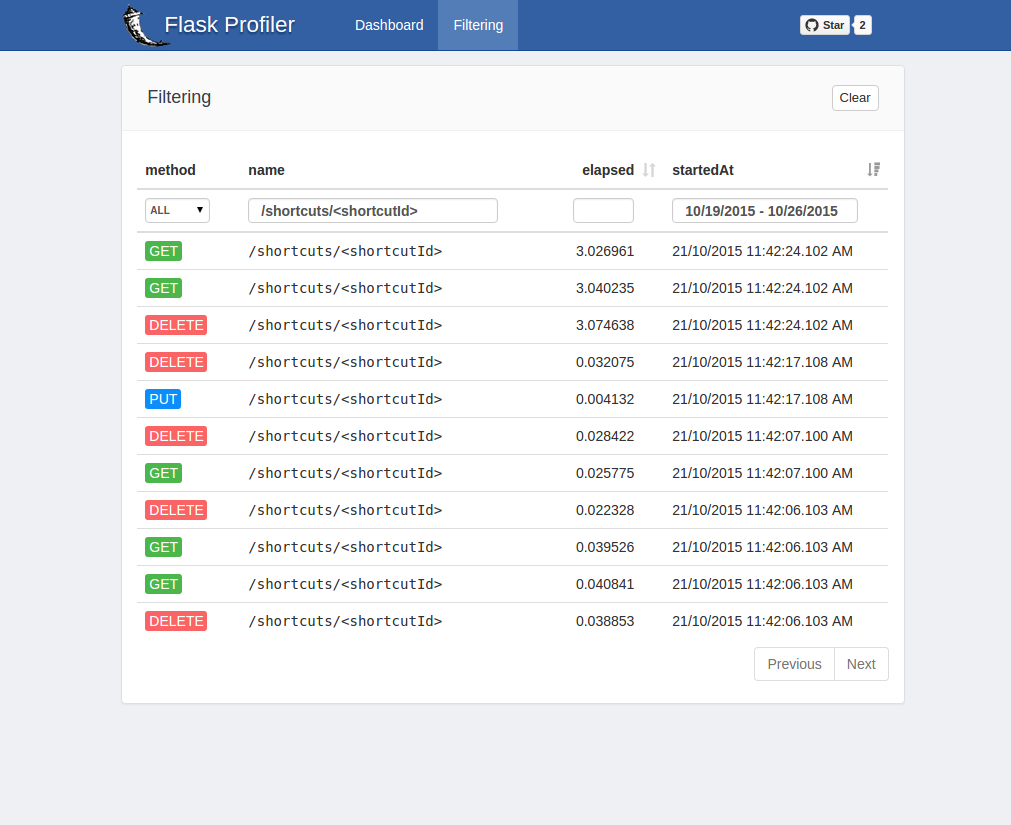
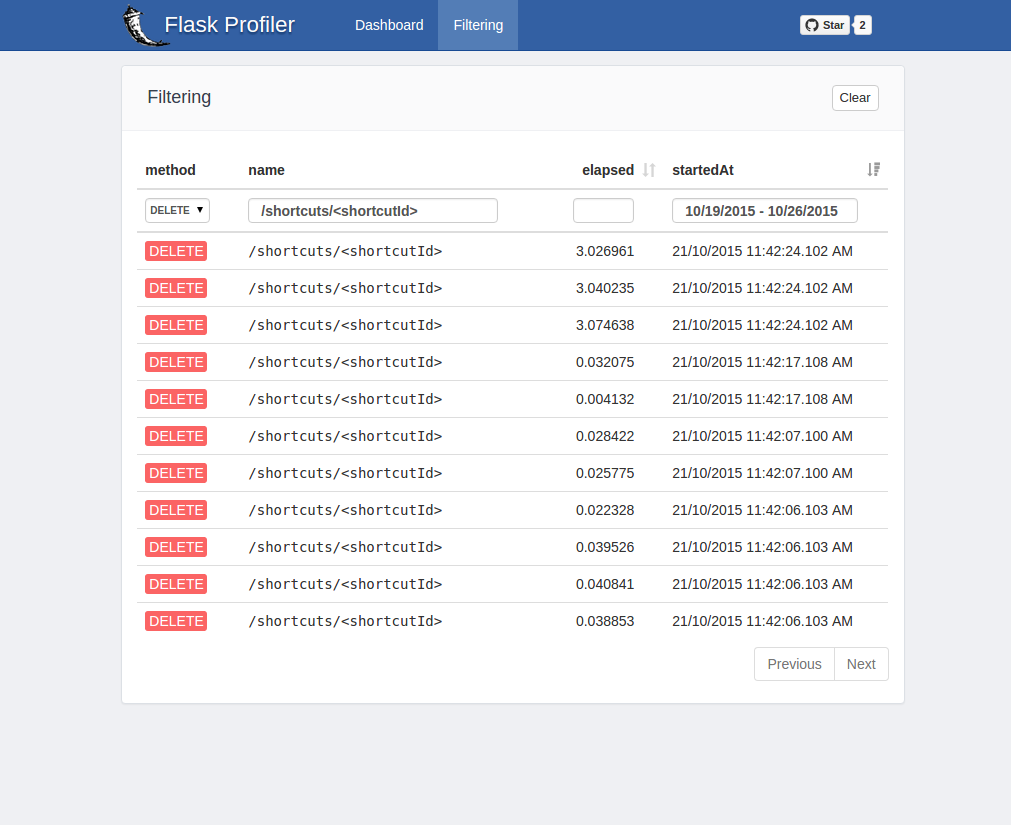
You can create filters to investigate certain type requests.
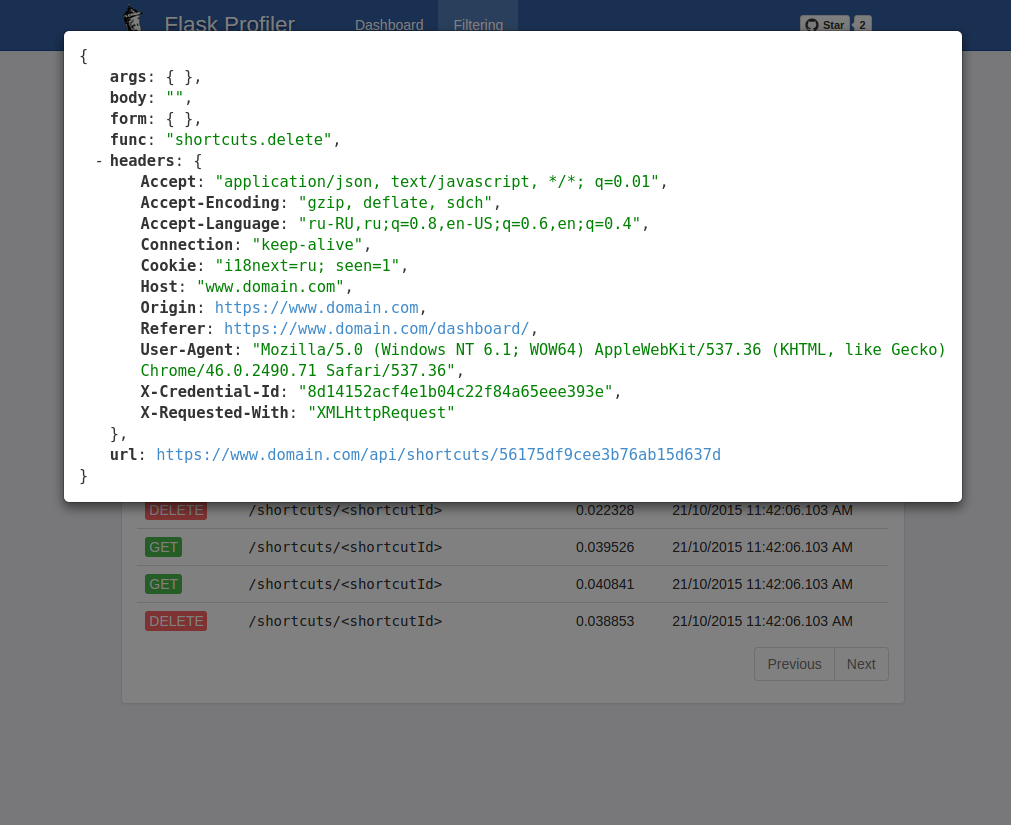
You can see all the details of a request.

Quick Start
It is easy to understand flask-profiler going through an example. Let's dive in.
Install flask-profiler by pip.
pip install flask_profiler
Edit your code where you are creating Flask app.
# your app.py
from flask import Flask
import flask_profiler

app = Flask(__name__)
app.config["DEBUG"] = True

# You need to declare necessary configuration to initialize
# flask-profiler as follows:
app.config["flask_profiler"] = {
    "enabled": app.config["DEBUG"],
    "storage": {
        "engine": "sqlite"
    },
    "basicAuth":{
        "enabled": True,
        "username": "admin",
        "password": "admin"
    },
    "ignore": [
	    "^/static/.*"
	]
}


@app.route('/product/<id>', methods=['GET'])
def getProduct(id):
    return "product id is " + str(id)


@app.route('/product/<id>', methods=['PUT'])
def updateProduct(id):
    return "product {} is being updated".format(id)


@app.route('/products', methods=['GET'])
def listProducts():
    return "suppose I send you product list..."

@app.route('/static/something/', methods=['GET'])
def staticSomething():
    return "this should not be tracked..."

# In order to active flask-profiler, you have to pass flask
# app as an argument to flask-profiler.
# All the endpoints declared so far will be tracked by flask-profiler.
flask_profiler.init_app(app)


# endpoint declarations after flask_profiler.init_app() will be
# hidden to flask_profiler.
@app.route('/doSomething', methods=['GET'])
def doSomething():
    return "flask-profiler will not measure this."


# But in case you want an endpoint to be measured by flask-profiler,
# you can specify this explicitly by using profile() decorator
@app.route('/doSomethingImportant', methods=['GET'])
@flask_profiler.profile()
def doSomethingImportant():
    return "flask-profiler will measure this request."

if __name__ == '__main__':
    app.run(host="127.0.0.1", port=5000)
Now run your app.py
python app.py
And make some requests like:
curl http://127.0.0.1:5000/products
curl http://127.0.0.1:5000/product/123
curl -X PUT -d arg1=val1 http://127.0.0.1:5000/product/123
If everything is okay, Flask-profiler will measure these requests. You can see the result heading to http://127.0.0.1:5000/flask-profiler/ or get results as JSON http://127.0.0.1:5000/flask-profiler/api/measurements?sort=elapsed,desc
If you like to initialize your extensions in other files or use factory apps pattern, you can also create a instance of the Profiler class, this will register all your endpoints once you app run by first time. E.g:
from flask import Flask
from flask_profiler import Profiler

profiler = Profiler()

app = Flask(__name__)

app.config["DEBUG"] = True

# You need to declare necessary configuration to initialize
# flask-profiler as follows:
app.config["flask_profiler"] = {
    "enabled": app.config["DEBUG"],
    "storage": {
        "engine": "sqlite"
    },
    "basicAuth":{
        "enabled": True,
        "username": "admin",
        "password": "admin"
    },
    "ignore": [
        "^/static/.*"
    ]
}

profiler = Profiler()  # You can have this in another module
profiler.init_app(app)
# Or just Profiler(app)

@app.route('/product/<id>', methods=['GET'])
def getProduct(id):
    return "product id is " + str(id)
Using with different database system
You can use flaskprofiler with SqlLite, MongoDB, Postgresql, Mysql or MongoDB database systems. However, it is easy to support other database systems. If you would like to have others, please go to contribution documentation. (It is really easy.)
SQLite
In order to use SQLite, just specify it as the value of storage.engine directive as follows.
app.config["flask_profiler"] = {
    "storage": {
        "engine": "sqlite",
    }
}
Below the other options are listed.
| Filter key | Description | Default |
|---|---|---|
| storage.FILE | SQLite database file name | flask_profiler.sql |
| storage.TABLE | table name in which profiling data will reside | measurements |
MongoDB
In order to use MongoDB, just specify it as the value of storage.engine directive as follows.
app.config["flask_profiler"] = {
    "storage": {
        "engine": "mongodb",
    }
}
SQLAchemy
In order to use SQLAchemy, just specify it as the value of storage.engine directive as follows.
Also first create an empty database with the name "flask_profiler".
app.config["flask_profiler"] = {
    "storage": {
        "engine": "sqlalchemy",
        "db_url": "postgresql://user:[email protected]:5432/flask_profiler"  # optional, if no db_url specified then sqlite will be used.
    }
}
Custom database engine
Specify engine as string module and class path.
app.config["flask_profiler"] = {
    "storage": {
        "engine": "custom.project.flask_profiler.mysql.MysqlStorage",
        "MYSQL": "mysql://user:[email protected]/flask_profiler"
    }
}
The other options are listed below.
| Filter key | Description | Default |
|---|---|---|
| storage.MONGO_URL | mongodb connection string | mongodb://localhost |
| storage.DATABASE | database name | flask_profiler |
| storage.COLLECTION | collection name | measurements |
Sampling
Control the number of samples taken by flask-profiler
You would want control over how many times should the flask profiler take samples while running in production mode. You can supply a function and control the sampling according to your business logic.
Example 1: Sample 1 in 100 times with random numbers
app.config["flask_profiler"] = {
    "sampling_function": lambda: True if random.sample(list(range(1, 101)), 1) == [42] else False
}
Example 2: Sample for specific users
app.config["flask_profiler"] = {
    "sampling_function": lambda: True if user is 'divyendu' else False
}
If sampling function is not present, all requests will be sampled.
Changing flask-profiler endpoint root
By default, we can access flask-profiler at /flask-profiler
app.config["flask_profiler"] = {
        "endpointRoot": "secret-flask-profiler"
}
Ignored endpoints
Flask-profiler will try to track every endpoint defined so far when init_app() is invoked. If you want to exclude some of the endpoints, you can define matching regex for them as follows:
app.config["flask_profiler"] = {
        "ignore": [
	        "^/static/.*",
	        "/api/users/\w+/password"
        ]
}
Contributing
Contributions are welcome!
Review the Contributing Guidelines for details on how to:
- Submit issues
- Add solutions to existing challenges
- Add new challenges
Authors
- Musafa Atik
- Fatih Sucu
- Safa Yasin Yildirim
License
MIT


