alexhuang1117 / Data Science Portfolio
A Portfolio of my Data Science Projects
Stars: ✭ 149
Projects that are alternatives of or similar to Data Science Portfolio
Seaborn Tutorial
This repository is my attempt to help Data Science aspirants gain necessary Data Visualization skills required to progress in their career. It includes all the types of plot offered by Seaborn, applied on random datasets.
Stars: ✭ 114 (-23.49%)
Mutual labels: jupyter-notebook, data-science, data-analysis, data-visualization
Articles
A repository for the source code, notebooks, data, files, and other assets used in the data science and machine learning articles on LearnDataSci
Stars: ✭ 350 (+134.9%)
Mutual labels: jupyter-notebook, data-science, data-analysis, data-visualization
Cryptocurrency Analysis Python
Open-Source Tutorial For Analyzing and Visualizing Cryptocurrency Data
Stars: ✭ 278 (+86.58%)
Mutual labels: jupyter-notebook, data-science, data-analysis, data-visualization
Pythondata
repo for code published on pythondata.com
Stars: ✭ 113 (-24.16%)
Mutual labels: jupyter-notebook, data-science, data-analysis, data-visualization
Cookbook 2nd
IPython Cookbook, Second Edition, by Cyrille Rossant, Packt Publishing 2018
Stars: ✭ 704 (+372.48%)
Mutual labels: jupyter-notebook, data-science, data-analysis, data-visualization
Data Science Hacks
Data Science Hacks consists of tips, tricks to help you become a better data scientist. Data science hacks are for all - beginner to advanced. Data science hacks consist of python, jupyter notebook, pandas hacks and so on.
Stars: ✭ 273 (+83.22%)
Mutual labels: jupyter-notebook, data-science, data-analysis, data-visualization
Datasist
A Python library for easy data analysis, visualization, exploration and modeling
Stars: ✭ 123 (-17.45%)
Mutual labels: jupyter-notebook, data-science, data-analysis, data-visualization
Data Science Resources
👨🏽🏫You can learn about what data science is and why it's important in today's modern world. Are you interested in data science?🔋
Stars: ✭ 171 (+14.77%)
Mutual labels: jupyter-notebook, data-science, data-analysis, data-visualization
Cookbook 2nd Code
Code of the IPython Cookbook, Second Edition, by Cyrille Rossant, Packt Publishing 2018 [read-only repository]
Stars: ✭ 541 (+263.09%)
Mutual labels: jupyter-notebook, data-science, data-analysis, data-visualization
Courses
Quiz & Assignment of Coursera
Stars: ✭ 454 (+204.7%)
Mutual labels: jupyter-notebook, data-science, data-analysis, data-visualization
Deep Learning Machine Learning Stock
Stock for Deep Learning and Machine Learning
Stars: ✭ 240 (+61.07%)
Mutual labels: jupyter-notebook, data-science, data-analysis, data-visualization
Data Science Lunch And Learn
Resources for weekly Data Science Lunch & Learns
Stars: ✭ 49 (-67.11%)
Mutual labels: jupyter-notebook, data-science, data-analysis, data-visualization
Amazing Feature Engineering
Feature engineering is the process of using domain knowledge to extract features from raw data via data mining techniques. These features can be used to improve the performance of machine learning algorithms. Feature engineering can be considered as applied machine learning itself.
Stars: ✭ 218 (+46.31%)
Mutual labels: jupyter-notebook, data-science, data-analysis, data-visualization
Dat8
General Assembly's 2015 Data Science course in Washington, DC
Stars: ✭ 1,516 (+917.45%)
Mutual labels: jupyter-notebook, data-science, data-analysis, data-visualization
Dtale
Visualizer for pandas data structures
Stars: ✭ 2,864 (+1822.15%)
Mutual labels: jupyter-notebook, data-science, data-analysis, data-visualization
Pydataroad
open source for wechat-official-account (ID: PyDataLab)
Stars: ✭ 302 (+102.68%)
Mutual labels: jupyter-notebook, data-science, data-analysis, data-visualization
Ml Workspace
🛠 All-in-one web-based IDE specialized for machine learning and data science.
Stars: ✭ 2,337 (+1468.46%)
Mutual labels: jupyter-notebook, data-science, data-analysis, data-visualization
Data Science
Collection of useful data science topics along with code and articles
Stars: ✭ 315 (+111.41%)
Mutual labels: jupyter-notebook, data-science, data-analysis, data-visualization
Data Science On Gcp
Source code accompanying book: Data Science on the Google Cloud Platform, Valliappa Lakshmanan, O'Reilly 2017
Stars: ✭ 864 (+479.87%)
Mutual labels: jupyter-notebook, data-science, data-analysis, data-visualization
My Journey In The Data Science World
📢 Ready to learn or review your knowledge!
Stars: ✭ 1,175 (+688.59%)
Mutual labels: jupyter-notebook, data-science, data-analysis, data-visualization
Data Science Portfolio
A repository of the projects I worked on or currently working on. It is updated regularly. The projects are either written in R (R markdown) or Python (Jupyter Notebook). Click on the projects to see full analysis and code.
Please contact me on Linkedin if you are looking to hire a data scientist.
Projects:
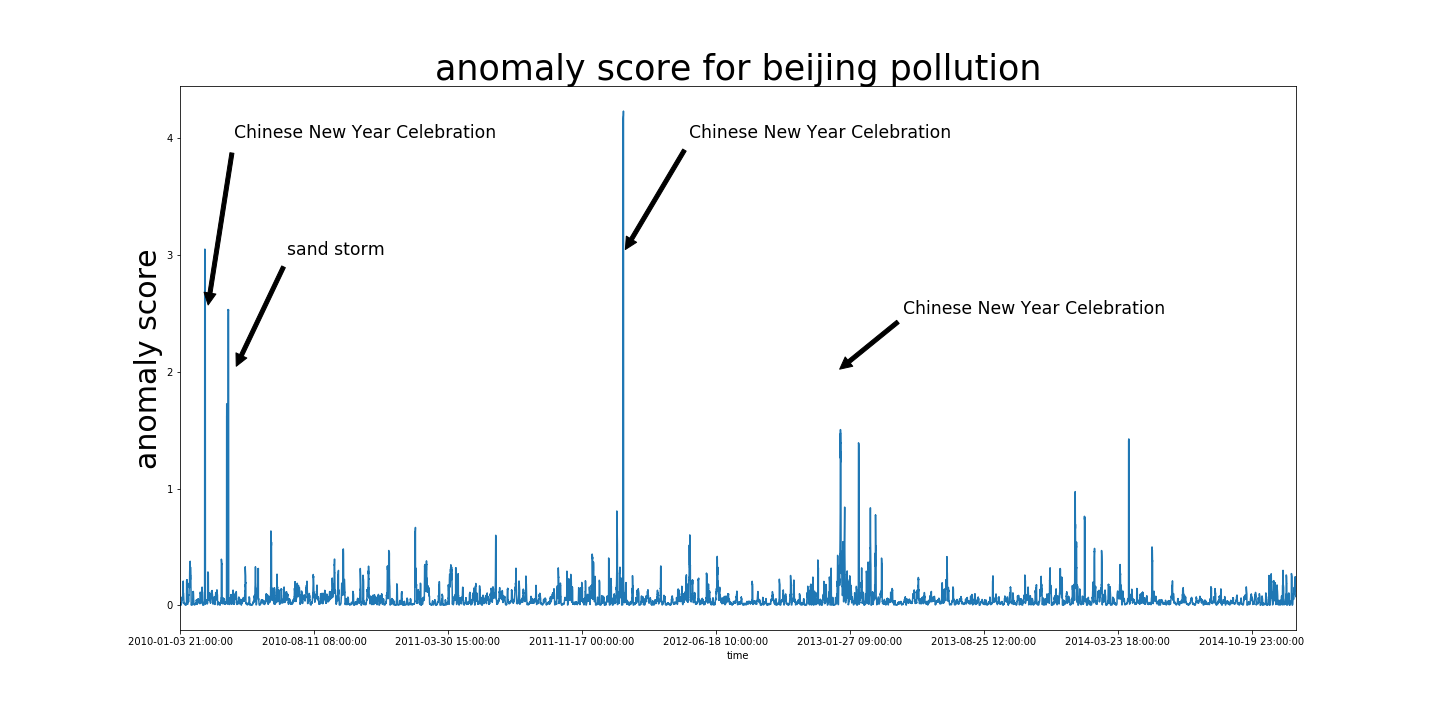
Anomaly Detection on Beijing pm2.5 data using LSTM - Under Construction
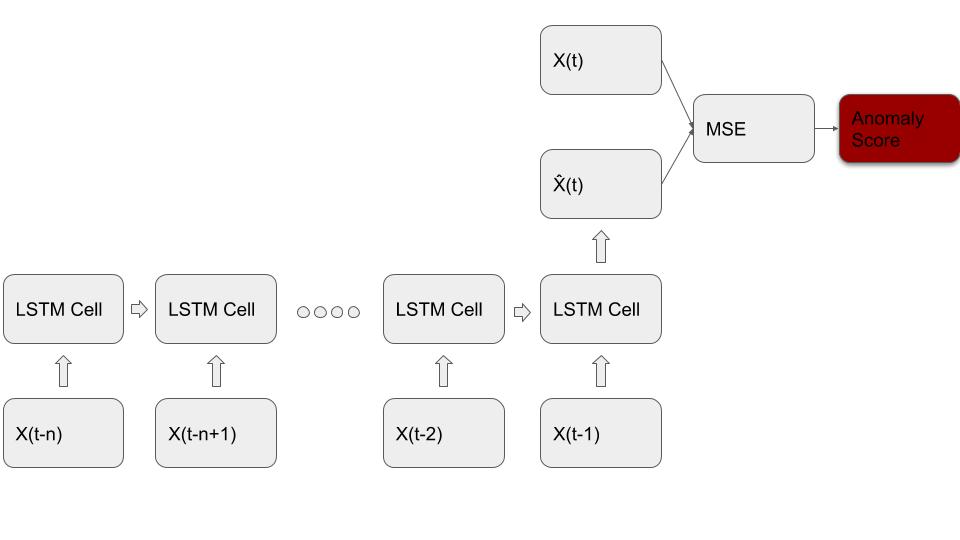
- Used LSTM to fit five years of Beijing weather data
- Constructed anomaly scores from the difference between model prediction and real data
- Investigated time periods with high anomaly scores
- Results confirms that high anomaly scores corresponds with extreme weather (floods, heavy rain, firework celebration, etc)
-
Keywords(Anomaly Detection, Time Series, LSTM, Weather, Beijing, Semi-supervised learning)
Exchange Rate Analysis During US Election
- Predicted US (2016) election results in realtime as the voting results of each region becomes available.
- Regressed states with results against polling data and predicted results for the remaining states
- Monte Carlos simulation used to simulate the winner of the election.
- Compared simulated results with exchange rates fluctuations to see if market is efficient.
- Keywords(Python, Linear Regression, Monte Carlos Simulation)

Power-law or Log-normal? Baby Name and Twitter Analysis
- Fitted power-law and log-normal distribution to US baby names data since 1960.
- Use bootstrapping techniques to find a distribution of the power-law parameters
- Crawled Twitter to find 20000 random user and fitted power law distribution to users' friends count and followers count.
- Keywords(R, Power-law, Bootstrapping, Log-normal)

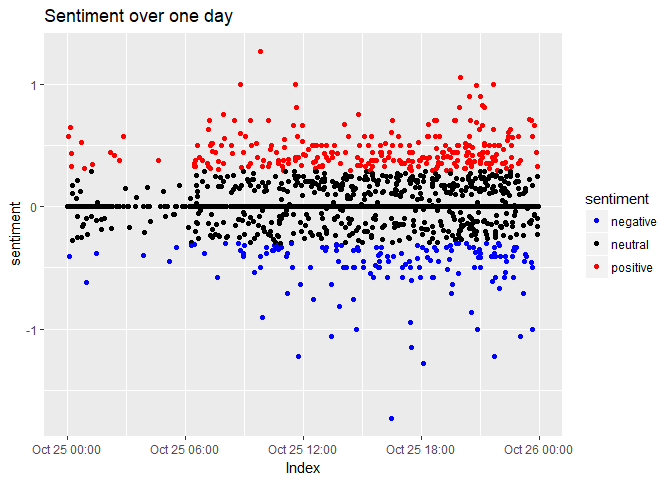
Twitter Sentiment Daily and Weekly Fluctuations
- Parsed a few GB of Tweets to select all the tweets in UK and in English.
- Used 'qdap' package to analyze the emotion of the Tweets
- Plotted the emotions over the day and over the week and analysed the interesting results.
-
Keywords(R, Twitter API, Time Series, Sentiment Analysis, ggplot)

GDP and Future Orientation
- Downloaded economic indicators data using World Bank API, and cleaned data
- Downloaded search query of next and last year in Google for each country
- Fitted linear regression between GDP and future orientation
-
Keywords(R, World Bank API, Google API, Data Cleaning, Linear regression)


Exchange Rate Analysis During UK Election - Under Construction
- Predicted UK (2017) election victories as the voting results as it happened.
- retrieved from Tweets of result announcement and extracted time of announcement for each region.
- Regressed regions with results against polling data and predicted results for the remaining regions
- Monte Carlos simulation used to simulate the winner of the election.
- Keywords(Python, Twitter API, Merging Data)
Note that the project description data, including the texts, logos, images, and/or trademarks,
for each open source project belongs to its rightful owner.
If you wish to add or remove any projects, please contact us at [email protected].