Learning Counterfactual Representations for Estimating Individual Dose-Response Curves
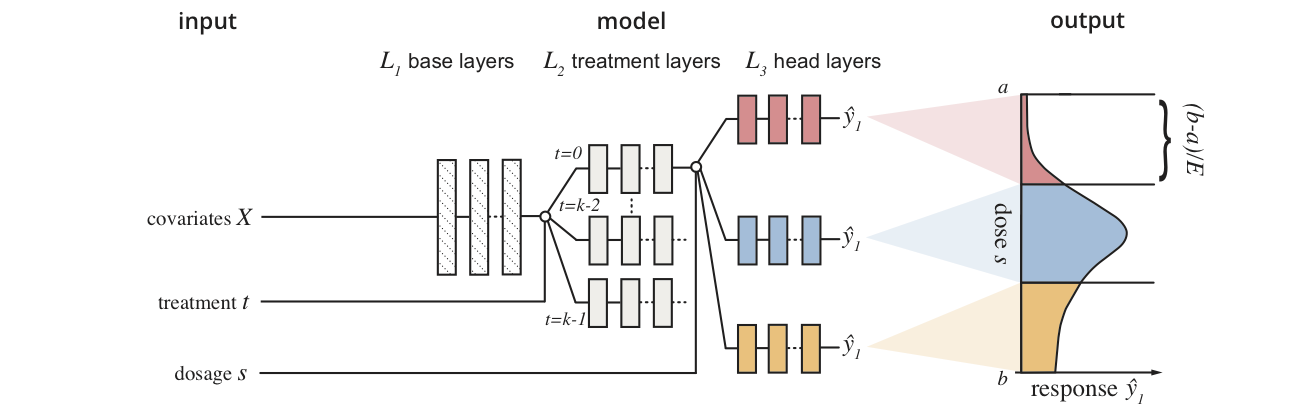
Dose response networks (DRNets) are a method for learning to estimate individual dose-response curves for multiple parametric treatments from observational data using neural networks. This repository contains the source code used to evaluate DRNets and the most relevant existing state-of-the-art methods for estimating individual treatment effects (for results please see our manuscript). In order to facilitate future research, the source code is designed to be easily extensible with (1) new methods and (2) new benchmark datasets.
Author(s): Patrick Schwab, ETH Zurich [email protected], Lorenz Linhardt, ETH Zurich [email protected], Stefan Bauer, MPI for Intelligent Systems [email protected], Joachim M. Buhmann, ETH Zurich [email protected] and Walter Karlen, ETH Zurich [email protected]
License: MIT, see LICENSE.txt
Citation
If you reference or use our methodology, code or results in your work, please consider citing:
@inproceedings{schwab2020doseresponse,
  title={{Learning Counterfactual Representations for Estimating Individual Dose-Response Curves}},
  author={Schwab, Patrick and Linhardt, Lorenz and Bauer, Stefan and Buhmann, Joachim M and Karlen, Walter},
  booktitle={{AAAI Conference on Artificial Intelligence}},
  year={2020}
}
Usage:
- Runnable scripts are in the
drnet/apps/subdirectory.drnet/apps/main.pyis the main runnable script for running experiments.- The available command line parameters for runnable scripts are described in
drnet/apps/parameters.py
- You can add new baseline methods to the evaluation by subclassing
drnet/models/baselines/baseline.py- See e.g.
drnet/models/baselines/neural_network.pyfor an example of how to implement your own baseline methods. - You can register new methods for use from the command line by adding a new entry to the
get_method_name_mapmethod indrnet/apps/main.py
- See e.g.
- You can add new benchmarks by implementing the benchmark interface, see e.g.
drnet/models/benchmarksfor examples of how to add your own benchmark to the benchmark suite.- You can register new benchmarks for use from the command line by adding a new entry to the
get_benchmark_name_mapmethod indrnet/apps/evaluate.py
- You can register new benchmarks for use from the command line by adding a new entry to the
Requirements and dependencies
-
This project was designed for use with Python 2.7. We can not guarantee and have not tested compatibility with Python 3.
-
To run the TCGA and News benchmarks, you need to download the SQLite databases containing the raw data samples for these benchmarks (
news.dbandtcga.db).- You can download the raw data using these links: tcga.db and news.db.
- Note that you need around 10GB of free disk space to store the databases.
- Save the database files to the
./datadirectory relative to this file in order to be compatible with the step-by-step guides below or adjust the commands accordingly.
- You can download the raw data using these links: tcga.db and news.db.
-
To run the MVICU benchmark, you need to get access to the MIMIC-III database which requires going through an approval process, due to the sensitive nature of the dataset.
- Note that you need around 75GB of free disk space to store the MIMIC-III database with indices.
- Once you have access to the dataset and loaded the MIMIC-III data into an SQLite database (saved as e.g.
/your/path/to/mimic3.db), you can use thedrnet/apps/load_db_icu.pyscript to extract the MVICU benchmark data from the MIMIC-III database into a separate database in the./datafolder by running:python drnet/apps/load_db_icu.py /your/path/to/mimic3.db ./data- Once built, the benchmark database uses around 43MB of disk space.
-
To run BART, Causal Forests and GPS, and to reproduce the figures you need to have R installed. See https://www.r-project.org/ for installation instructions.
- To run BART, you need to have the R-packages
rJavaandbartMachineinstalled. See https://github.com/kapelner/bartMachine for installation instructions. Note thatrJavarequires a working Java installation as well. - To run Causal Forests, you need to have the R-package
grfinstalled. See https://github.com/grf-labs/grf for installation instructions. - To run GPS, you need to have the R-package
causaldrfinstalled, e.g. by runninginstall.packages("causaldrf")in your R-shell. - To reproduce the paper's figures, you need to have the R-package
latex2expinstalled. See https://cran.r-project.org/web/packages/latex2exp/vignettes/using-latex2exp.html for installation instructions.
- To run BART, you need to have the R-packages
-
For the python dependencies, see
setup.py. You can usepip install .to install the drnet package and its python dependencies. Note that the installation ofrpy2will fail if you do not have a working R installation on your system (see above).
Reproducing the experiments
- Make sure you have the necessary requirements listed above, including a
./datadirectory relative to this file with the required databases (see above). - You can use the script
drnet/apps/run_all_experiments.pyto obtain the exact parameters used withmain.pyto reproduce the experimental results in the paper.- The
drnet/apps/run_all_experiments.pyscript prints the command line parameters that have to be executed to reproduce the experiments, one command per line. - The
drnet/apps/run_all_experiments.pyscript only prints the command line parameters - they are not executed automatically. You must execute them manually using your compute platform of choice. You can test individual commands by pasting them into the console.- The time required to complete a single command can range from an hour to multiple days of CPU time, depending on the model being evaluated.
- Note that we ran hundreds of experiments using multiple CPU months of computation time. We therefore suggest to run the commands in parallel using, e.g., a compute cluster.
- The original experiments reported in our paper were run on Intel CPUs. We found that running the experiments on GPUs can produce slightly different results for the same experiments.
- The
- Once you have completed the experiments, you can calculate the summary statistics (mean +- standard deviation) over all the repeated runs using the
./run_results.shscript. The results are reported in LaTeX syntax in the order reported in the results tables, i.e.{12.2} $\pm$ 0.1 & {14.3} $\pm$ 0.2 & {32.8} $\pm$ 0.0where 12.2, 14.3 and 32.8 are the means of MISE, DPE and PE and 0.1, 0.2, and 0.0 are the standard deviations of MISE, DPE and PE, respectively.- See the step-by-step instructions below to reproduce each reported result.
- If the
./run_results.shscript produces errors, one or multiple of your runs may have failed to complete successfully. You can check the run'srun.txtfile to see whether there have been any errors.
- You can reproduce the figures in our manuscript using the R-scripts in
drnet/visualisation/.
News-2/News-4/News-8/News-16
- Navigate to the directory containing this file.
- Create a folder to hold the experimental results
mkdir -p results. - Run
python ./drnet/apps/run_all_experiments.py ./drnet/apps news ./data ./results- The script will print all the command line configurations (260 in total) you need to run to obtain the experimental results to reproduce the News results.
- Run all of the printed command line configurations from the previous step in a compute environment of your choice.
- After the experiments have concluded, use
./run_results.shto calculate the summary metrics over the repeated runs in LaTeX syntax.- Use
./run_results.sh ./results/drnet_news2a10k_{METHOD_NAME}_mse_1, where {METHOD_NAME} should be replaced with the shorthand code of the method for which you wish to read out the result metrics. - The complete list of method shorthand codes are: "pbm_mahal" = "+ PM", "no_tarnet" = "MLP", "tarnet_no_repeat" = "- Repeat", "tarnet_no_strata" = "TARNET", "knn" = "kNN", "psmpbm_mahal" = "PSM_PM", "gps" = "GPS", "bart" = "BART", "cf" = "CF", "ganite" = "GANITE", "tarnetpd" = "+ PD", "tarnet" = "DRNet", "cfrnet" = "+ Wasserstein"
- Example 1:
./run_results.sh ./results/drnet_news4a10k_tarnet_mse_1to get the results for "DRNet" on News-2. - Example 2:
./run_results.sh ./results/drnet_news4a10k_tarnet_mse_1to get the results for "DRNet" on News-4. - Example 3:
./run_results.sh ./results/drnet_news8a10k_tarnet_mse_1to get the results for "DRNet" on News-8. - Example 4:
./run_results.sh ./results/drnet_news16a7k_tarnet_mse_1to get the results for "DRNet" on News-16. - Repeat for all evaluated method / benchmark combinations.
- Example 1:
- Use
MVICU
- Navigate to the directory containing this file.
- Create a folder to hold the experimental results
mkdir -p results. - Run
python ./drnet/apps/run_all_experiments.py ./drnet/apps icu ./data ./results- The script will print all the command line configurations (65 in total) you need to run to obtain the experimental results to reproduce the MVICU results.
- Run all of the printed command line configurations from the previous step in a compute environment of your choice.
- After the experiments have concluded, use
./run_results.shto calculate the summary metrics over the repeated runs in LaTeX syntax.- Example 1:
./run_results.sh ./results/drnet_icu3a10k_cf_mse_1to get the results for "CF" on MVICU. - Example 2:
./run_results.sh ./results/drnet_icu3a10k_pbm_mahal_mse_1to get the results for "+ Wasserstein" on MVICU. - Example 3:
./run_results.sh ./results/drnet_icu3a10k_pbm_no_tarnet_mse_1to get the results for "MLP" on MVICU. - Repeat for all evaluated method / benchmark combinations.
- Example 1:
TCGA
- Navigate to the directory containing this file.
- Create a folder to hold the experimental results
mkdir -p results. - Run
python ./drnet/apps/run_all_experiments.py ./drnet/apps tcga ./data ./results- The script will print all the command line configurations (50 in total) you need to run to obtain the experimental results to reproduce the TCGA results.
- Unlike the other benchmarks, the TCGA script does not create commands for "knn" and "bart" because evaluating those methods with this high number of features is computationally very expensive.
- Run all of the printed command line configurations from the previous step in a compute environment of your choice.
- After the experiments have concluded, use
./run_results.shto calculate the summary metrics over the repeated runs in LaTeX syntax.- Example 1:
./run_results.sh ./results/drnet_tcga3a10k_pbm_mahal_mse_1to get the results for "+ Wasserstein" on TCGA. - Example 2:
./run_results.sh ./results/drnet_tcga3a10k_no_tarnet_mse_1to get the results for "MLP" on TCGA. - Example 3:
./run_results.sh ./results/drnet_tcga3a10k_gps_mse_1to get the results for "GPS" on TCGA. - Repeat for all evaluated method / benchmark combinations.
- Example 1:
Number of Dosage Strata (Figure 2)
- Navigate to the directory containing this file.
- Create a folder to hold the experimental results
mkdir -p results. - Run
python ./drnet/apps/run_all_experiments.py ./drnet/apps icu_exposure ./data ./results- The script will print all the command line configurations (5 in total) you need to run to obtain the experimental results to reproduce the results in Figure 2.
- Run all of the printed command line configurations from the previous step in a compute environment of your choice.
- After the experiments have concluded, use
./run_results.shto calculate the summary metrics over the repeated runs in LaTeX syntax.- Example 1:
./run_results.sh ./results/drnet_icu3a10k2e_tarnet_mse_1, where2eindicates 2 dosage strata, to get the results for "DRNet" on MVICU with 2 dosage strata. - Example 2:
./run_results.sh ./results/drnet_icu3a10k4e_tarnet_mse_1, where4eindicates 4 dosage strata, to get the results for "DRNet" on MVICU with 4 dosage strata. - Repeat for all evaluated numbers of dosage strata E=2,4,6,8, and 10.
- Example 1:
- Your results should match those found in the
drnet/visualisation/strata_plot.Rfile.
Treatment Assignment Bias (Figure 3)
- Navigate to the directory containing this file.
- Create a folder to hold the experimental results
mkdir -p results. - Run
python ./drnet/apps/run_all_experiments.py ./drnet/apps news_treatment_assignment_bias ./data ./results- The script will print all the command line configurations (28 in total) you need to run to obtain the experimental results to reproduce the results in Figure 3.
- Run all of the printed command line configurations from the previous step in a compute environment of your choice.
- After the experiments have concluded, use
./run_results.shto calculate the summary metrics over the repeated runs in LaTeX syntax.- Example 1:
./run_results.sh ./results/drnet_news2a5k_gps_mse_1, where5kindicates kappa=5, to get the results for "GPS" on News-2 with treatment assignment bias factor kappa set to 5. - Example 2:
./run_results.sh ./results/drnet_news2a7k_gps_mse_1, where7kindicates kappa=7, to get the results for "GPS" on News-2 with treatment assignment bias factor kappa set to 7. - Repeat for all evaluated methods and levels of kappa=5,7,10,12,15,17, and 20.
- Example 1:
- Your results should match those found in the
drnet/visualisation/kappa_plot.Rfile.
Acknowledgements
This work was partially funded by the Swiss National Science Foundation (SNSF) project No. 167302 within the National Research Program (NRP) 75 "Big Data". We gratefully acknowledge the support of NVIDIA Corporation with the donation of the Titan Xp GPUs used for this research. The results shown here are in whole or part based upon data generated by the TCGA Research Network: http://cancergenome.nih.gov/.