XD-DENG / Echarts2shiny
Licence: gpl-2.0
To insert interactive charts from ECharts into R Shiny applications (在R Shiny app中插入ECharts可交互图形)
Stars: ✭ 116
Programming Languages
r
7636 projects
Labels
Projects that are alternatives of or similar to Echarts2shiny
Sever
🔪Good-looking problems: customise your Shiny disconnected screen and error messages
Stars: ✭ 60 (-48.28%)
Mutual labels: shiny
Shiny.i18n
Shiny applications internationalisation made easy
Stars: ✭ 104 (-10.34%)
Mutual labels: shiny
Startapp
The START App: R Shiny Transcriptome Analysis Resource Tool
Stars: ✭ 73 (-37.07%)
Mutual labels: shiny
Shinyapps links
A collection of Shiny applications (links shared on Twitter)
Stars: ✭ 109 (-6.03%)
Mutual labels: shiny
Stminsights
A Shiny Application for Inspecting Structural Topic Models
Stars: ✭ 74 (-36.21%)
Mutual labels: shiny
Explore
R package that makes basic data exploration radically simple (interactive data exploration, reproducible data science)
Stars: ✭ 69 (-40.52%)
Mutual labels: shiny
Db Dashboard
Project files of the article featured here: http://db.rstudio.com/best-practices/dashboards/
Stars: ✭ 58 (-50%)
Mutual labels: shiny
ECharts2Shiny
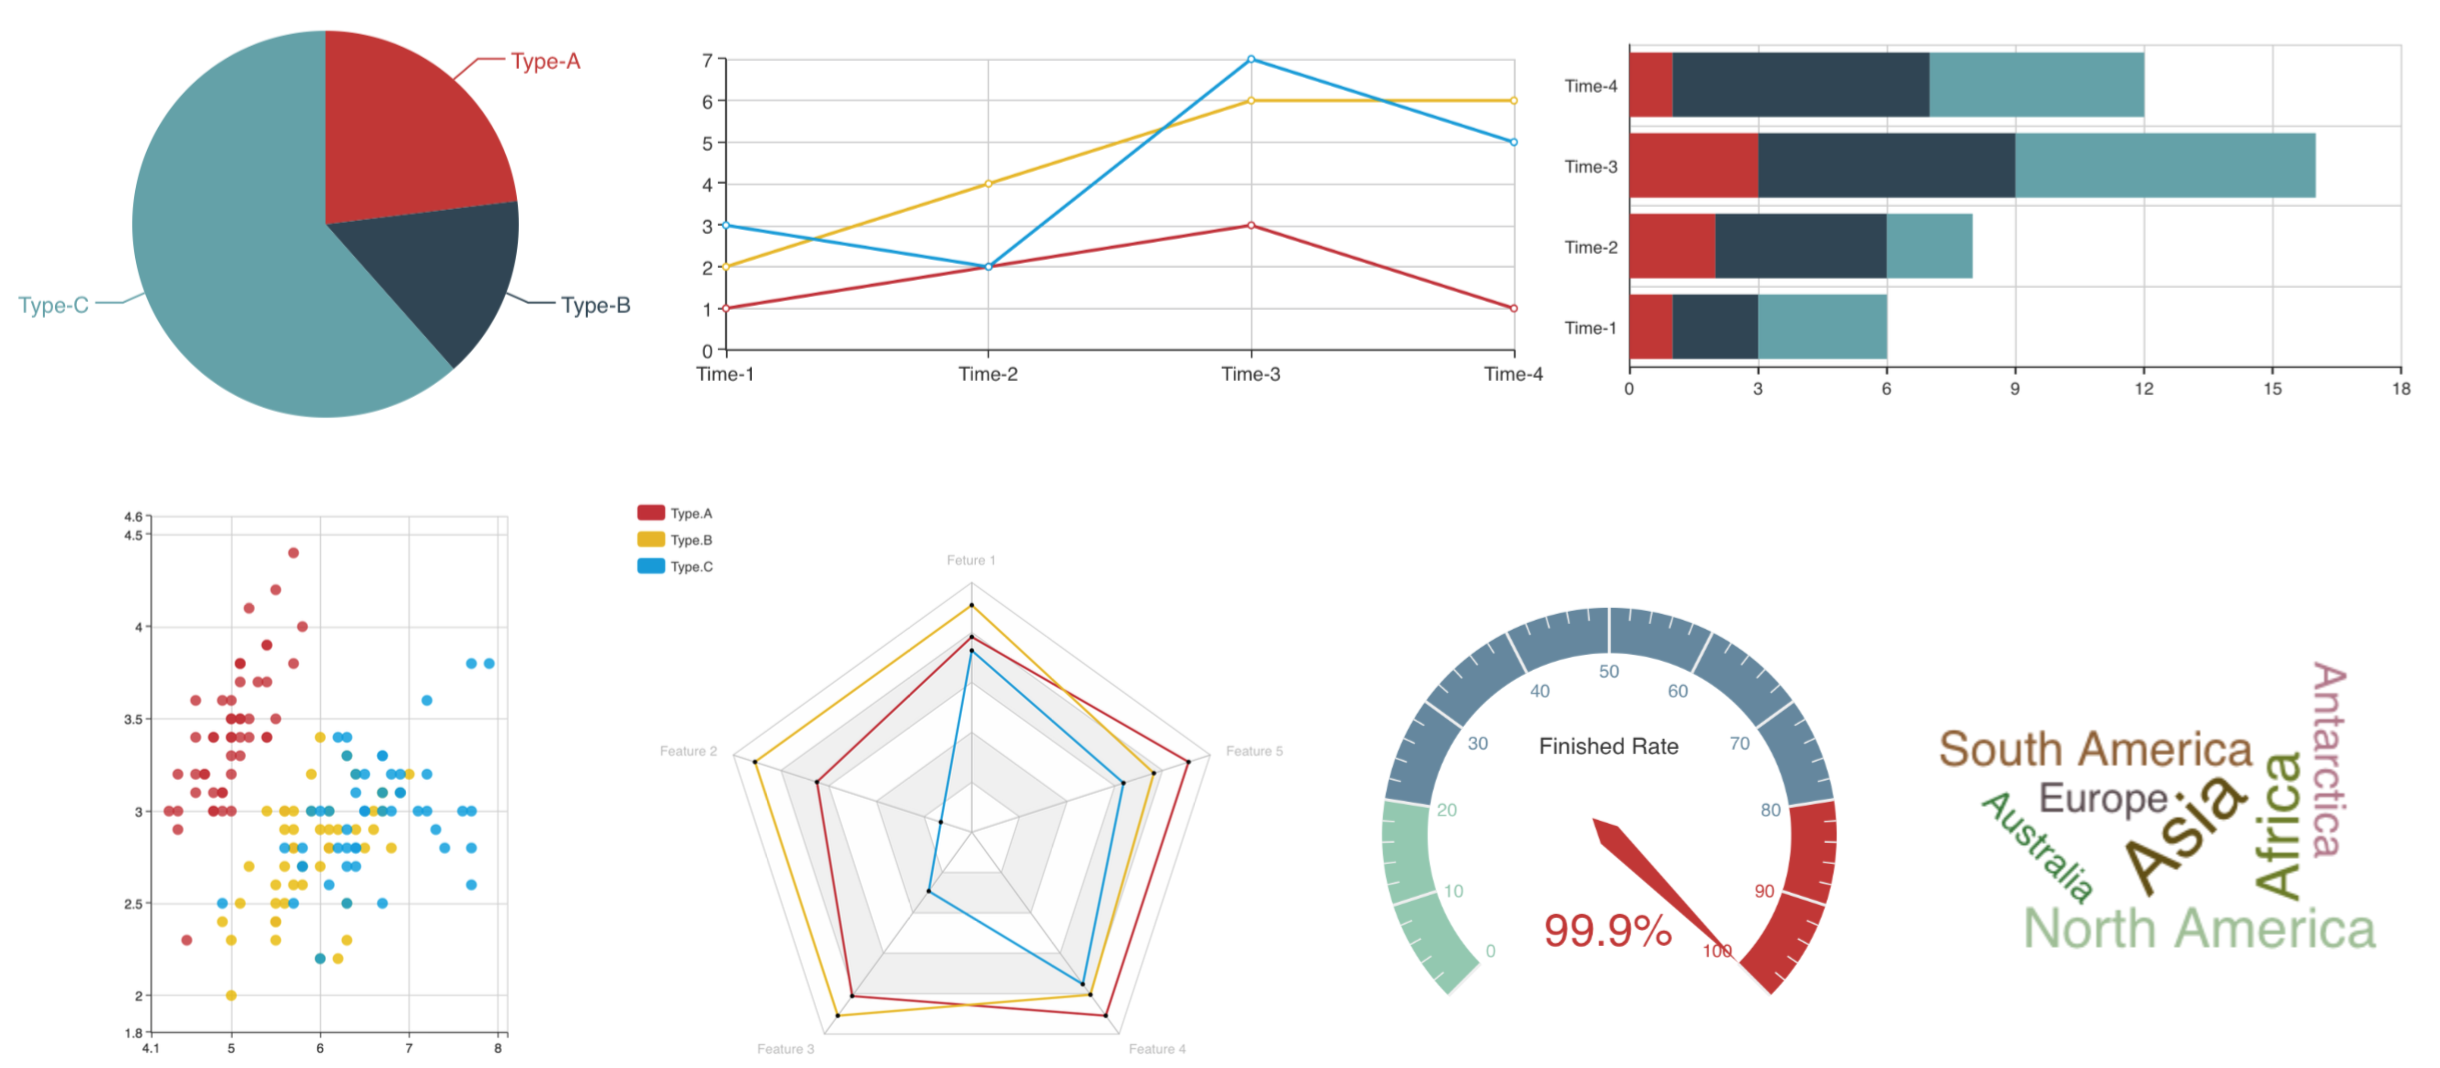

As an R package, ECharts2Shiny can help embed the interactive charts plotted by Apache ECharts (incubating) library into our Shiny application. Currently, we can support
- Pie charts
- Line charts
- Bar charts
- Scatter plots
- Radar chart
- Gauge
- Word Cloud
- Tree Map
- Heat Map
Contents
How to Install
From CRAN,
install.packages("ECharts2Shiny")
For the latest development version, please install from GitHub
library(devtools)
install_github("XD-DENG/ECharts2Shiny")
Examples
library(shiny)
library(ECharts2Shiny)

# Prepare sample data for plotting --------------------------
dat <- data.frame(c(1, 2, 3),
                  c(2, 4, 6))
names(dat) <- c("Type-A", "Type-B")
row.names(dat) <- c("Time-1", "Time-2", "Time-3")

# Server function -------------------------------------------
server <- function(input, output) {
  # Call functions from ECharts2Shiny to render charts
  renderBarChart(div_id = "test", grid_left = '1%', direction = "vertical",
                 data = dat)
}

# UI layout -------------------------------------------------
ui <- fluidPage(
  # We MUST load the ECharts javascript library in advance
  loadEChartsLibrary(),

  tags$div(id="test", style="width:50%;height:400px;"),
  deliverChart(div_id = "test")
)

# Run the application --------------------------------------
shinyApp(ui = ui, server = server)
(For more examples, please refer to the /examples folder)
List of Examples
- 1. Basic
- 2. Diverse Plots
- 3. More Options in Basic Charts
- 4. Scatter
- 5. Use Reactive Values as Data Input
- 6. Radar Chart
- 7. Word Cloud - Basic
- 8. Word Cloud - More Shapes
- 9. Word Cloud - Use Vector as Data Input
- 10. Line Chart with Diverse Options
- 11. Scatter with point.type Argument
- 12. Step Line Chart
- 13. Deal with Missing Values
- 14. Heat Map
- 15. Add Hyperlinks
License
ECharts2Shiny package itself is under GPL-2.
The ECharts JS library is under BSD license (ECharts).
ECharts2Shiny包
ECharts2Shiny作为一个R包,可以帮助在Shiny应用程序中插入由ECharts库绘出的交互图形。当前支持的图形包括
- 饼图 (pie chart)
- 折线图 (line chart)
- 柱形图 (bar chart)
- 散点图 (scatter chart)
- 雷达图 (radar chart)
- 仪表盘 (gauge)
- 词云 (word cloud)
- 矩形树图 (Tree Map)
- 热力图 (heat map)
目录
安装
CRAN版本
install.packages("ECharts2Shiny")
由GitHub安装最新开发版本
library(devtools)
install_github("XD-DENG/ECharts2Shiny")
例子
library(shiny)
library(ECharts2Shiny)

# Prepare sample data for plotting --------------------------
dat <- data.frame(c(1, 2, 3),
                  c(2, 4, 6))
names(dat) <- c("Type-A", "Type-B")
row.names(dat) <- c("Time-1", "Time-2", "Time-3")

# Server function -------------------------------------------
server <- function(input, output) {
  # Call functions from ECharts2Shiny to render charts
  renderBarChart(div_id = "test", grid_left = '1%', direction = "vertical",
                 data = dat)
}

# UI layout -------------------------------------------------
ui <- fluidPage(
  # We MUST load the ECharts javascript library in advance
  loadEChartsLibrary(),

  tags$div(id="test", style="width:50%;height:400px;"),
  deliverChart(div_id = "test")
)

# Run the application --------------------------------------
shinyApp(ui = ui, server = server)
(请参考/examples 文件夹以获得更多实例信息)
实例列表
- 1. Basic
- 2. Diverse Plots
- 3. More Options in Basic Charts
- 4. Scatter
- 5. Use Reactive Values as Data Input
- 6. Radar Chart
- 7. Word Cloud - Basic
- 8. Word Cloud - More Shapes
- 9. Word Cloud - Use Vector as Data Input
- 10. Line Chart with Diverse Options
- 11. Scatter with point.type Argument
- 12. Step Line Chart
- 13. Deal with Missing Values
- 14. Heat Map
- 15. Add Hyperlinks
许可证
ECharts2Shiny 包使用GLP-2许可证。
The ECharts JS库使用BSD许可证(ECharts)。
Note that the project description data, including the texts, logos, images, and/or trademarks,
for each open source project belongs to its rightful owner.
If you wish to add or remove any projects, please contact us at [email protected].