godotengine / Emacs Gdscript Mode
Labels
Projects that are alternatives of or similar to Emacs Gdscript Mode
GDScript mode for Emacs
This package adds support for the GDScript programming language from the Godot game engine in Emacs. It gives syntax highlighting and indentations. Contributors are welcome!
Table of Contents
- Features
- Contributing
- How to install
- Auto-completion with the Language Server Protocol (LSP)
- How to use
- Keyboard shortcuts
- Customization
- Using the debugger
Features
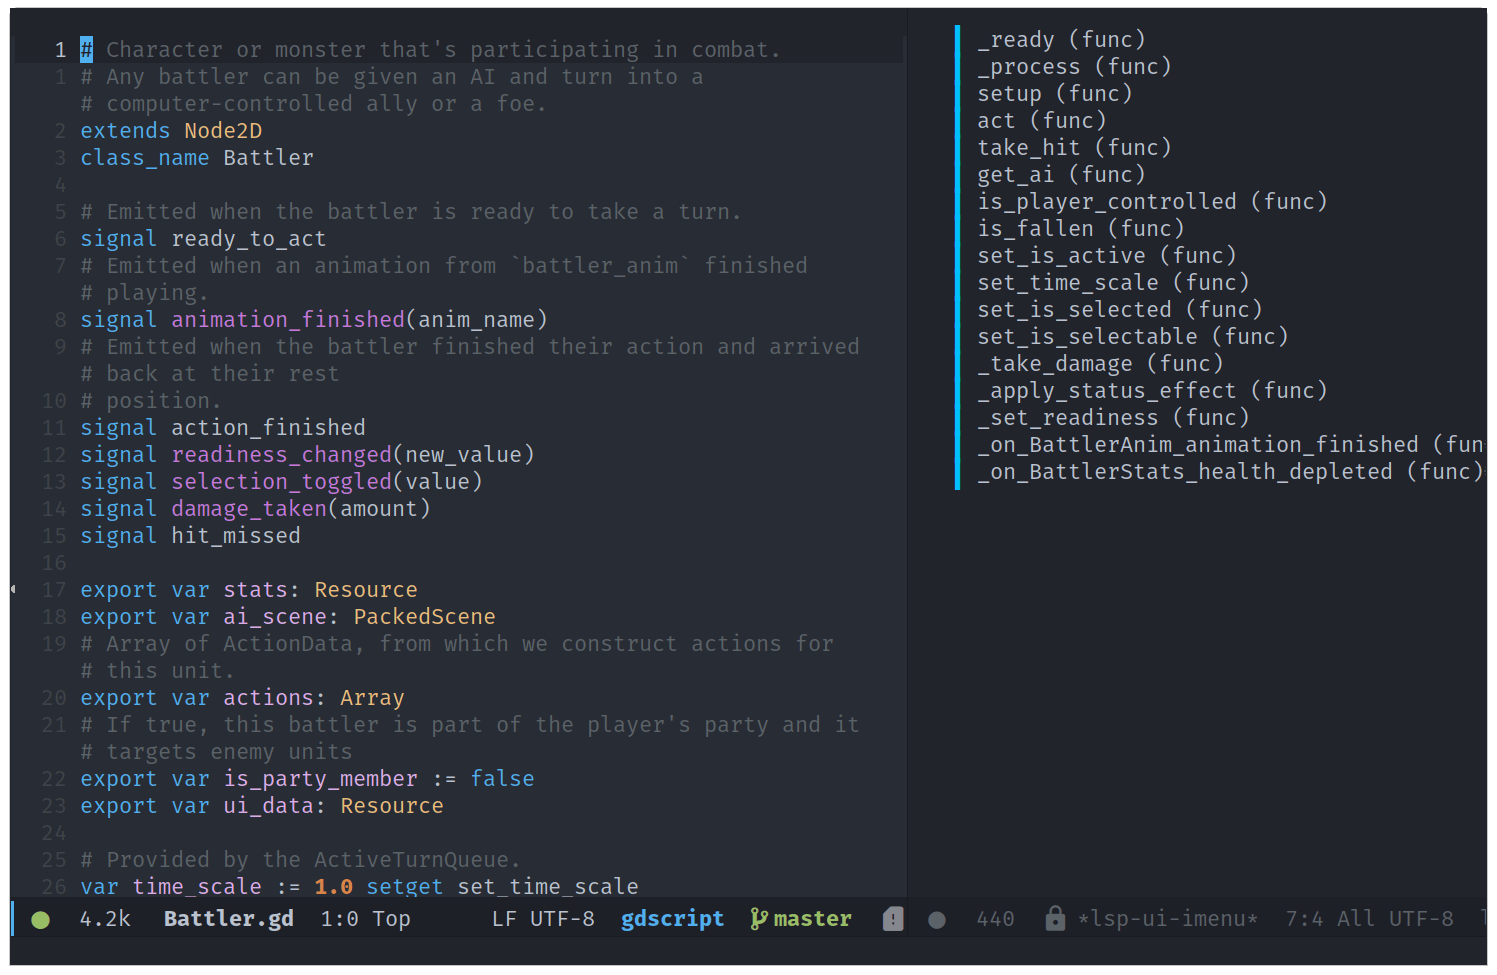
This mode features all the essentials:
- Syntax highlighting.
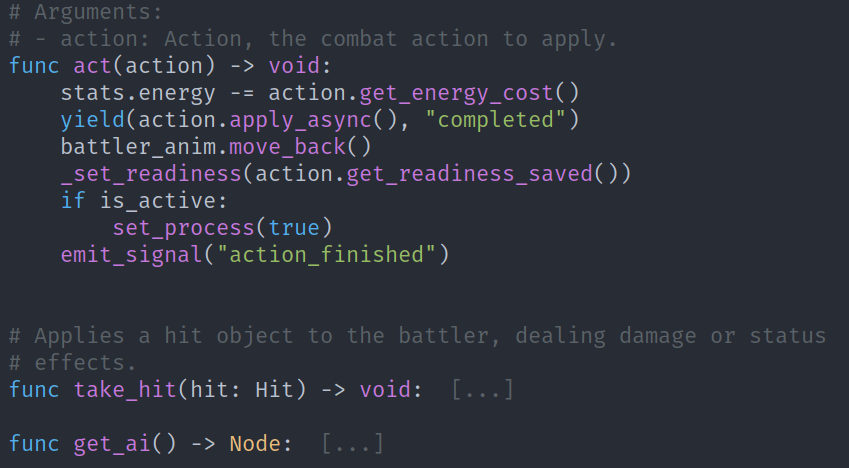
- Code folding.
- Debugger support.
- Imenu.
- Support for scenes (
.tscn) and script (.gd) files. - Comment wrapping when using
fill-paragraph. - Indentation and auto-indentation: tab-based (default) and space-based.
- Automatic pairing of parentheses, brackets, etc.
- Code formatting using gdformat.
- Auto-completion for all the keywords in the
gdscript-keywords.elfile. - Run or open the project and files with Godot.
- Browsing the API reference in Emacs.
Code folding in action.
Contributing
Contributors are welcome! Check the issues tab for tasks to work on and open a PR anytime.
If you find a bug or would like to suggest an improvement, open a new issue.
For code style, we follow the Emacs lisp style guide by Bozhidar Batsov, and the tips and conventions from the Emacs manual.
You should also check for errors and linter warnings in your code. You can do so in Emacs with flymake or flycheck, but we recommend running the tool makem.sh provided with the repository:
./makem.sh lint-compile
This program will tell you if there is any problem with your code. If there's no output, everything is fine. You can run all tests like so, but note it might give you spelling errors that aren't relevant in this project:
./makem.sh all
How to install
The package is available in the MELPA package archive. Once you set up MELPA you can install the package from Emacs:
M-x package-install gdscript-mode
Then, in your init.el file, you can require the package:
(require 'gdscript-mode)
Installing in Spacemacs
- Add the package to the
dotspacemacs-additional-packages. You can find it under the dotspacemacs/layers function:
(defun dotspacemacs/layers ()
  "Configuration Layers declaration..."
  (setq-default
   ;; ...
   dotspacemacs-additional-packages '(gdscript-mode)
   ;; ...
   ))
- In your
dotspacemacs/user-configfunction, require the package.
(defun dotspacemacs/user-config ()
  (require 'gdscript-mode))
Installing in Doom Emacs
Doom Emacs comes with a Godot GDScript module.
You just need to add the "lang: gdscript" keyword to your .doom.d/init.el file.
:lang
(gdscript +lsp)          ; the language you waited for
The +lsp flag adds language server support for game development with Godot.
To see the module's documentation in Emacs, place your cursor over the word gdscript and press k.
Installing with use-package + straight.el
Add the call to use-package to your Emacs configuration:
(use-package gdscript-mode
    :straight (gdscript-mode
               :type git
               :host github
               :repo "GDQuest/emacs-gdscript-mode"))
Installing manually
- Clone the repository or download a stable release to your computer.
- In your init.el file, add a call to load and require the package.
(add-to-list 'load-path "/path/to/gdscript-mode")
(require 'gdscript-mode)
Auto-completion with the Language Server Protocol (LSP)
For auto-completion, we rely on the lsp-mode package and the GDScript language server, which is built into Godot.
The GDScript LSP support is part of the LSP mode. To use it, you need to install lsp-mode on top of gdscript-mode and configure it. To install and configure lsp-mode, see the lsp-mode documentation.
Known issues
There are some known issues with the GDScript language server in Godot 3.2 due to the server being a bit young and not following the specification strictly. This mainly causes some unknown notification errors in lsp-mode at the moment. You can suppress them by adding the following code to your Emacs configuration (thanks to Franco Garcia for sharing this workaround):
(defun lsp--gdscript-ignore-errors (original-function &rest args)
  "Ignore the error message resulting from Godot not replying to the `JSONRPC' request."
  (if (string-equal major-mode "gdscript-mode")
      (let ((json-data (nth 0 args)))
        (if (and (string= (gethash "jsonrpc" json-data "") "2.0")
                 (not (gethash "id" json-data nil))
                 (not (gethash "method" json-data nil)))
            nil ; (message "Method not found")
          (apply original-function args)))
    (apply original-function args)))
;; Runs the function `lsp--gdscript-ignore-errors` around `lsp--get-message-type` to suppress unknown notification errors.
(advice-add #'lsp--get-message-type :around #'lsp--gdscript-ignore-errors)
How to use
Opening the project in the editor
You can open the Godot editor with M-x gdscript-godot-open-project-in-editor, or open files and more in Godot with the M-x gdscript-godot-* commands.
By default, these commands try to use an executable named godot on the system PATH environment variable.
If you don't have godot available there, you can set a custom executable name or path to use instead:
(setq gdscript-godot-executable "/path/to/godot")
You can also use customize to change this path: M-x customize and search for "godot".
Running Godot with visual debug options
When running gdscript-godot-run-project-debug, you can use the universal argument C-u to invoke a mini-buffer with extra options to pass to godot.
Here are the available options:
-
<no options>(default) --debug-collisions--debug-navigation--debug-collisions --debug-navigation
The last selected option is saved for the next time you call gdscript-godot-run-project-debug. To turn off debug options, you need to call the command with the universal argument again.
Using Hydra
Running gdscript-hydra-show (C-c r) opens a hydra popup with options to open the editor or run the project, a scene, or a script, including with visual debug options.
Hydra interactive menu to run the project and set debug options on the fly.
Formatting code with gdformat
You can call the gdscript-format function to format the current buffer with
gdformat. Alternatively, gdscript-format-all will reformat all GDScript files in
the project. This feature requires the python package gdtoolkit to be installed
and available on the system's PATH variable.
You can install gdtoolkit using the pip package manager from Python 3. Run this command in your shell to install it:
pip3 install gdtoolkit
Browsing the Godot API with eww
With the point on a built-in class, you can press C-c C-b o to open the code reference for that class in the text browser eww.
To open the main API reference page and browse it, press C-c C-b a.
Using a local copy of the Godot docs
You can browse the API reference offline with eww. To do so:
- Get a build of the official documentation. You can build it from the godot docs repository or download a build from Hugo Lourcio's website.
- Set
gdscript-docs-local-pathto the docs' directory, that contains the docs'index.htmlfile.
For example:
(setq gdscript-docs-local-path "/home/gdquest/Documents/docs/godot")
Keyboard shortcuts
The following shortcuts are available by default:
- Inserting:
-
C-c i
gdscript-completion-insert-file-path-at-point
-
C-c i
- Formatting:
-
C-c C-f r
gdscript-format-region -
C-c C-f b
gdscript-format-buffer
-
C-c C-f r
- Running the project and scenes in Godot:
-
C-c C-r p
gdscript-godot-open-project-in-editor -
C-c C-r r
gdscript-godot-run-project -
C-c C-r d
gdscript-godot-run-project-debug -
C-c C-r s
gdscript-godot-run-current-scene -
C-c C-r q
gdscript-godot-run-current-scene-debug -
C-c C-r e
gdscript-godot-edit-current-scene -
C-c C-r x
gdscript-godot-run-current-script
-
C-c C-r p
- Browsing the code reference:
-
C-c C-b a
gdscript-docs-browse-api -
C-c C-b o
gdscript-docs-browse-symbol-at-point
-
C-c C-b a
- Open hydra:
-
C-c r
gdscript-hydra-show(require hydra package to be installed) -
C-c n
gdscript-debug-hydra(require hydra package to be installed)
-
C-c r
Customization
To find all GDScript-mode settings, press M-x customize and search for "gdscript".
Code example:
(setq gdscript-use-tab-indents t) ;; If true, use tabs for indents. Default: t
(setq gdscript-indent-offset 4) ;; Controls the width of tab-based indents
(setq gdscript-godot-executable "/path/to/godot") ;; Use this executable instead of 'godot' to open the Godot editor.
(setq gdscript-gdformat-save-and-format t) ;; Save all buffers and format them with gdformat anytime Godot executable is run.
Using the debugger
Emacs GDScript mode includes support for the GDScript debugger. You can use breakpoints, use code stepping functions, see your nodes' state at runtime, and more.
To get started with this feature, you need to add a least one breakpoint.
Adding and removing breakpoints
You can add a breakpoint on the current line with gdscript-debug-add-breakpoint (C-c C-d b). A red dot should appear in the left fringe. Use gdscript-debug-remove-breakpoint (C-c C-d r) to remove a breakpoint on the current line.
After adding at least one breakpoint to the project, a buffer named * Breakpoints * is created. This buffer displays all existing breakpoints in a project. In that buffer, pressing D on a breakpoint line deletes the breakpoint. Pressing RET opens the corresponding GDScript file in another buffer.
Running the project with the debugger active
When any breakpoint exists, running the project with gdscript-godot-run-project will automatically start the debugger's server if one isn't already running and connect to it.
The debugger's server runs on localhost through port 6010 by default. You can customize the port with the gdscript-debug-port variable.
Once Godot hits a breakpoint, Emacs displays two new buffers:
-
* Stack frame vars *displays the locals, members, and globals variables for the current stack point. It shows the variable name, its type, and its value. -
* Inspector *displays detailed information about the selected object. By default, it shows the properties ofself.
You can inspect any object in those two buffers by pressing RET on the corresponding line.
Multi-line display
You can toggle between one-line and multi-line display for values of type Dictionary, PoolRealArray, PoolStringArray, PoolVector2Array, PoolVector3Array and PoolColorArray. To do so, press TAB on the corresponding line.
Fetching an object's details
Pressing d in * Stack frame vars * or * Inspector * buffers (or in the debug hydra) will fetch on the background data for all objects present in those two buffers and redisplay once done. Doing that adds two extra bits of information about the objects:
- Their real type, for example,
KinematicBody2Dinstead ofObjectId. - Their node path.
Debug Hydra
If hydra is available, the debug hydra displays below * Stack frame vars * and * Inspector * buffers upon hitting a breakpoint.
You can also call it by pressing C-c n.
n next  c continue  m step  b breakpoints  s stack  v vars  i inspector  t scene-tree  d details
o pin   u unpin     q quit
- n - Steps to the next line of code.
- c - Continue program execution until the next breakpoint.
- m - Steps into the code.
-
s - Shows the
* Stack dump *buffer. -
v - Shows the
* Stack frame vars *buffer. -
i - Shows the
* Inspector *buffer. -
t - Shows the
* Scene tree *buffer. -
d - Fetches details for all object present in the
* Stack frame vars *and* Inspector *buffers and redisplay the buffers. -
o - Pins
selfin the* Inspector *buffer. It stays displayed until Godot frees the instance or you unpin it. - u - Unpins the currently pinned object.
- q - Closes the debug hydra.
The * Stack frame vars * buffer
The stack frame buffer displays the locals, members, and global variables for the current stack point. Here are available keyboard shortcuts:
- TAB toggles multi-line display for selected types.
-
RET on an object line to display its details in the
* Inspector *buffer. -
l displays the
* Stack dump *buffer. -
d displays additional details for
ObjectIdvariables. - p goes to the previous line.
- n goes to the next line.
-
o pins the current object in the
* Inspector *buffer. - u unpins the currently pinned object.
- q closes the buffer.
* Inspector * buffer
Contains information about inspected object. By default self variable from * Stack frame vars * is displayed. The inspected object is kept in focus until you inspect another object or until the active object ceases to exists, in which case the current self is displayed instead.
- Press TAB to toggle multi-line display for selected typess.
- Press RET on object line to display its detailss.
- Press RET on
Node/pathline (second line from the top) to show given object in* Scene Tree *buffers. - Press l deep in nested object to navigate one level up in the structure (ie. back). Pressing
lwhile on top-level object displays* Stack frame vars *buffers. - Press d to display additional details for object variabless.
- Press p to go to the previous lines.
- Press n to go to the next lines.
- Press o to pin current object in
* Inspector *buffers. - Press u to unpin currently pinned objects.
- Press q to close the buffers.
* Stack dump * buffer
Contains stack dump information.
- Press SPC to jump to gdscript file where stack frame points to.
- Press RET to jump to the gdscript file and show
* Stack frame vars *,* Inspector *buffers, and a debug hydra. - Press l to display the
* Stack frame vars *buffer. - Press p to go to the previous line.
- Press n to go to the next line.
- Press q to close the buffer.
* Breakpoints * buffer
Lists all existing breakpoints in the project.
- Press SPC to enable or disable all breakpoints.
- Press RET to jump to the file and line corresponding to the breakpoint..
- Press TAB to display the
* Stack dump *buffer. - Press D to delete the breakpoint.
- Press q to close the buffer.
* Scene tree * buffer
Contains a tree visualisation of all objects in the running program.
- Press RET to open the corresponding object in the
* Inspector *buffer. - Press p to go to the previous line.
- Press n to go to the next line.
- Press q to close the buffer.


