All Projects → raphaelquast → EOmaps

raphaelquast / EOmaps

Licence: GPL-3.0 license
A library to create interactive maps of geographical datasets

Programming Languages

python
139335 projects - #7 most used programming language

Projects that are alternatives of or similar to EOmaps

GMT.jl
Generic Mapping Tools Library Wrapper for Julia
Stars: ✭ 148 (-23.32%)
Mutual labels:  mapping, geospatial, gis, plotting
earthengine-apps
A collection of Earth Engine Apps created using geemap, voila, and heroku
Stars: ✭ 20 (-89.64%)
Mutual labels:  mapping, geospatial, gis
Mapsui
Mapsui is a .NET Map component for WPF, Xamarin.Forms, Xamarin.Android, Xamarin.iOS and UWP
Stars: ✭ 447 (+131.61%)
Mutual labels:  mapping, geospatial, gis
eodag
Earth Observation Data Access Gateway
Stars: ✭ 183 (-5.18%)
Mutual labels:  geospatial, gis, earth-observation
Felicette
Satellite imagery for dummies.
Stars: ✭ 1,710 (+786.01%)
Mutual labels:  geospatial, gis, earth-observation
leafmap
A Python package for interactive mapping and geospatial analysis with minimal coding in a Jupyter environment
Stars: ✭ 1,299 (+573.06%)
Mutual labels:  mapping, geospatial, gis
actinia core
Actinia Core is an open source REST API for scalable, distributed, high performance processing of geographical data that uses mainly GRASS GIS for computational tasks (DOI: https://doi.org/10.5281/zenodo.5879231)
Stars: ✭ 41 (-78.76%)
Mutual labels:  geospatial, gis, earth-observation
Awesome Gee
A curated list of Google Earth Engine resources
Stars: ✭ 292 (+51.3%)
Mutual labels:  mapping, geospatial, gis
Geemap
A Python package for interactive mapping with Google Earth Engine, ipyleaflet, and folium
Stars: ✭ 959 (+396.89%)
Mutual labels:  mapping, geospatial, gis
Maps Api For Javascript Examples
Self-contained examples for Maps API for JavaScript v3.
Stars: ✭ 130 (-32.64%)
Mutual labels:  mapping, geospatial
Openrailwaymap
An OpenStreetMap-based project for creating a map of the world's railway infrastructure.
Stars: ✭ 150 (-22.28%)
Mutual labels:  mapping, geospatial
de9im
DE-9IM spatial predicate library implemented in Javascript.
Stars: ✭ 22 (-88.6%)
Mutual labels:  geospatial, gis
Kepler
The open source full-stack geosocial network platform
Stars: ✭ 125 (-35.23%)
Mutual labels:  mapping, geospatial
pygeopackage
A Python package to read/write spatial data to a geopackage.
Stars: ✭ 33 (-82.9%)
Mutual labels:  geospatial, gis
Simple Tiles
Simple tile generation for maps.
Stars: ✭ 106 (-45.08%)
Mutual labels:  mapping, gis
Contextily
Context geo-tiles in Python
Stars: ✭ 254 (+31.61%)
Mutual labels:  mapping, matplotlib
gis4wrf
QGIS toolkit 🧰 for pre- and post-processing 🔨, visualizing 🔍, and running simulations 💻 in the Weather Research and Forecasting (WRF) model 🌀
Stars: ✭ 137 (-29.02%)
Mutual labels:  gis, plotting
Gdl
GDL - GNU Data Language
Stars: ✭ 104 (-46.11%)
Mutual labels:  mapping, plotting
Azuremapscodesamples
A set of code samples for the Azure Maps web control.
Stars: ✭ 167 (-13.47%)
Mutual labels:  mapping, gis
Spatial-Analysis-Mapping-Projects
Project Documentation, Best Practices & Procedures for Spatial Analysis and Mapping Projects
Stars: ✭ 15 (-92.23%)
Mutual labels:  mapping, geospatial

EOmaps logo

tests codecov       pypi Conda Version       Documentation Status Buy Me A Coffee

DOI: 10.5281/zenodo.6459598


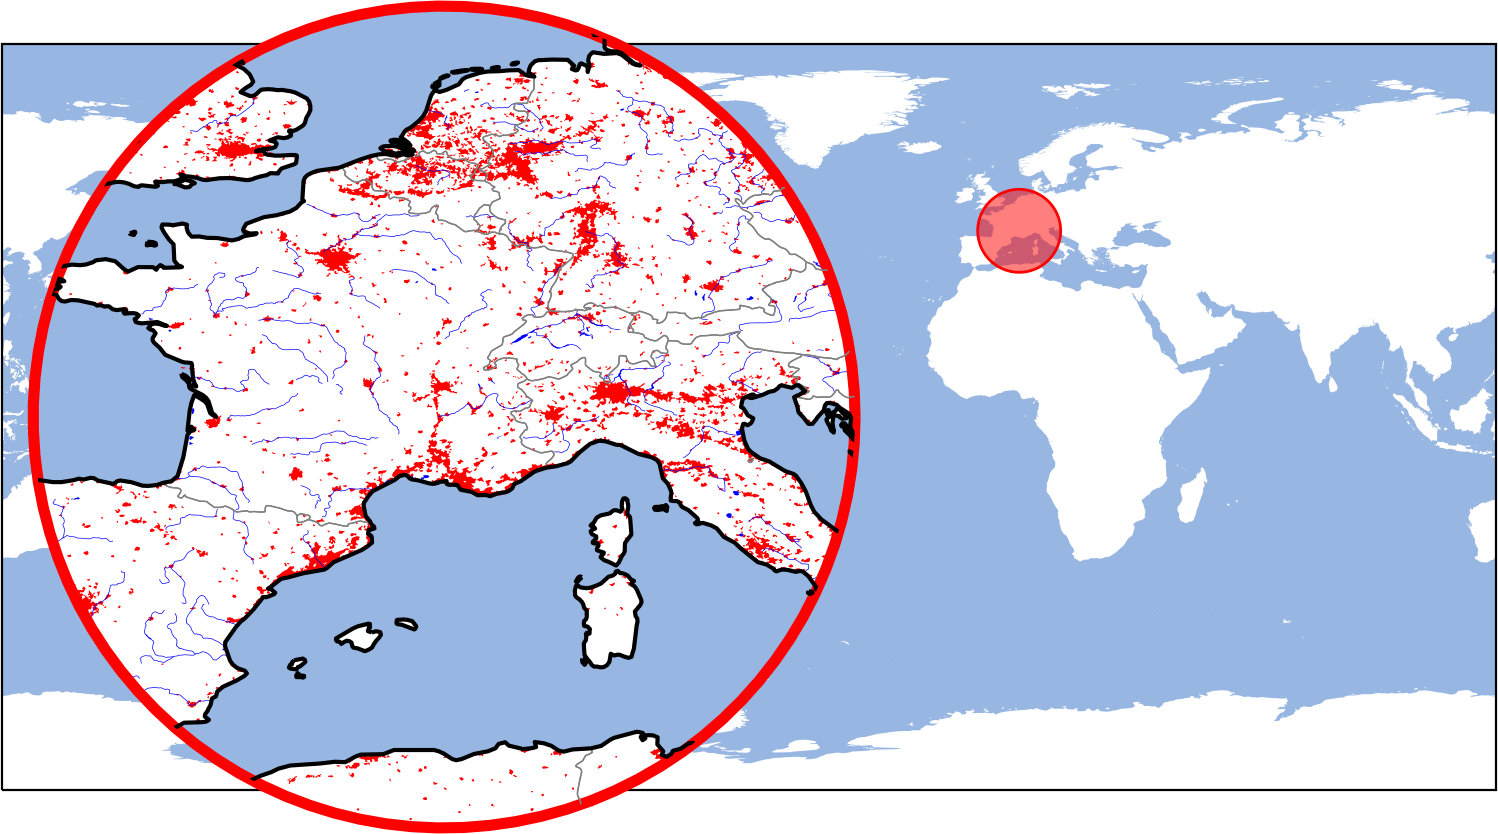
EOmaps - Interactive maps in python!

EOmaps is a Python package to visualize and analyze geographical datasets.

It is built on top of matplotlib and cartopy and aims to provide an intuitive and easy-to-use interface to handle the following tasks:

  • Speed up and simplify the creation and comparison of maps
  • Visualize small datasets as well as millions of datapoints
  • Handle 1D and 2D datasets and create plots from NetCDF, GeoTIFF or CSV files
  • Take care of re-projecting the data
  • Compare or overlay different plot-layers and WebMap services
  • Use the maps as interactive data-analysis widgets (e.g. execute functions if you click on the map)
  • Provide a versatile set of tools to customize the maps
  • Arrange multiple maps in one figure
  • Get a nice colorbar with a histogram on top
  • Export high resolution images

🔨 Installation

To install EOmaps (and all its dependencies) via the conda package-manager, simply use:

conda install -c conda-forge eomaps

... to get a huge speedup, use mamba to solve the dependencies!

conda install -c conda-forge mamba
mamba install -c conda-forge eomaps

For more information, have a look at the installation instructions or checkout the quickstart guide 🚀 from 0 to EOmaps!

📖 Documentation

Make sure to have a look at the 🌳 documentation 🌳 which provides a lot of examples on how to create awesome interactive maps (incl. 🐍 source code)!

✔️ Citation

Did EOmaps help in your research?
Consider supporting the development and add a citation to your publication!

https://doi.org/10.5281/zenodo.6459598

🚀 Contribute

Found a bug or got an idea for an interesting feature?
Open an issue or start a discussion, and I'll see what I can do!

Interested in actively contributing to the library?

  • Any contributions are welcome! (new features, enhancements, fixes, documentation updates, outreach etc.)
  • Have a look at this 🌟 overview project to get an overview of existing ideas that could use some help.
  • Get in touch by opening a discussion in the 🐜 Contribution section!

EOmaps example 6 EOmaps example 2
EOmaps example 9 EOmaps example 4
EOmaps example 7 EOmaps example 8
EOmaps inset-maps EOmaps example 3
EOmaps example 9 EOmaps example 4

🌳 Basic usage

Checkout the 🚀 Basics in the documentation!

from eomaps import Maps

# initialize Maps object
m = Maps(crs=Maps.CRS.Orthographic())

# add map-features from NaturalEarth
m.add_feature.preset.coastline()
m.add_feature.cultural_50m.admin_0_countries(fc="none", ec="g")

# assign a dataset
m.set_data(data=[1, 2, 3, 4], x=[45, 46, 47, 42], y=[23, 24, 25, 26], crs=4326)
# set the shape you want to use to represent the data-points
m.set_shape.geod_circles(radius=10000) # (e.g. geodetic circles with 10km radius)
# (optionally) classify the data
m.set_classify_specs(scheme=Maps.CLASSIFIERS.Quantiles, k=5)
# plot the data
m.plot_map(cmap="viridis", vmin=2, vmax=4)
# add a colorbar with a colored histogram on top
m.add_colorbar(histbins=200)

# add a scalebar
m.add_scalebar()
# add a compass (or north-arrow)
m.add_compass()

# add imagery from a open-access WebMap services
m.add_wms.OpenStreetMap.add_layer.default()

# use callback functions to interact with the map
m.cb.pick.attach.annotate()

# use multiple layers to compare and analyze different datasets
m3 = m.new_layer(layer="layer 2")
m3.add_feature.preset.ocean()

# attach a callback to peek on layer 1 if you click on the map
m.cb.click.attach.peek_layer(layer="layer 2", how=0.4)
# attach a callback to show an annotation while you move the mouse
# (and simultaneously press "a" on the keyboard)
m.cb.move.attach.annotate(modifier="a")
# attach callbacks to switch between the layers with the keyboard
m.cb.keypress.attach.switch_layer(layer=0, key="0")
m.cb.keypress.attach.switch_layer(layer="layer 2", key="1")

# get a clickable widget to switch between the available plot-layers
m.util.layer_selector()

# add zoomed-in "inset-maps" to highlight areas on th map
m_inset = m.new_inset_map((10, 45))
m_inset.add_feature.preset.coastline(fc="g")

# ---- plot data directly from GeoTIFF / NetCDF or CSV files
m4 = m.new_layer_from_file.GeoTIFF(...)
m4 = m.new_layer_from_file.NetCDF(...)
m4 = m.new_layer_from_file.CSV(...)

🌼 Thanks to

Note that the project description data, including the texts, logos, images, and/or trademarks, for each open source project belongs to its rightful owner. If you wish to add or remove any projects, please contact us at [email protected].