All Projects → flask-dashboard → Flask Monitoringdashboard

flask-dashboard / Flask Monitoringdashboard

Licence: mit
Automatically monitor the evolving performance of Flask/Python web services.

Programming Languages

python
139335 projects - #7 most used programming language

Projects that are alternatives of or similar to Flask Monitoringdashboard

Flask Profiler
a flask profiler which watches endpoint calls and tries to make some analysis.
Stars: ✭ 622 (+28.78%)
Mutual labels:  flask, monitoring, profiler, dashboard
Sensu Grid
A sensu dashboard built for the "big" screen...
Stars: ✭ 62 (-87.16%)
Mutual labels:  flask, dashboard
System dashboard
Boilerplate project - Cross-Platform System Dashboard using Flask, React, Mobx and Web-Workers
Stars: ✭ 13 (-97.31%)
Mutual labels:  flask, dashboard
Saas Base
SaaS base application (Flask, Vue, Bootstrap, Webpack)
Stars: ✭ 208 (-56.94%)
Mutual labels:  flask, dashboard
Open Source Saas Boilerpate
Free SaaS boilerplate (Python/PostgreSQL/ReactJS/Webpack)
Stars: ✭ 582 (+20.5%)
Mutual labels:  flask, dashboard
Bowtie
Create a dashboard with python!
Stars: ✭ 724 (+49.9%)
Mutual labels:  flask, dashboard
Ssis Dashboard
HTML5 SQL Server Integration Services Dashboard
Stars: ✭ 206 (-57.35%)
Mutual labels:  flask, dashboard
Kube Opex Analytics
🎨 Kubernetes Cost Allocation and Capacity Planning Analytics Tool. Hourly, daily, monthly reports - Prometheus exporter - Built-in & Grafana dashboard.
Stars: ✭ 232 (-51.97%)
Mutual labels:  monitoring, dashboard
Flask jsondash
🐍 📊 📈 Build complex dashboards without any front-end code. Use your own endpoints. JSON config only. Ready to go.
Stars: ✭ 3,215 (+565.63%)
Mutual labels:  flask, dashboard
Kubeview
Kubernetes cluster visualiser and graphical explorer
Stars: ✭ 335 (-30.64%)
Mutual labels:  monitoring, dashboard
Natsboard
Dashboard for monitoring NATS (an open source messaging system)
Stars: ✭ 339 (-29.81%)
Mutual labels:  monitoring, dashboard
Netdata
Real-time performance monitoring, done right! https://www.netdata.cloud
Stars: ✭ 57,056 (+11712.84%)
Mutual labels:  monitoring, dashboard
Beam Dashboards
BEAM ❤️ Prometheus ❤️ Grafana
Stars: ✭ 244 (-49.48%)
Mutual labels:  monitoring, dashboard
Smashing
The exceptionally handsome dashboard framework in Ruby and Coffeescript.
Stars: ✭ 2,765 (+472.46%)
Mutual labels:  monitoring, dashboard
Ceph Dash
Flask based api / dashboard for viewing a ceph clusters overall health status
Stars: ✭ 398 (-17.6%)
Mutual labels:  monitoring, dashboard
Bugsnag Python
Official bugsnag error monitoring and error reporting for django, flask, tornado and other python apps.
Stars: ✭ 69 (-85.71%)
Mutual labels:  flask, monitoring
Temboard
PostgreSQL Remote Control
Stars: ✭ 218 (-54.87%)
Mutual labels:  monitoring, dashboard
Grafana Dashboards
Grafana Dashboards
Stars: ✭ 228 (-52.8%)
Mutual labels:  monitoring, dashboard
Stackimpact Go
DEPRECATED StackImpact Go Profiler - Production-Grade Performance Profiler: CPU, memory allocations, blocking calls, errors, metrics, and more
Stars: ✭ 276 (-42.86%)
Mutual labels:  monitoring, profiler
Vudash
Powerful, Flexible, Open Source dashboards for anything
Stars: ✭ 363 (-24.84%)
Mutual labels:  monitoring, dashboard


Flask Monitoring Dashboard

A dashboard for automatic monitoring of Flask web-services.

Build Status Documentation Status codecov PyPI version Py-version Downloads Tweet

Key FeaturesHow to useLive DemoFeedbackDocumentationScreenshotsLicense

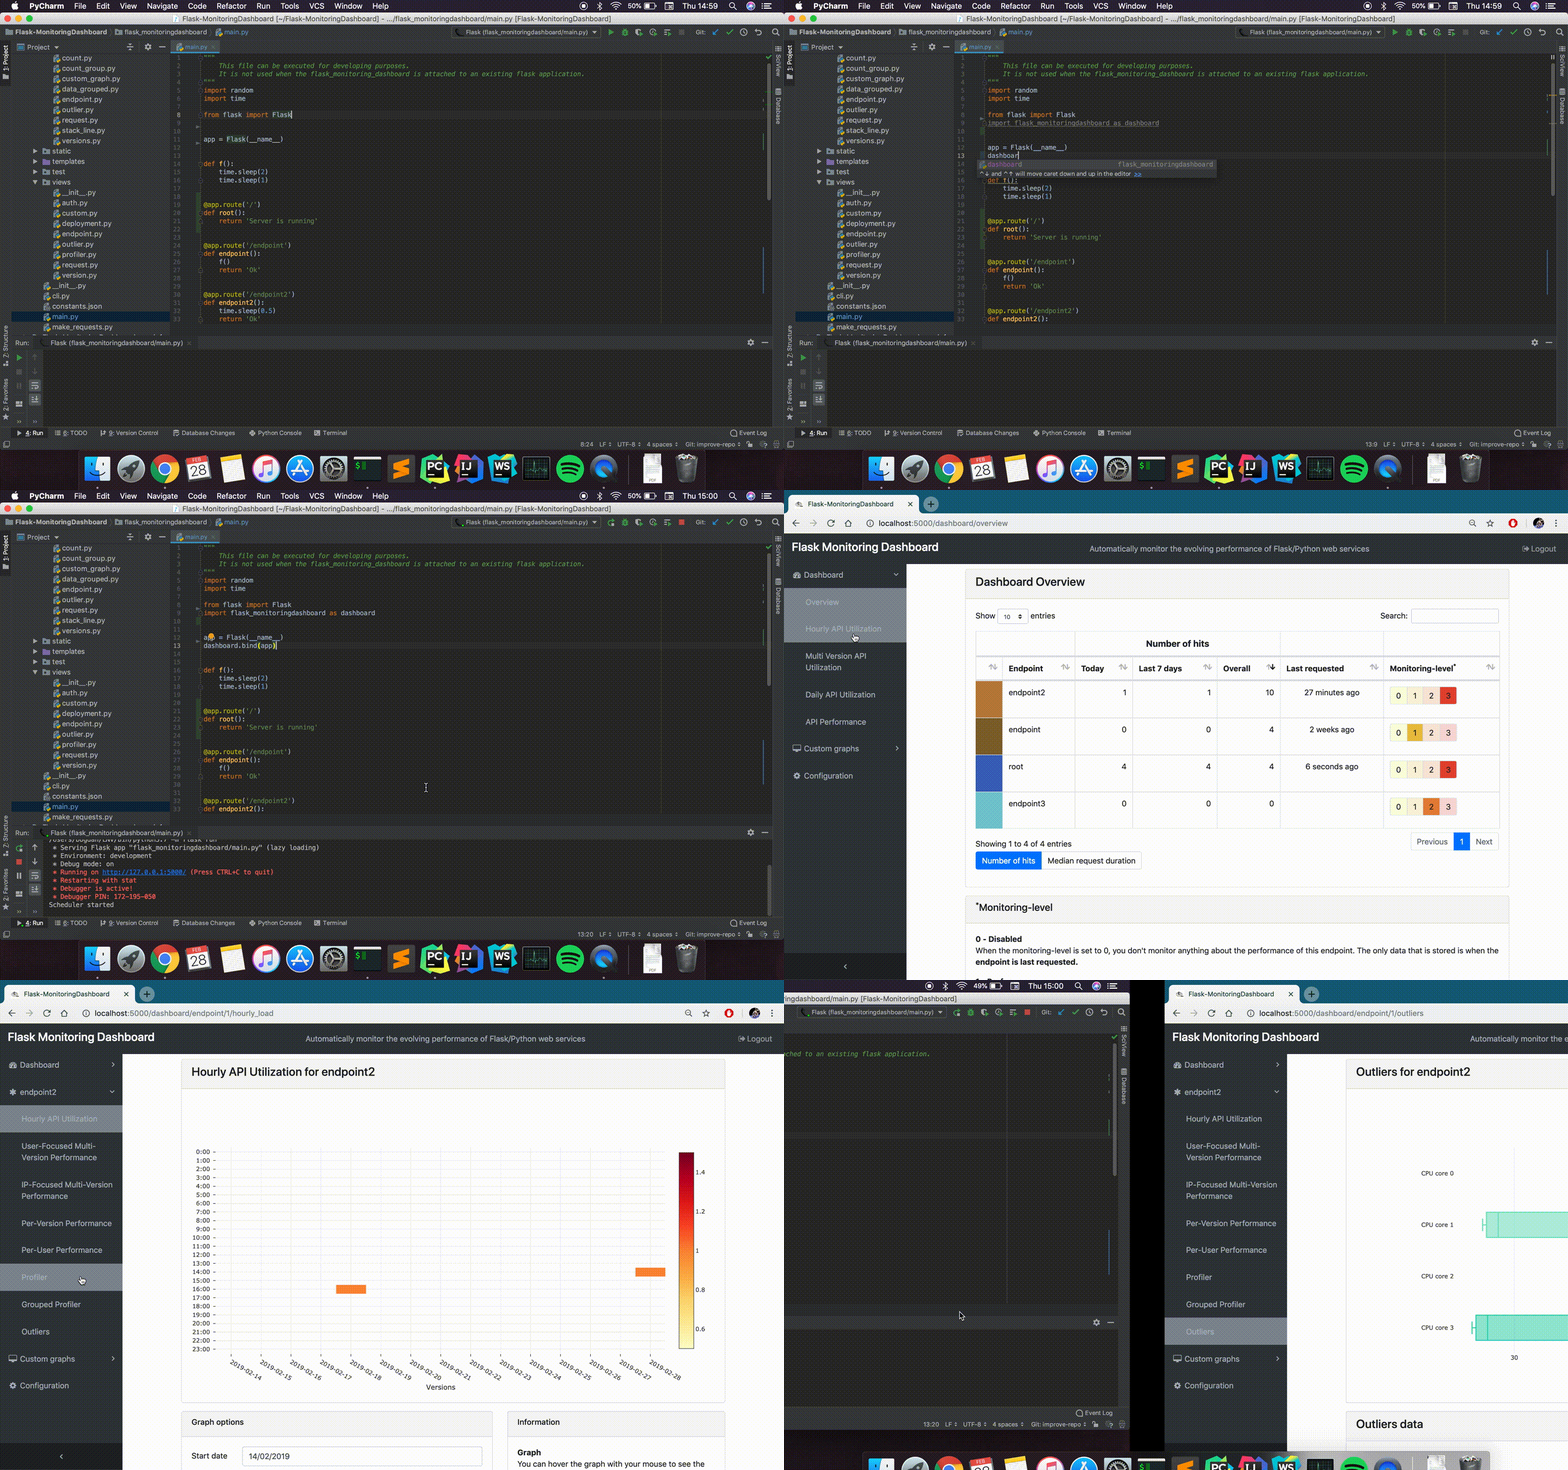
gif

Key Features

The Flask Monitoring Dashboard is an extension for Flask applications that offers four main functionalities with little effort from the Flask developer:

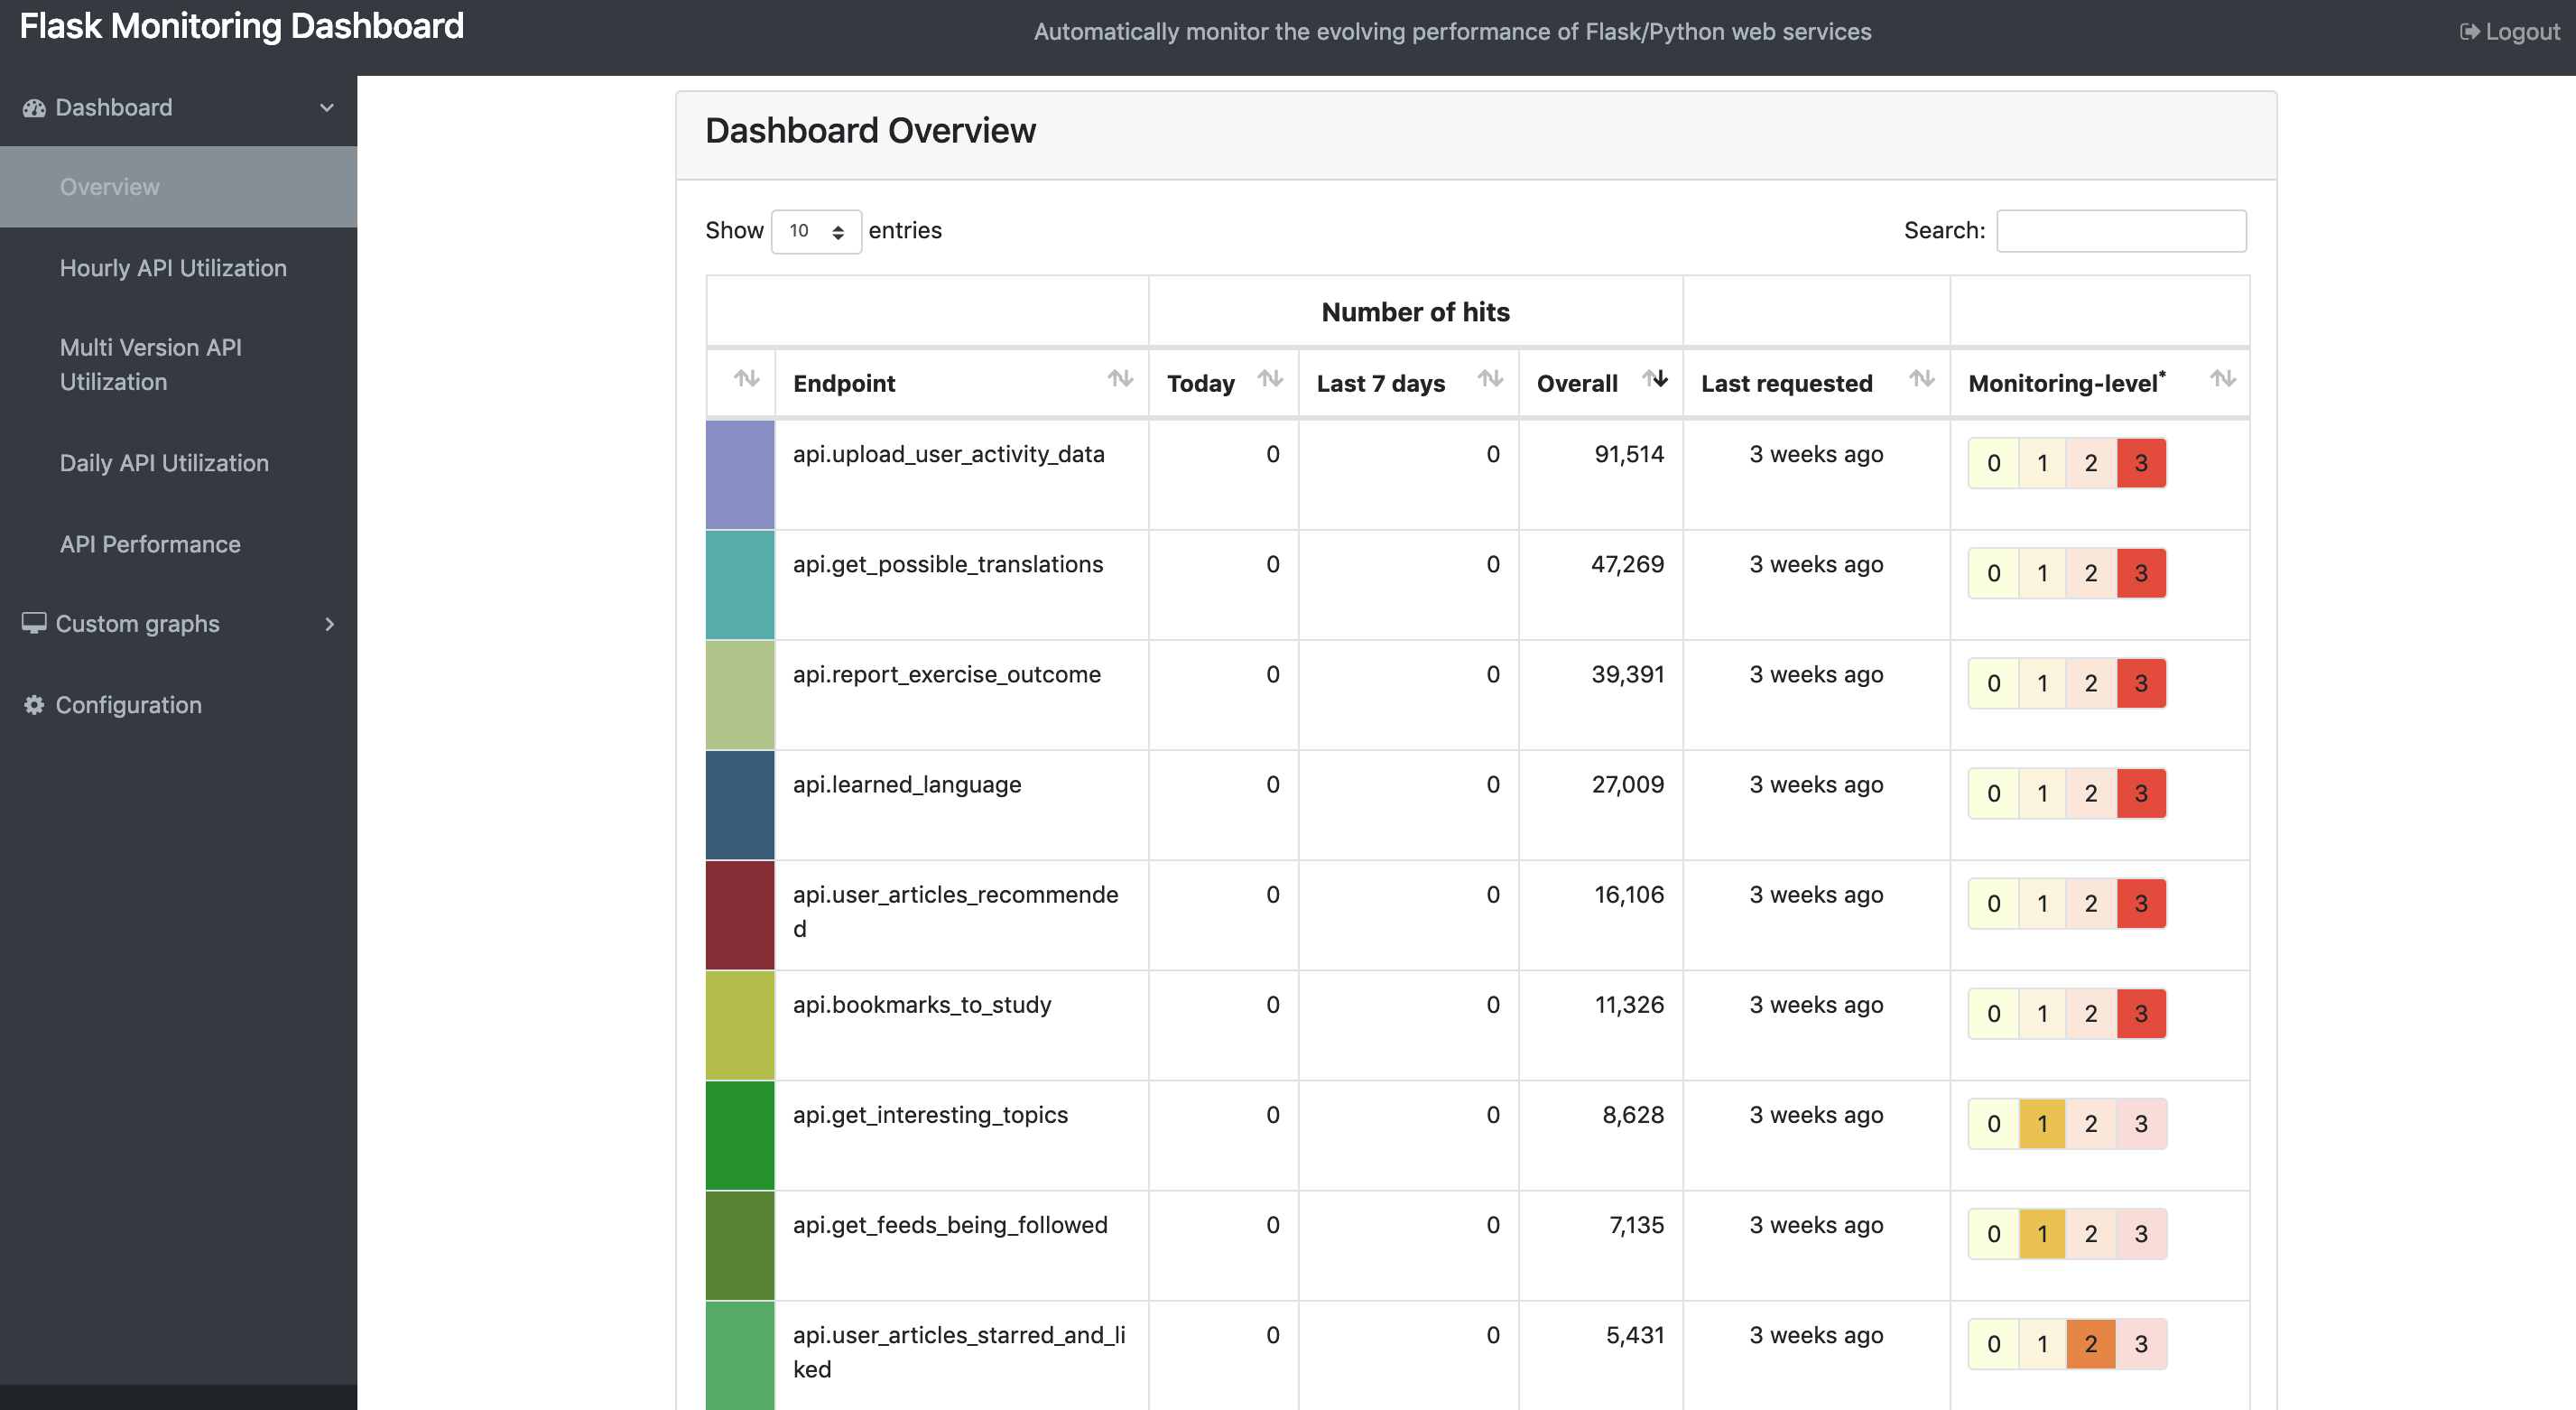
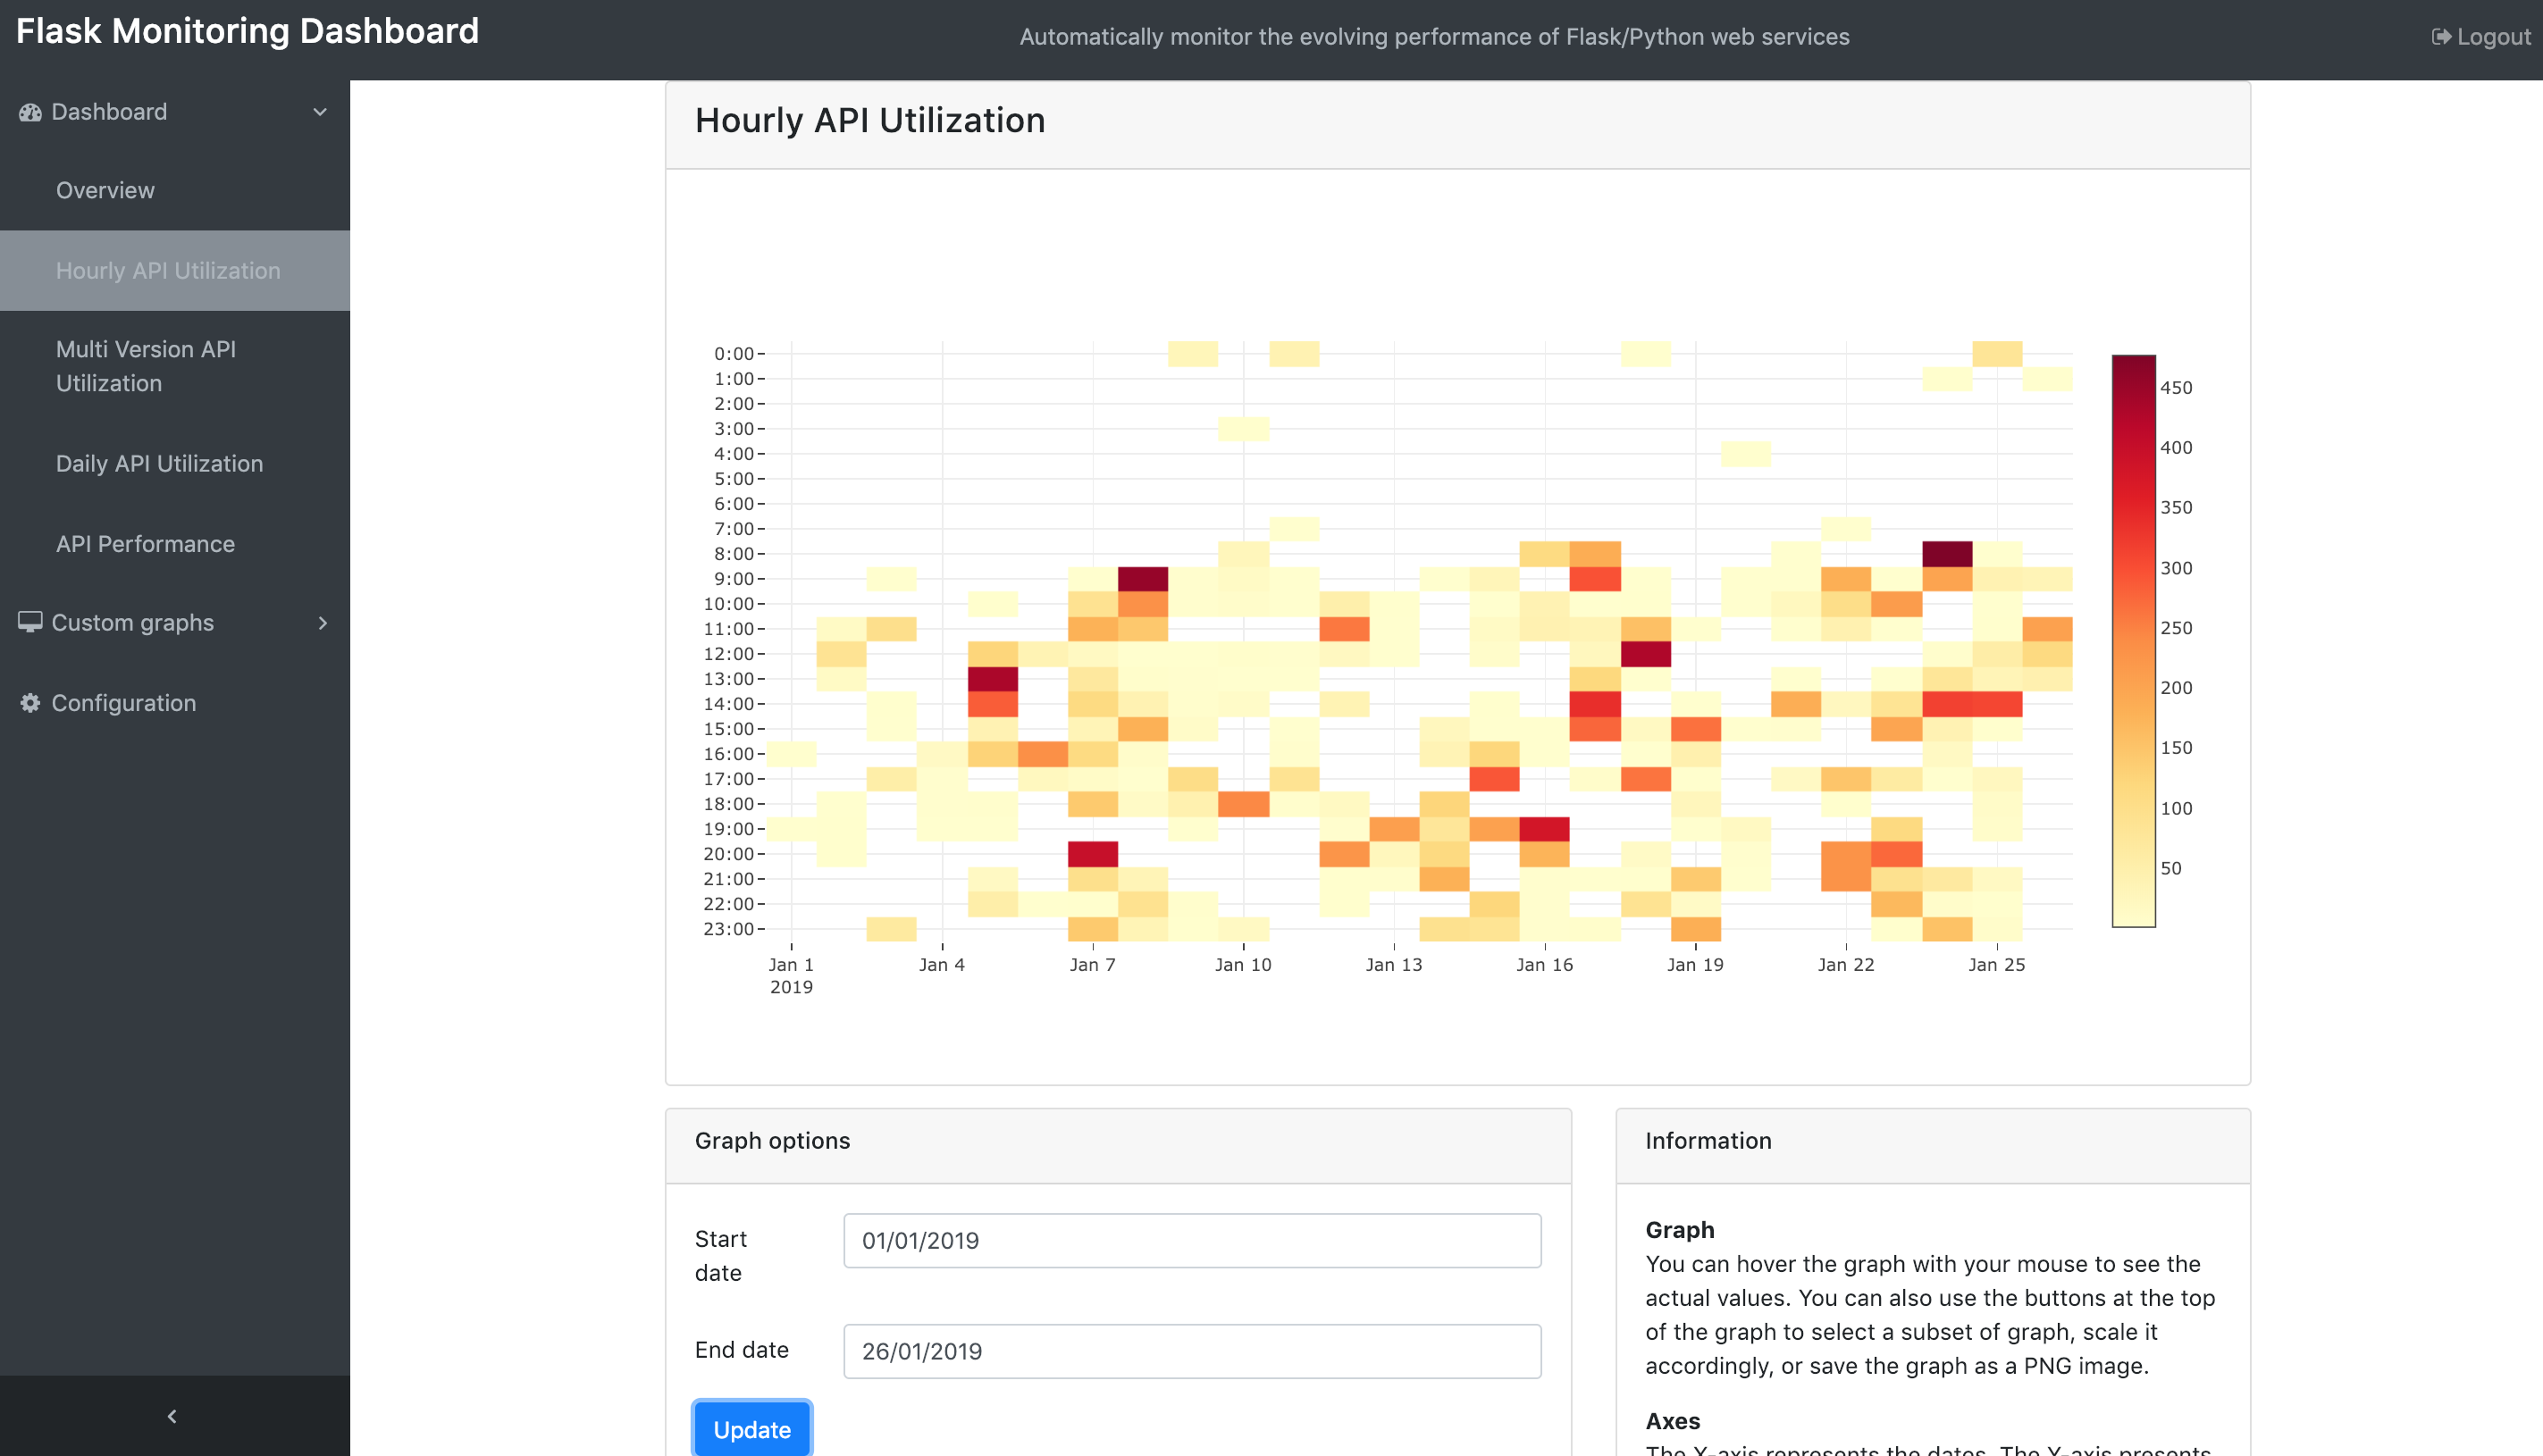
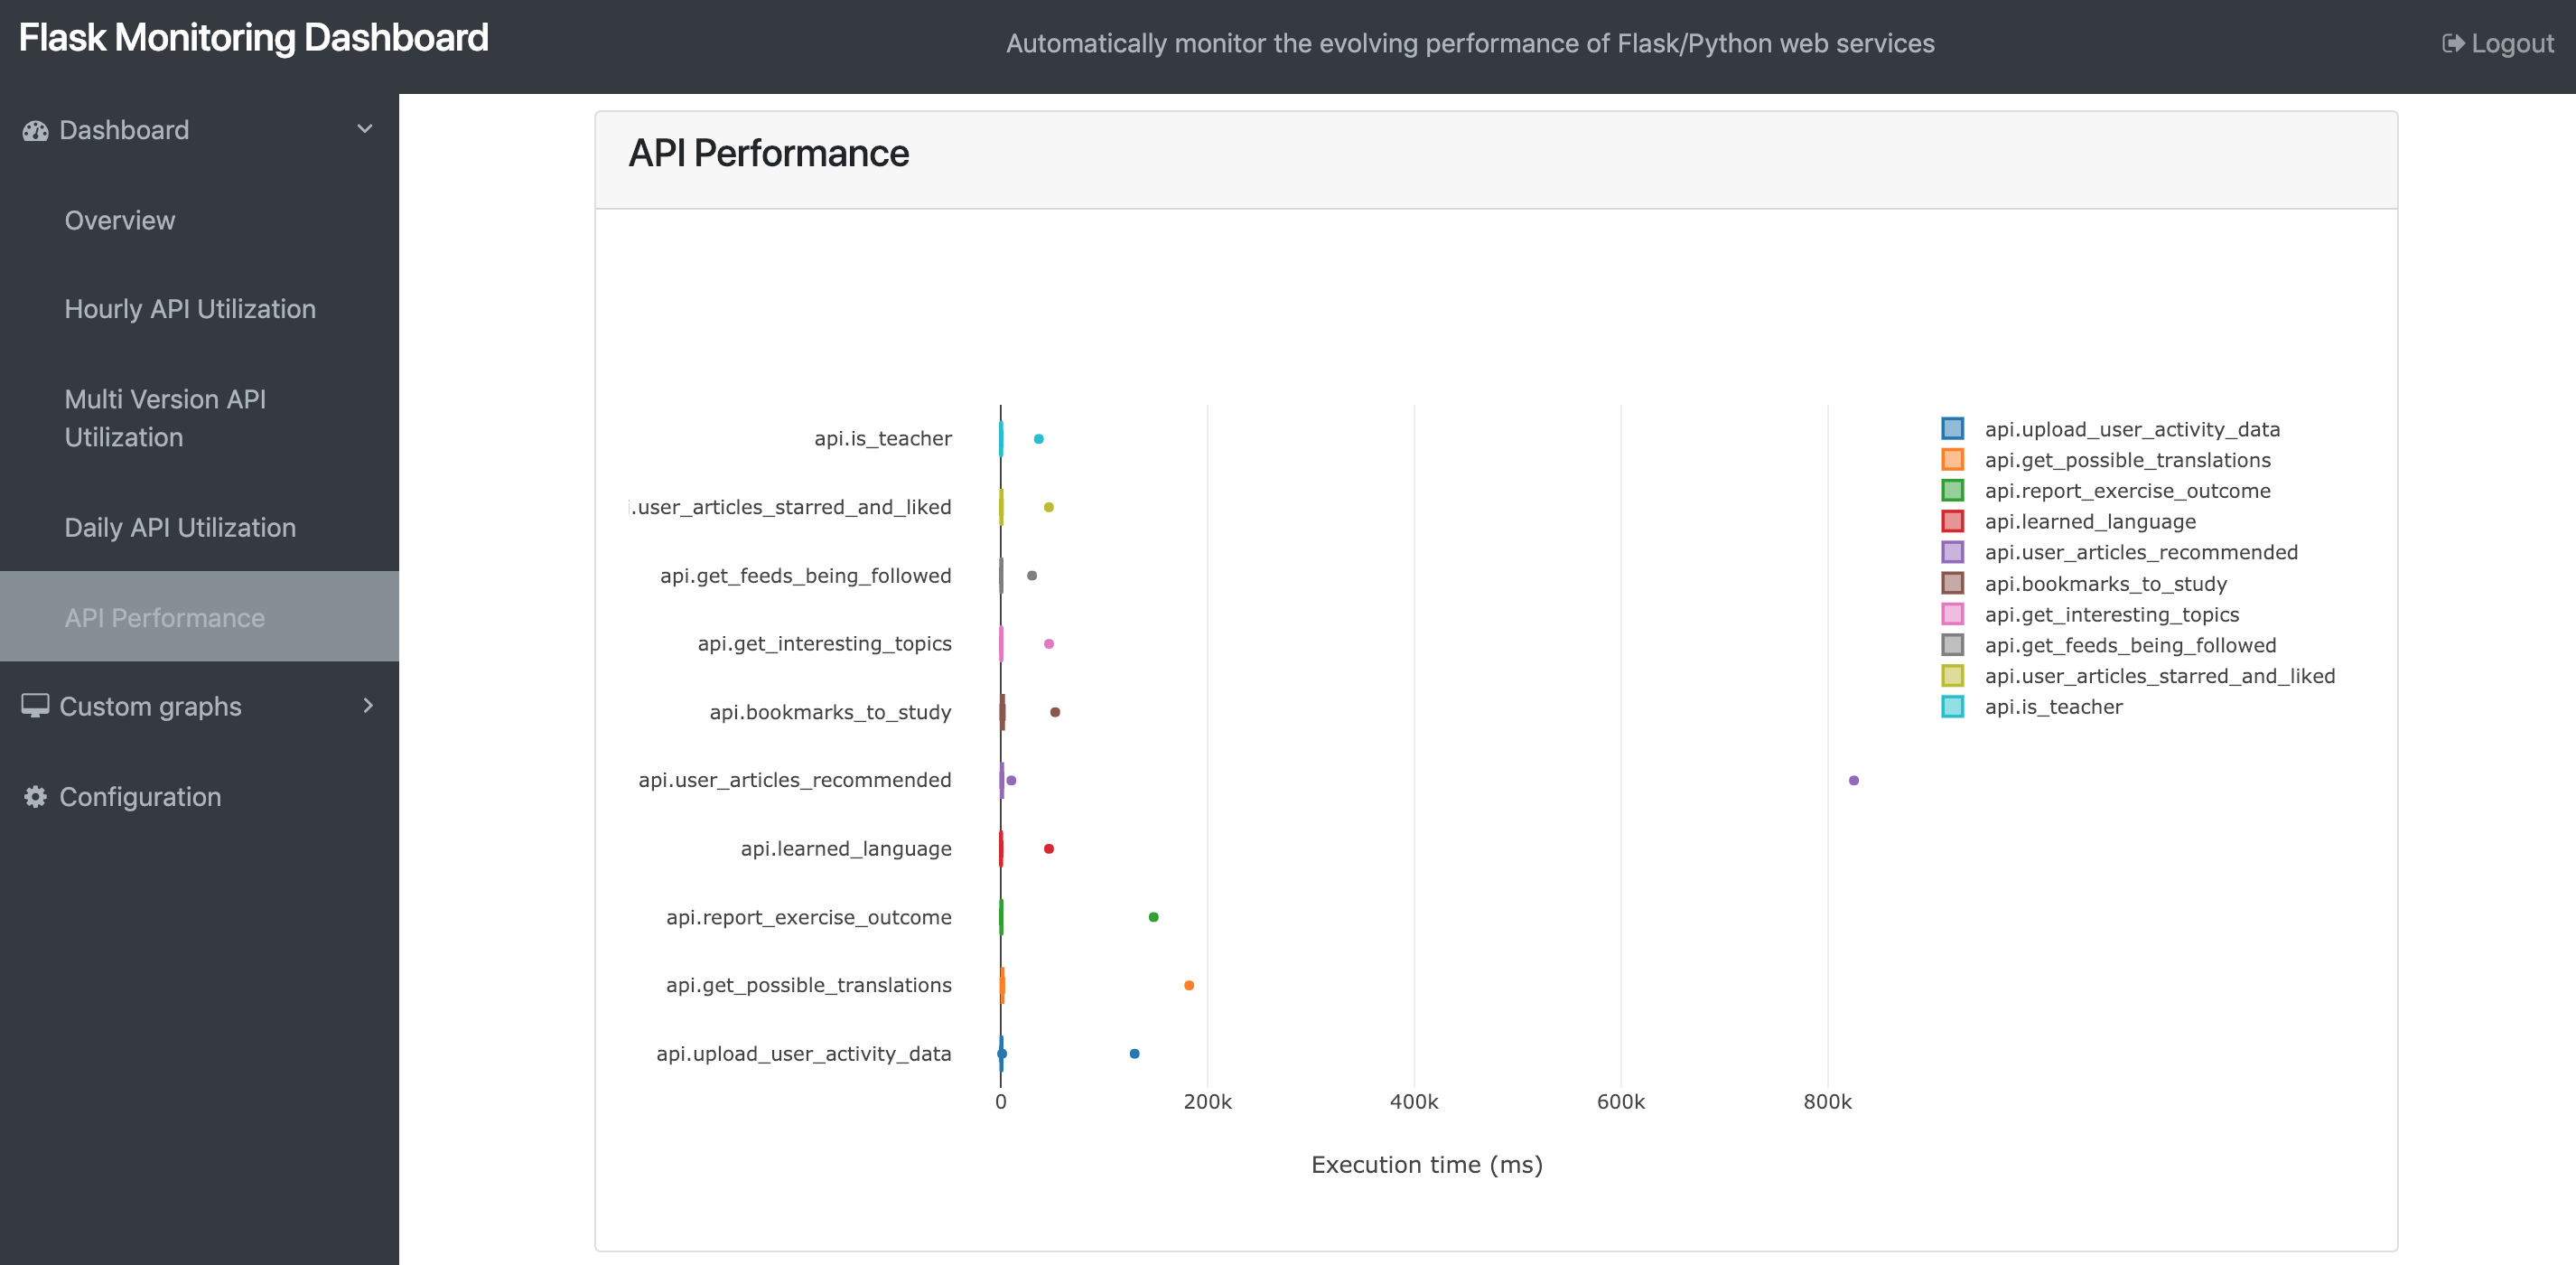
  • Monitor the performance and utilization: The Dashboard allows you to see which endpoints process a lot of requests and how fast. Additionally, it provides information about the evolving performance of an endpoint throughout different versions if you're using git.

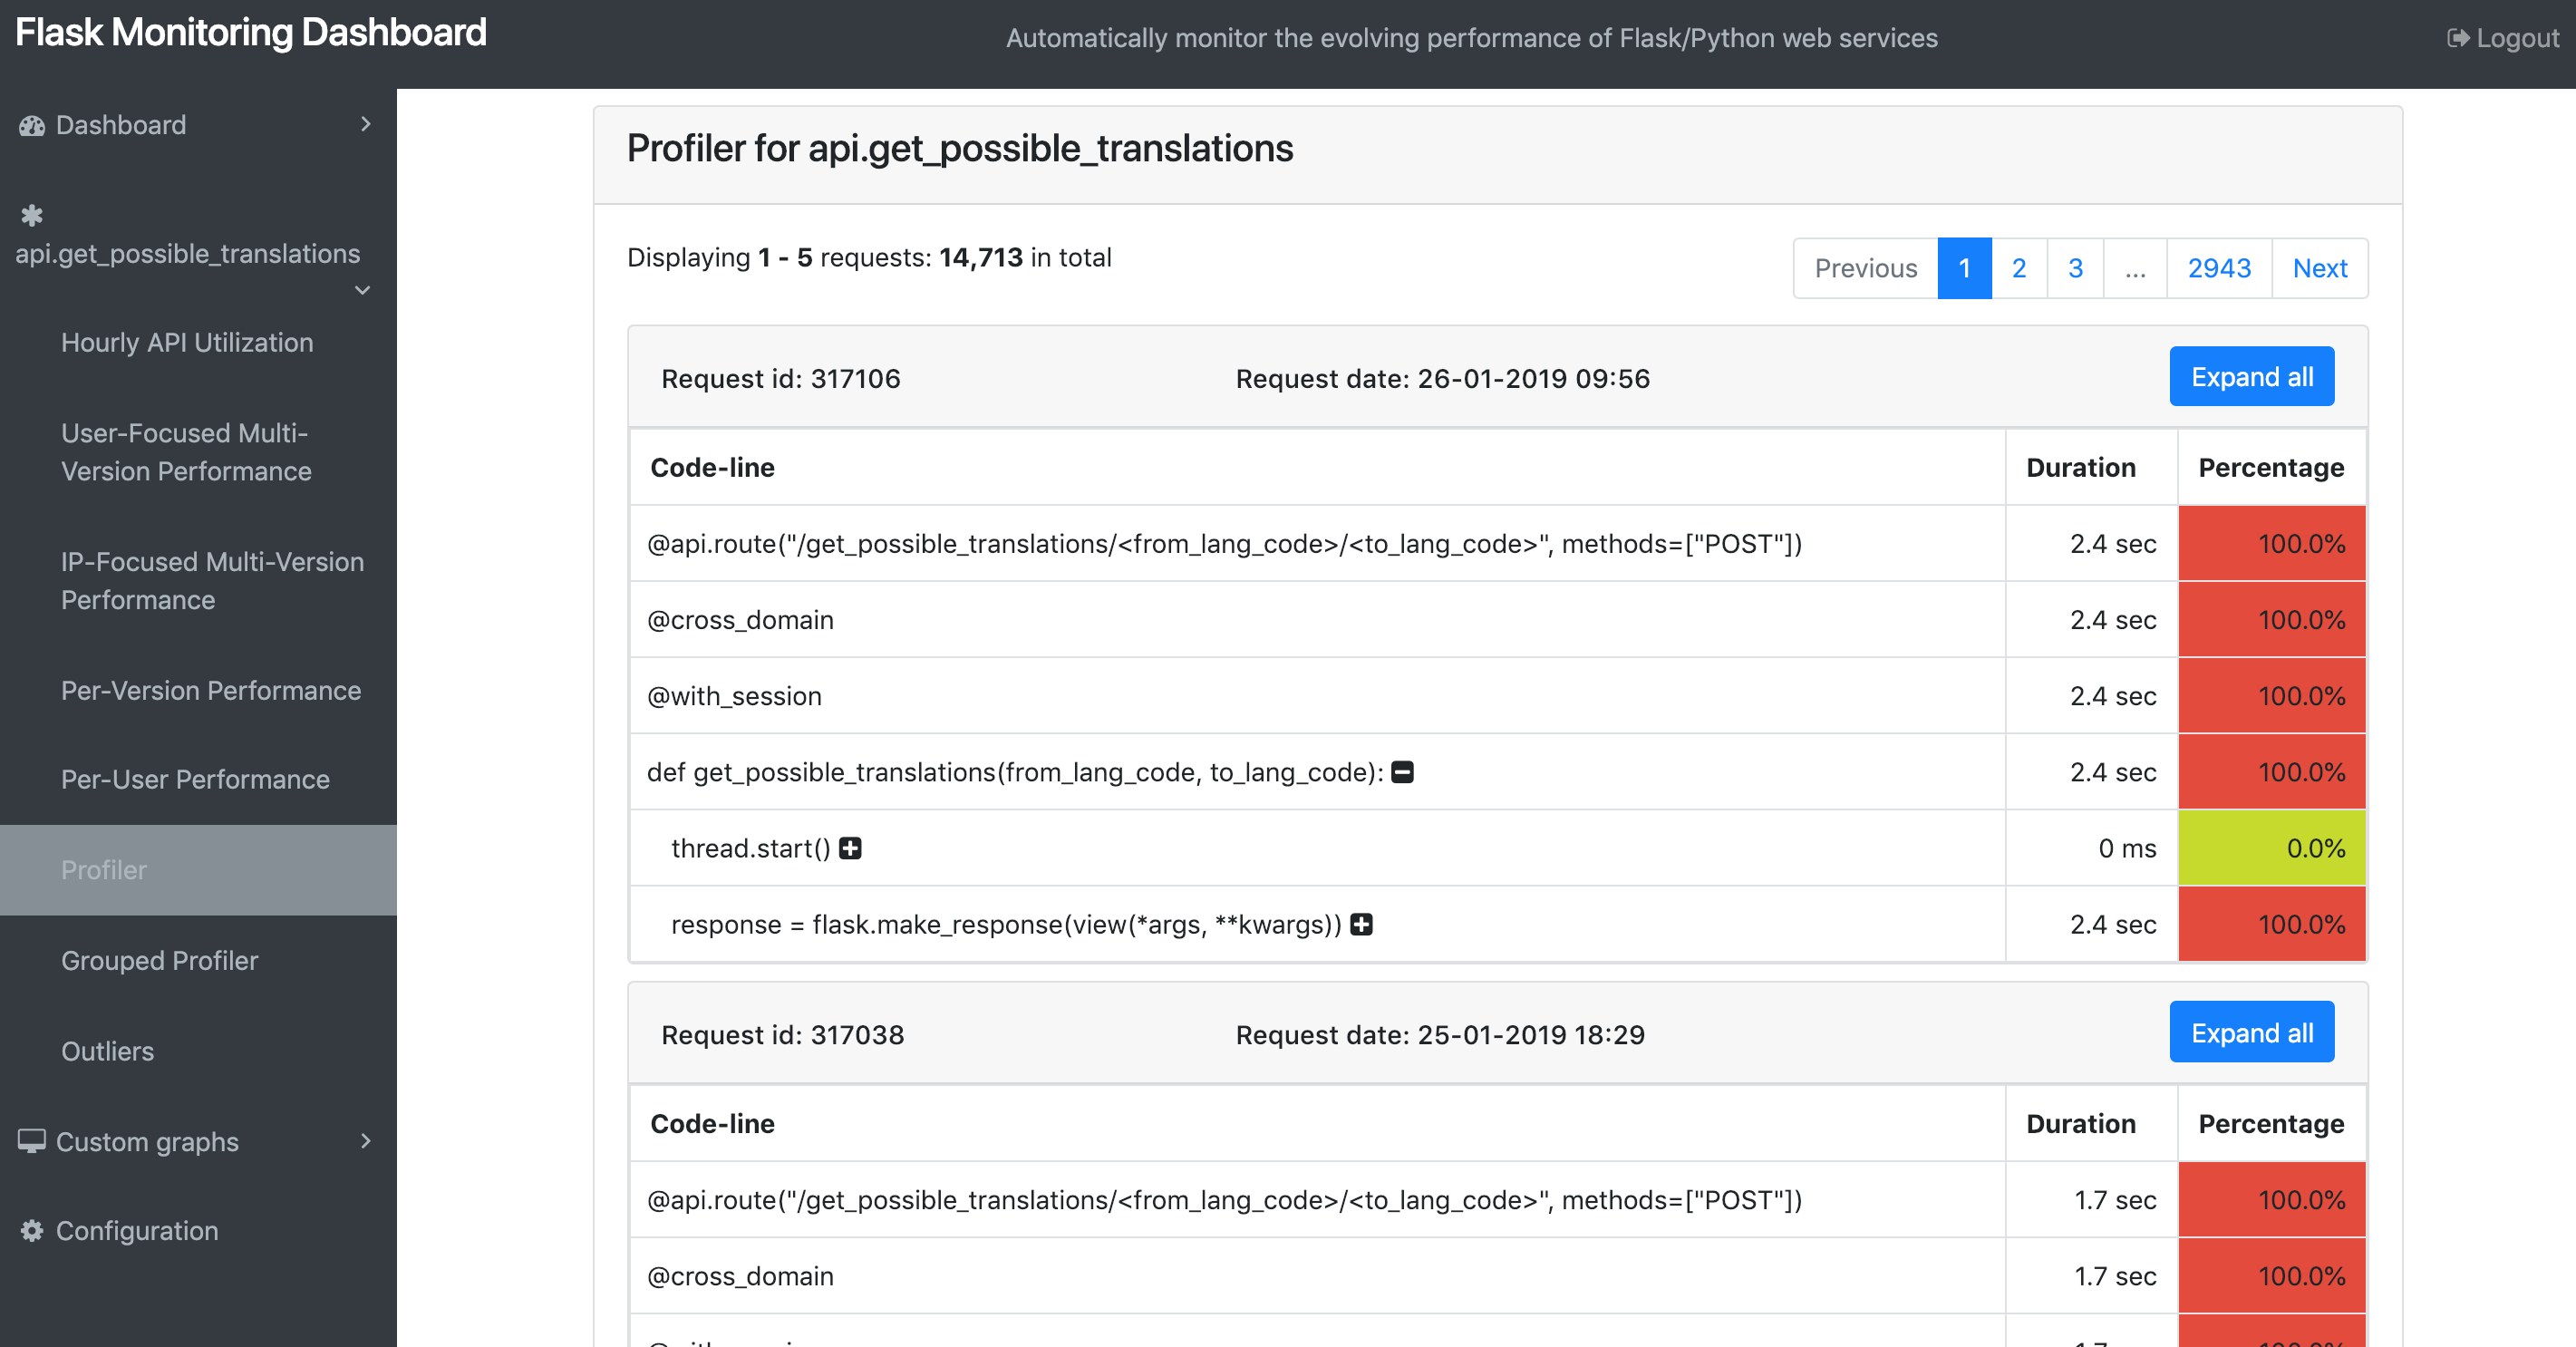
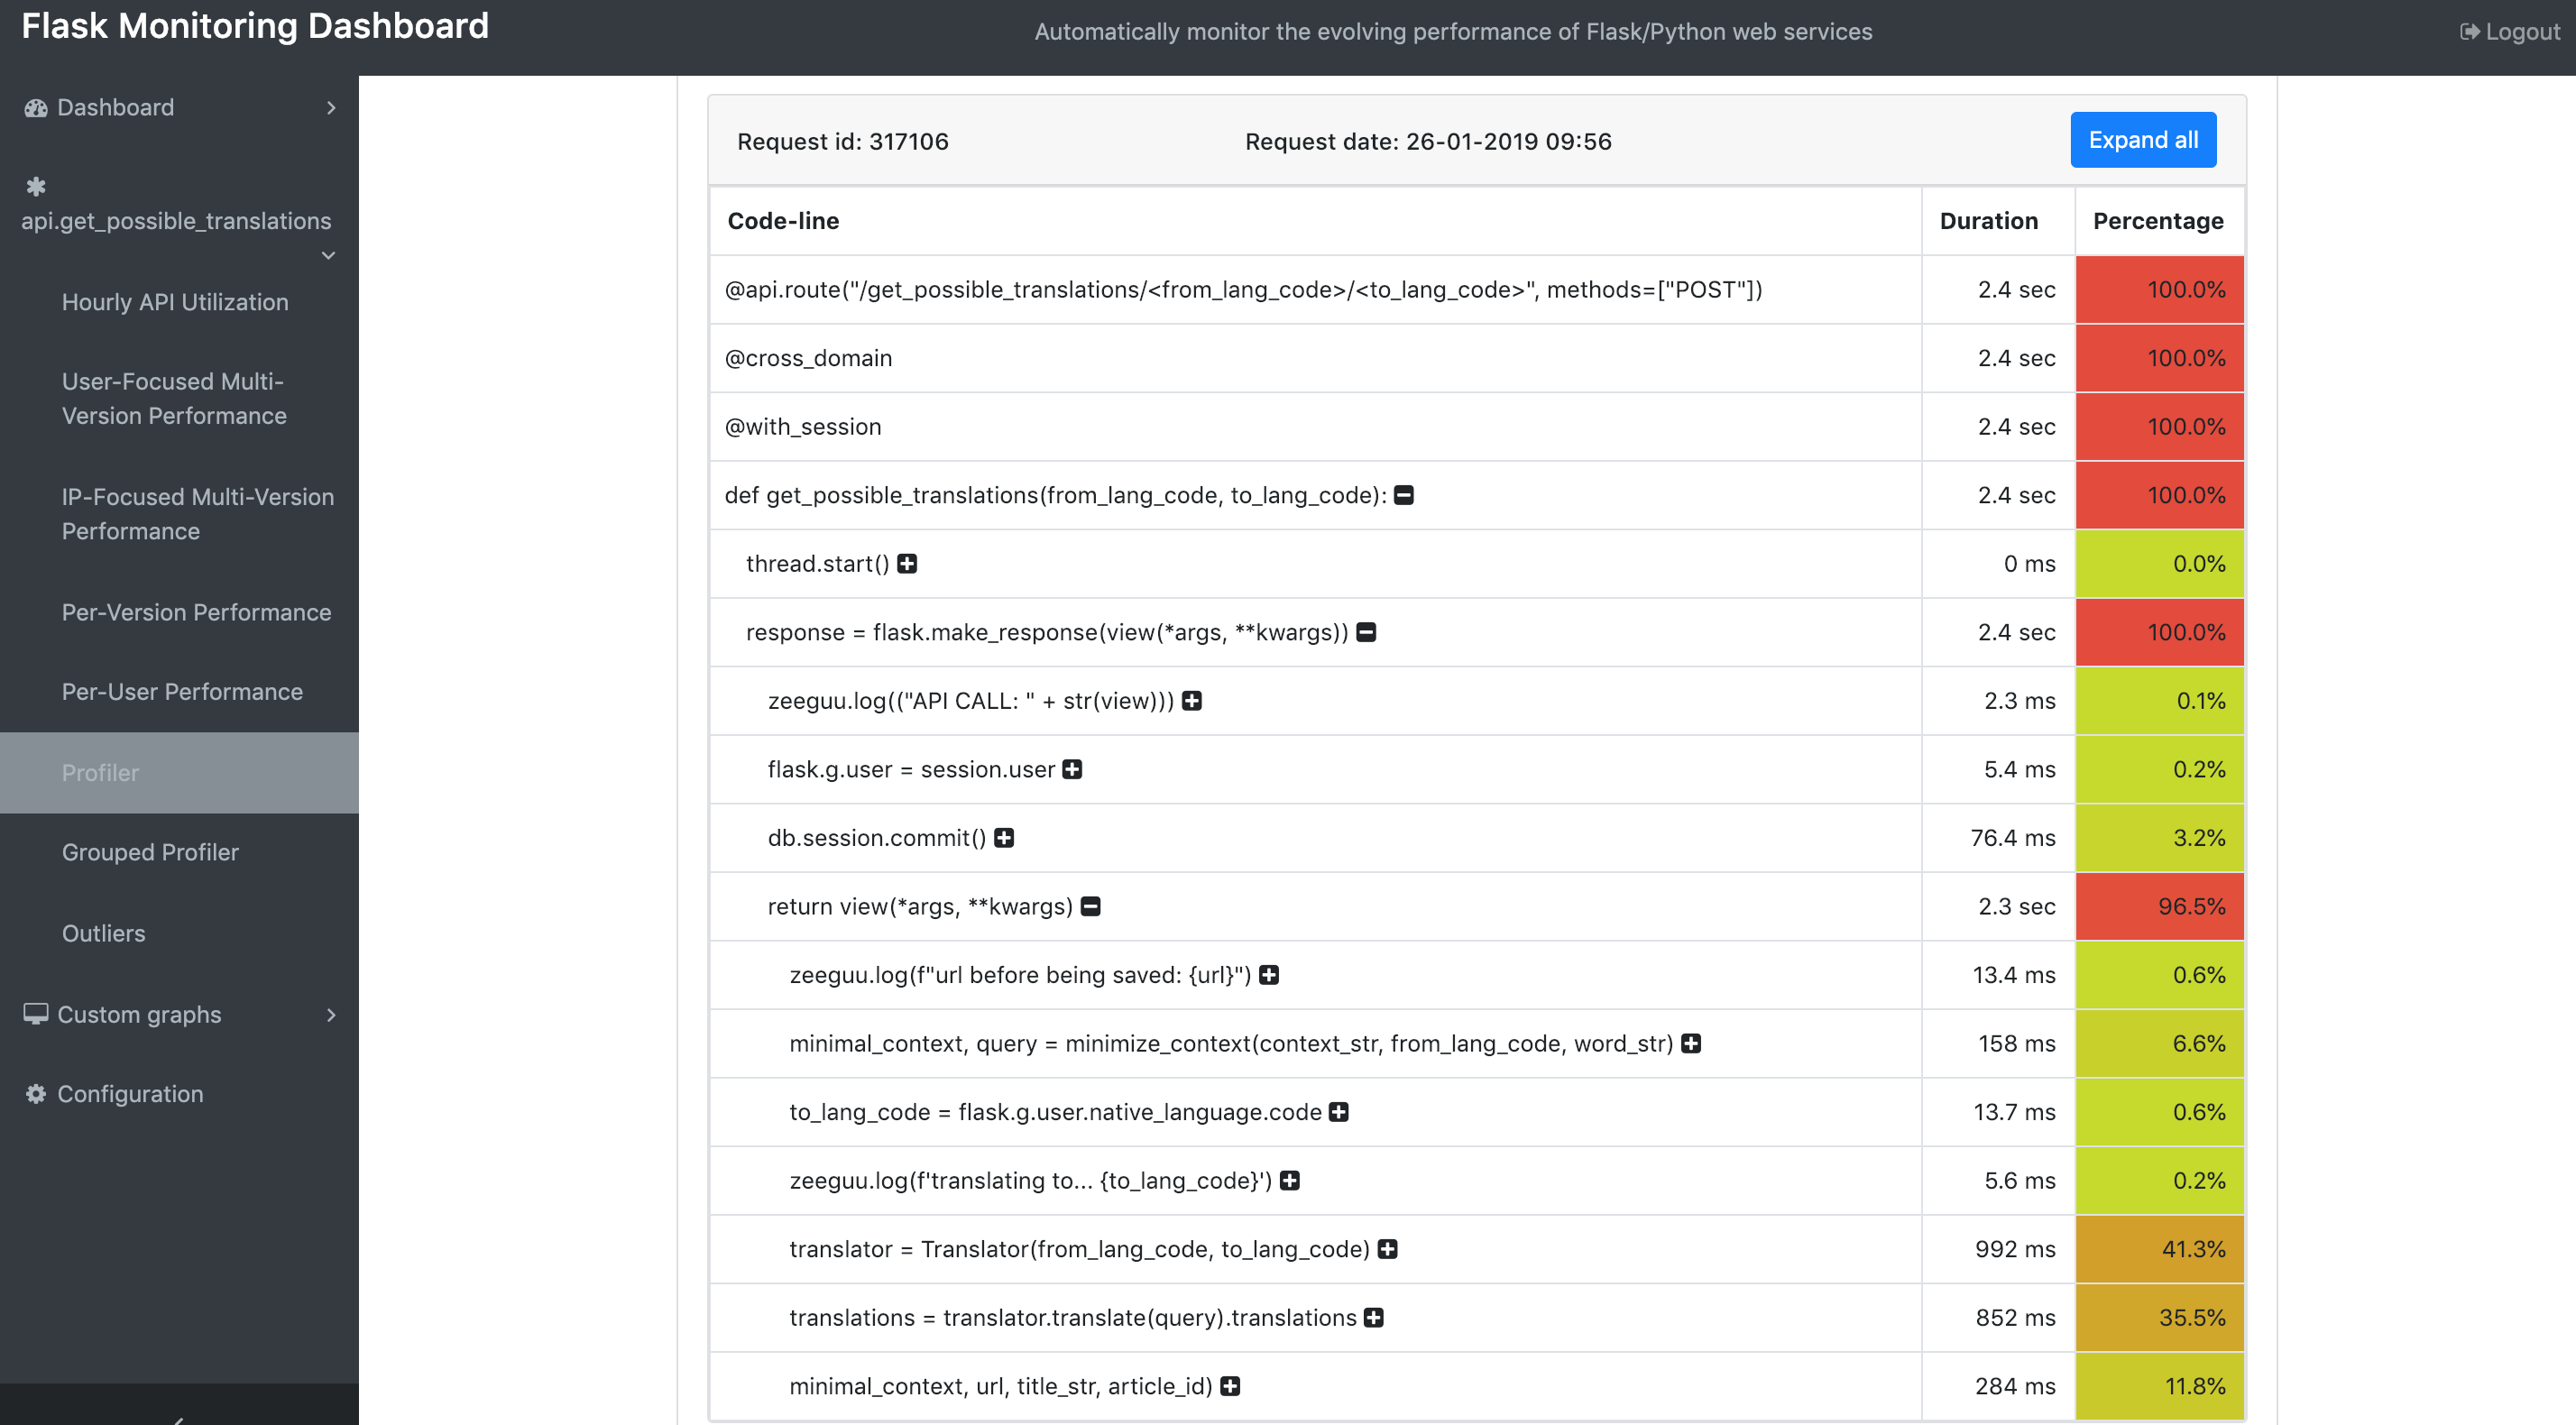
  • Profile requests and endpoints: The execution path of every request is tracked and stored into the database. This allows you to gain insight over which functions in your code take the most time to execute. Since all requests for an endpoint are also merged together, the Dashboard provides an overview of which functions are used in which endpoint.

  • Collect extra information about outliers: Outliers are requests that take much longer to process than regular requests. The Dashboard automatically detects that a request is an outlier and stores extra information about it (stack trace, request values, Request headers, Request environment).

  • Collect additional information about your Flask-application: Suppose you have an User-table and you want to know how many users are registered on your Flask-application. Then, you can run the following query: 'SELECT Count(*) FROM USERS;'. But this is just annoying to do regularly. Therefore, you can configure this in the Flask-MonitoringDashboard, which will provide you this information per day (or other time interval).

The dashboard is automatically added to your existing Flask application. You can view the results by default using the default endpoint (this can be configured to another route):

/dashboard

For more advanced documentation, take a look at the information on this site.

How to use

Installation

To install from source, download the source code, then run this:

python setup.py install

Or install with pip:

pip install flask_monitoringdashboard

Setup

Adding the extension to your Flask app is simple:

from flask import Flask
import flask_monitoringdashboard as dashboard

app = Flask(__name__)
dashboard.bind(app)

Live Demo

To view a live deployment of the Flask-MonitoringDashboard, check this site. Use the credentials u:admin, p:admin to log in.

Feedback

In order to improve our Flask-MonitoringDashboard, we would like to hear from you! Therefore, we made a questionnaire with a few questions. Filling in this form takes less than 3 minutes. You can find the form here.

Alternatively, feel free to write to our email-address.

Documentation

For more advanced documentation, see this site. If you run into trouble migrating from version 1.X.X to version 2.0.0, this site will help you solve this too.

Screenshots

Screenshot 1 Screenshot 2 Screenshot 3 Screenshot 4 Screenshot 5

Development

If you like our project, and willing to contribute, you can get started by cloning it and then running the following command:

. ./config/install.sh

For more information, check this page.

License

This project is licensed under the MIT License - see the LICENSE file for details.

Note that the project description data, including the texts, logos, images, and/or trademarks, for each open source project belongs to its rightful owner. If you wish to add or remove any projects, please contact us at [email protected].