tidyverse / Forcats
Programming Languages
Labels
Projects that are alternatives of or similar to Forcats
forcats 
![]()
![]()
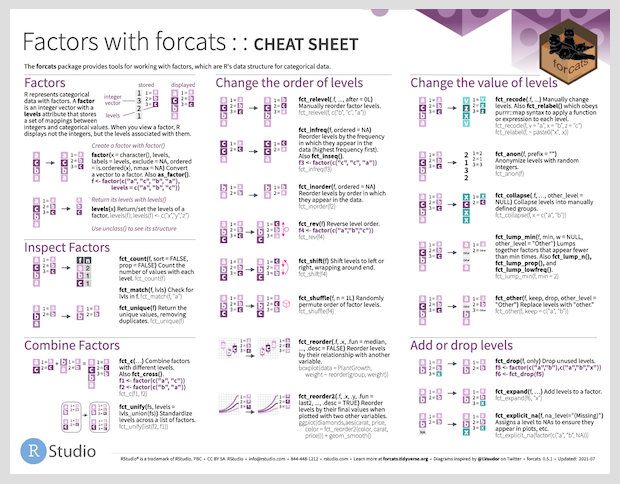
Overview
R uses factors to handle categorical variables, variables that have a fixed and known set of possible values. Factors are also helpful for reordering character vectors to improve display. The goal of the forcats package is to provide a suite of tools that solve common problems with factors, including changing the order of levels or the values. Some examples include:
-
fct_reorder(): Reordering a factor by another variable. -
fct_infreq(): Reordering a factor by the frequency of values. -
fct_relevel(): Changing the order of a factor by hand. -
fct_lump(): Collapsing the least/most frequent values of a factor into “other”.
You can learn more about each of these in vignette("forcats"). If
you’re new to factors, the best place to start is the chapter on
factors in R for Data Science.
Installation
# The easiest way to get forcats is to install the whole tidyverse:
install.packages("tidyverse")

# Alternatively, install just forcats:
install.packages("forcats")

# Or the the development version from GitHub:
# install.packages("devtools")
devtools::install_github("tidyverse/forcats")
Cheatsheet
Getting started
forcats is part of the core tidyverse, so you can load it with
library(tidyverse) or library(forcats).
library(forcats)
library(dplyr)
library(ggplot2)
starwars %>%
  filter(!is.na(species)) %>%
  count(species, sort = TRUE)
#> # A tibble: 37 x 2
#>    species      n
#>    <chr>    <int>
#>  1 Human       35
#>  2 Droid        6
#>  3 Gungan       3
#>  4 Kaminoan     2
#>  5 Mirialan     2
#>  6 Twi'lek      2
#>  7 Wookiee      2
#>  8 Zabrak       2
#>  9 Aleena       1
#> 10 Besalisk     1
#> # … with 27 more rows
starwars %>%
  filter(!is.na(species)) %>%
  mutate(species = fct_lump(species, n = 3)) %>%
  count(species)
#> # A tibble: 4 x 2
#>   species     n
#> * <fct>   <int>
#> 1 Droid       6
#> 2 Gungan      3
#> 3 Human      35
#> 4 Other      39
ggplot(starwars, aes(x = eye_color)) +
  geom_bar() +
  coord_flip()

starwars %>%
  mutate(eye_color = fct_infreq(eye_color)) %>%
  ggplot(aes(x = eye_color)) +
  geom_bar() +
  coord_flip()

More resources
For a history of factors, I recommend stringsAsFactors: An unauthorized biography by Roger Peng and stringsAsFactors = <sigh> by Thomas Lumley. If you want to learn more about other approaches to working with factors and categorical data, I recommend Wrangling categorical data in R, by Amelia McNamara and Nicholas Horton.
Getting help
If you encounter a clear bug, please file a minimal reproducible example on github. For questions and other discussion, please use community.rstudio.com.
Code of Conduct
Please note that the ‘forcats’ project is released with a Contributor Code of Conduct. By contributing to this project, you agree to abide by its terms.