malcolmbarrett / Ggdag
Licence: other
↙️ ↘️ An R package for working with causal directed acyclic graphs (DAGs)
Stars: ✭ 317
Programming Languages
r
7636 projects
Projects that are alternatives of or similar to Ggdag
Ggalt
🌎 Extra Coordinate Systems, Geoms, Statistical Transformations & Scales for 'ggplot2'
Stars: ✭ 561 (+76.97%)
Mutual labels: ggplot-extension, rstats
Hrbrthemes
🔏 Opinionated, typographic-centric ggplot2 themes and theme components
Stars: ✭ 899 (+183.6%)
Mutual labels: ggplot-extension, rstats
Ggsignif
Easily add significance brackets to your ggplots
Stars: ✭ 322 (+1.58%)
Mutual labels: ggplot-extension, rstats
Ggcats
The geom you always wished for adding cats to ggplot2
Stars: ✭ 34 (-89.27%)
Mutual labels: ggplot-extension, rstats
Gganimate
A Grammar of Animated Graphics
Stars: ✭ 1,744 (+450.16%)
Mutual labels: ggplot-extension, rstats
Econocharts
Microeconomics/macroeconomics charts in ggplot2
Stars: ✭ 161 (-49.21%)
Mutual labels: ggplot-extension, rstats
Ggbernie
A ggplot2 geom for adding Bernie Sanders to ggplot2
Stars: ✭ 96 (-69.72%)
Mutual labels: ggplot-extension, rstats
Ggpointdensity
📈 📊 Introduces geom_pointdensity(): A Cross Between a Scatter Plot and a 2D Density Plot.
Stars: ✭ 286 (-9.78%)
Mutual labels: ggplot-extension, rstats
Calendr
Ready to print calendars with ggplot2
Stars: ✭ 161 (-49.21%)
Mutual labels: ggplot-extension, rstats
Slackr
#️⃣ A package to send webhook API messages to Slack.com channels/users from R
Stars: ✭ 269 (-15.14%)
Mutual labels: rstats
Targets
Function-oriented Make-like declarative workflows for R
Stars: ✭ 293 (-7.57%)
Mutual labels: rstats
rmd2jupyter
Convert Rmd (rmarkdown) to ipynb (Jupyter notebook)
Stars: ✭ 17 (-94.64%)
Mutual labels: rstats
ggdag: An R Package for visualizing and analyzing causal directed acyclic graphs
Tidy, analyze, and plot causal directed acyclic graphs (DAGs). ggdag
uses the powerful dagitty package to create and analyze structural
causal models and plot them using ggplot2 and ggraph in a consistent
and easy manner.
Installation
You can install ggdag with:
install.packages("ggdag")
Or you can install the development version from GitHub with:
# install.packages("devtools")
devtools::install_github("malcolmbarrett/ggdag")
Example
ggdag makes it easy to use dagitty in the context of the tidyverse.
You can directly tidy dagitty objects or use convenience functions to
create DAGs using a more R-like syntax:
library(ggdag)

#  example from the dagitty package
dag <- dagitty::dagitty("dag {
    y <- x <- z1 <- v -> z2 -> y
    z1 <- w1 <-> w2 -> z2
    x <- w1 -> y
    x <- w2 -> y
    x [exposure]
    y [outcome]
  }"
)

tidy_dag <- tidy_dagitty(dag)

tidy_dag
#> # A DAG with 7 nodes and 12 edges
#> #
#> # Exposure: x
#> # Outcome: y
#> #
#> # A tibble: 13 x 8
#>    name      x     y direction to     xend  yend circular
#>    <chr> <dbl> <dbl> <fct>     <chr> <dbl> <dbl> <lgl>
#>  1 v     11.8   8.03 ->        z1    10.4   7.77 FALSE
#>  2 v     11.8   8.03 ->        z2    12.1   6.66 FALSE
#>  3 w1    10.2   6.85 ->        x      9.95  6.28 FALSE
#>  4 w1    10.2   6.85 ->        y     11.1   6.39 FALSE
#>  5 w1    10.2   6.85 ->        z1    10.4   7.77 FALSE
#>  6 w1    10.2   6.85 <->       w2    10.9   5.75 FALSE
#>  7 w2    10.9   5.75 ->        x      9.95  6.28 FALSE
#>  8 w2    10.9   5.75 ->        y     11.1   6.39 FALSE
#>  9 w2    10.9   5.75 ->        z2    12.1   6.66 FALSE
#> 10 x      9.95  6.28 ->        y     11.1   6.39 FALSE
#> 11 z1    10.4   7.77 ->        x      9.95  6.28 FALSE
#> 12 z2    12.1   6.66 ->        y     11.1   6.39 FALSE
#> 13 y     11.1   6.39 <NA>      <NA>  NA    NA    FALSE

#  using more R-like syntax to create the same DAG
tidy_ggdag <- dagify(
  y ~ x + z2 + w2 + w1,
  x ~ z1 + w1 + w2,
  z1 ~ w1 + v,
  z2 ~ w2 + v,
  w1 ~~ w2, # bidirected path
  exposure = "x",
  outcome = "y"
) %>%
  tidy_dagitty()

tidy_ggdag
#> # A DAG with 7 nodes and 12 edges
#> #
#> # Exposure: x
#> # Outcome: y
#> #
#> # A tibble: 13 x 8
#>    name      x     y direction to     xend  yend circular
#>    <chr> <dbl> <dbl> <fct>     <chr> <dbl> <dbl> <lgl>
#>  1 v      9.30  13.4 ->        z1     9.74  12.1 FALSE
#>  2 v      9.30  13.4 ->        z2     7.96  13.0 FALSE
#>  3 w1     8.74  11.0 ->        x      8.86  11.6 FALSE
#>  4 w1     8.74  11.0 ->        y      7.68  11.5 FALSE
#>  5 w1     8.74  11.0 ->        z1     9.74  12.1 FALSE
#>  6 w1     8.74  11.0 <->       w2     8.00  12.0 FALSE
#>  7 w2     8.00  12.0 ->        x      8.86  11.6 FALSE
#>  8 w2     8.00  12.0 ->        y      7.68  11.5 FALSE
#>  9 w2     8.00  12.0 ->        z2     7.96  13.0 FALSE
#> 10 x      8.86  11.6 ->        y      7.68  11.5 FALSE
#> 11 z1     9.74  12.1 ->        x      8.86  11.6 FALSE
#> 12 z2     7.96  13.0 ->        y      7.68  11.5 FALSE
#> 13 y      7.68  11.5 <NA>      <NA>  NA     NA   FALSE
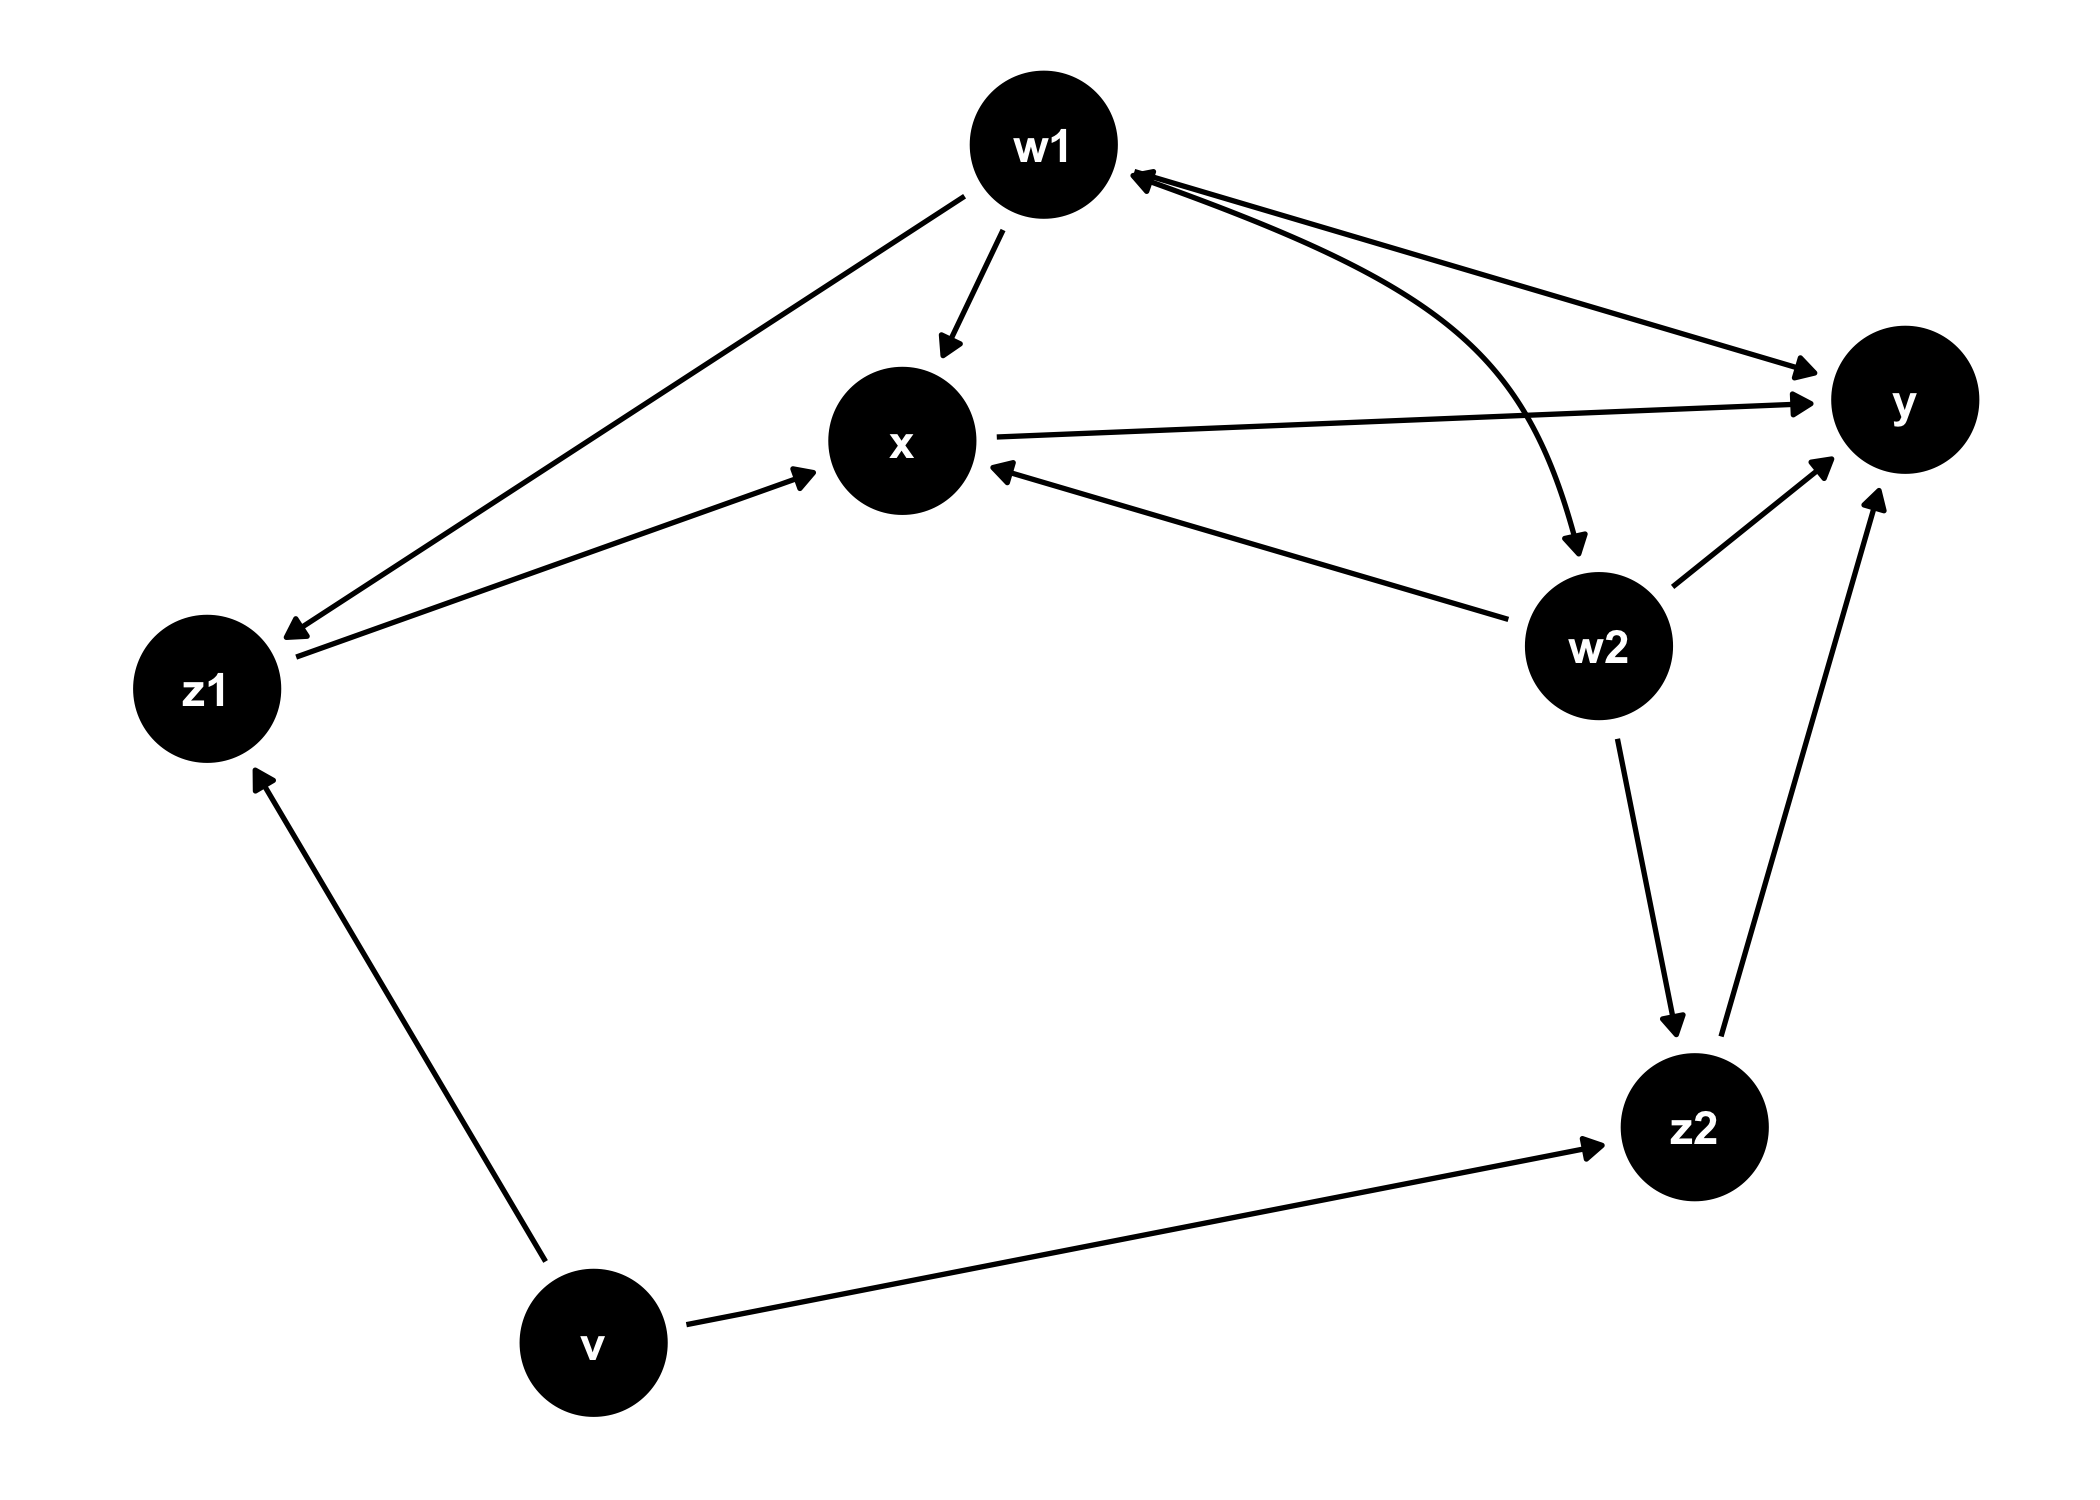
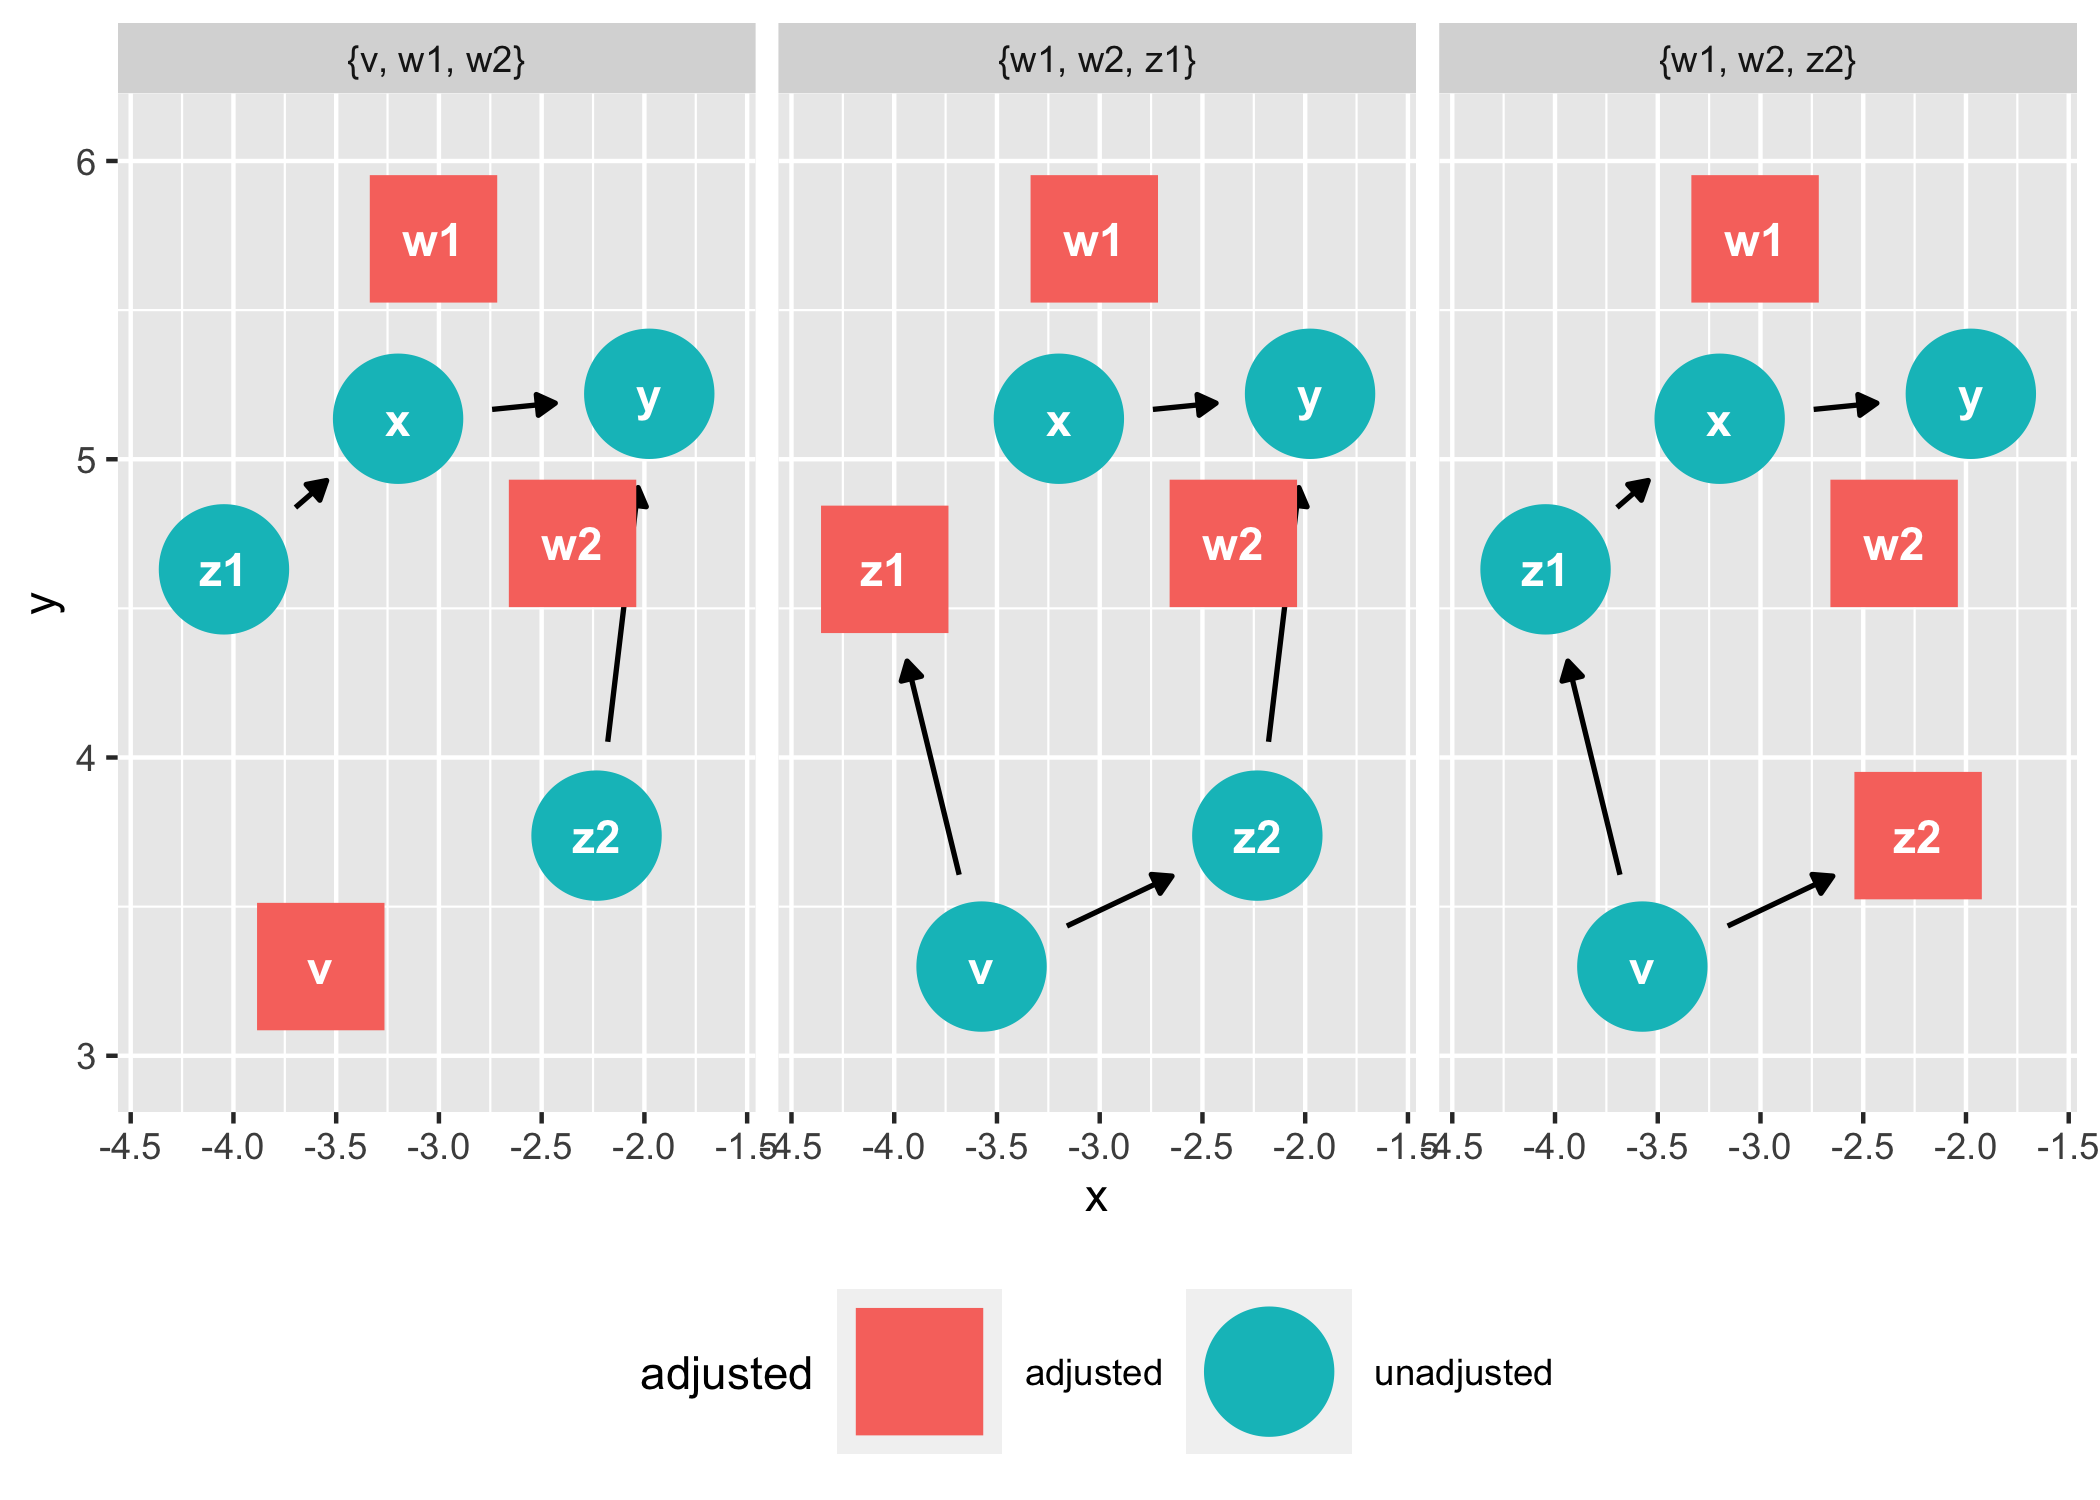
ggdag also provides functionality for analyzing DAGs and plotting them
in ggplot2:
ggdag(tidy_ggdag) +
  theme_dag()
ggdag_adjustment_set(tidy_ggdag, node_size = 14) +
  theme(legend.position = "bottom")
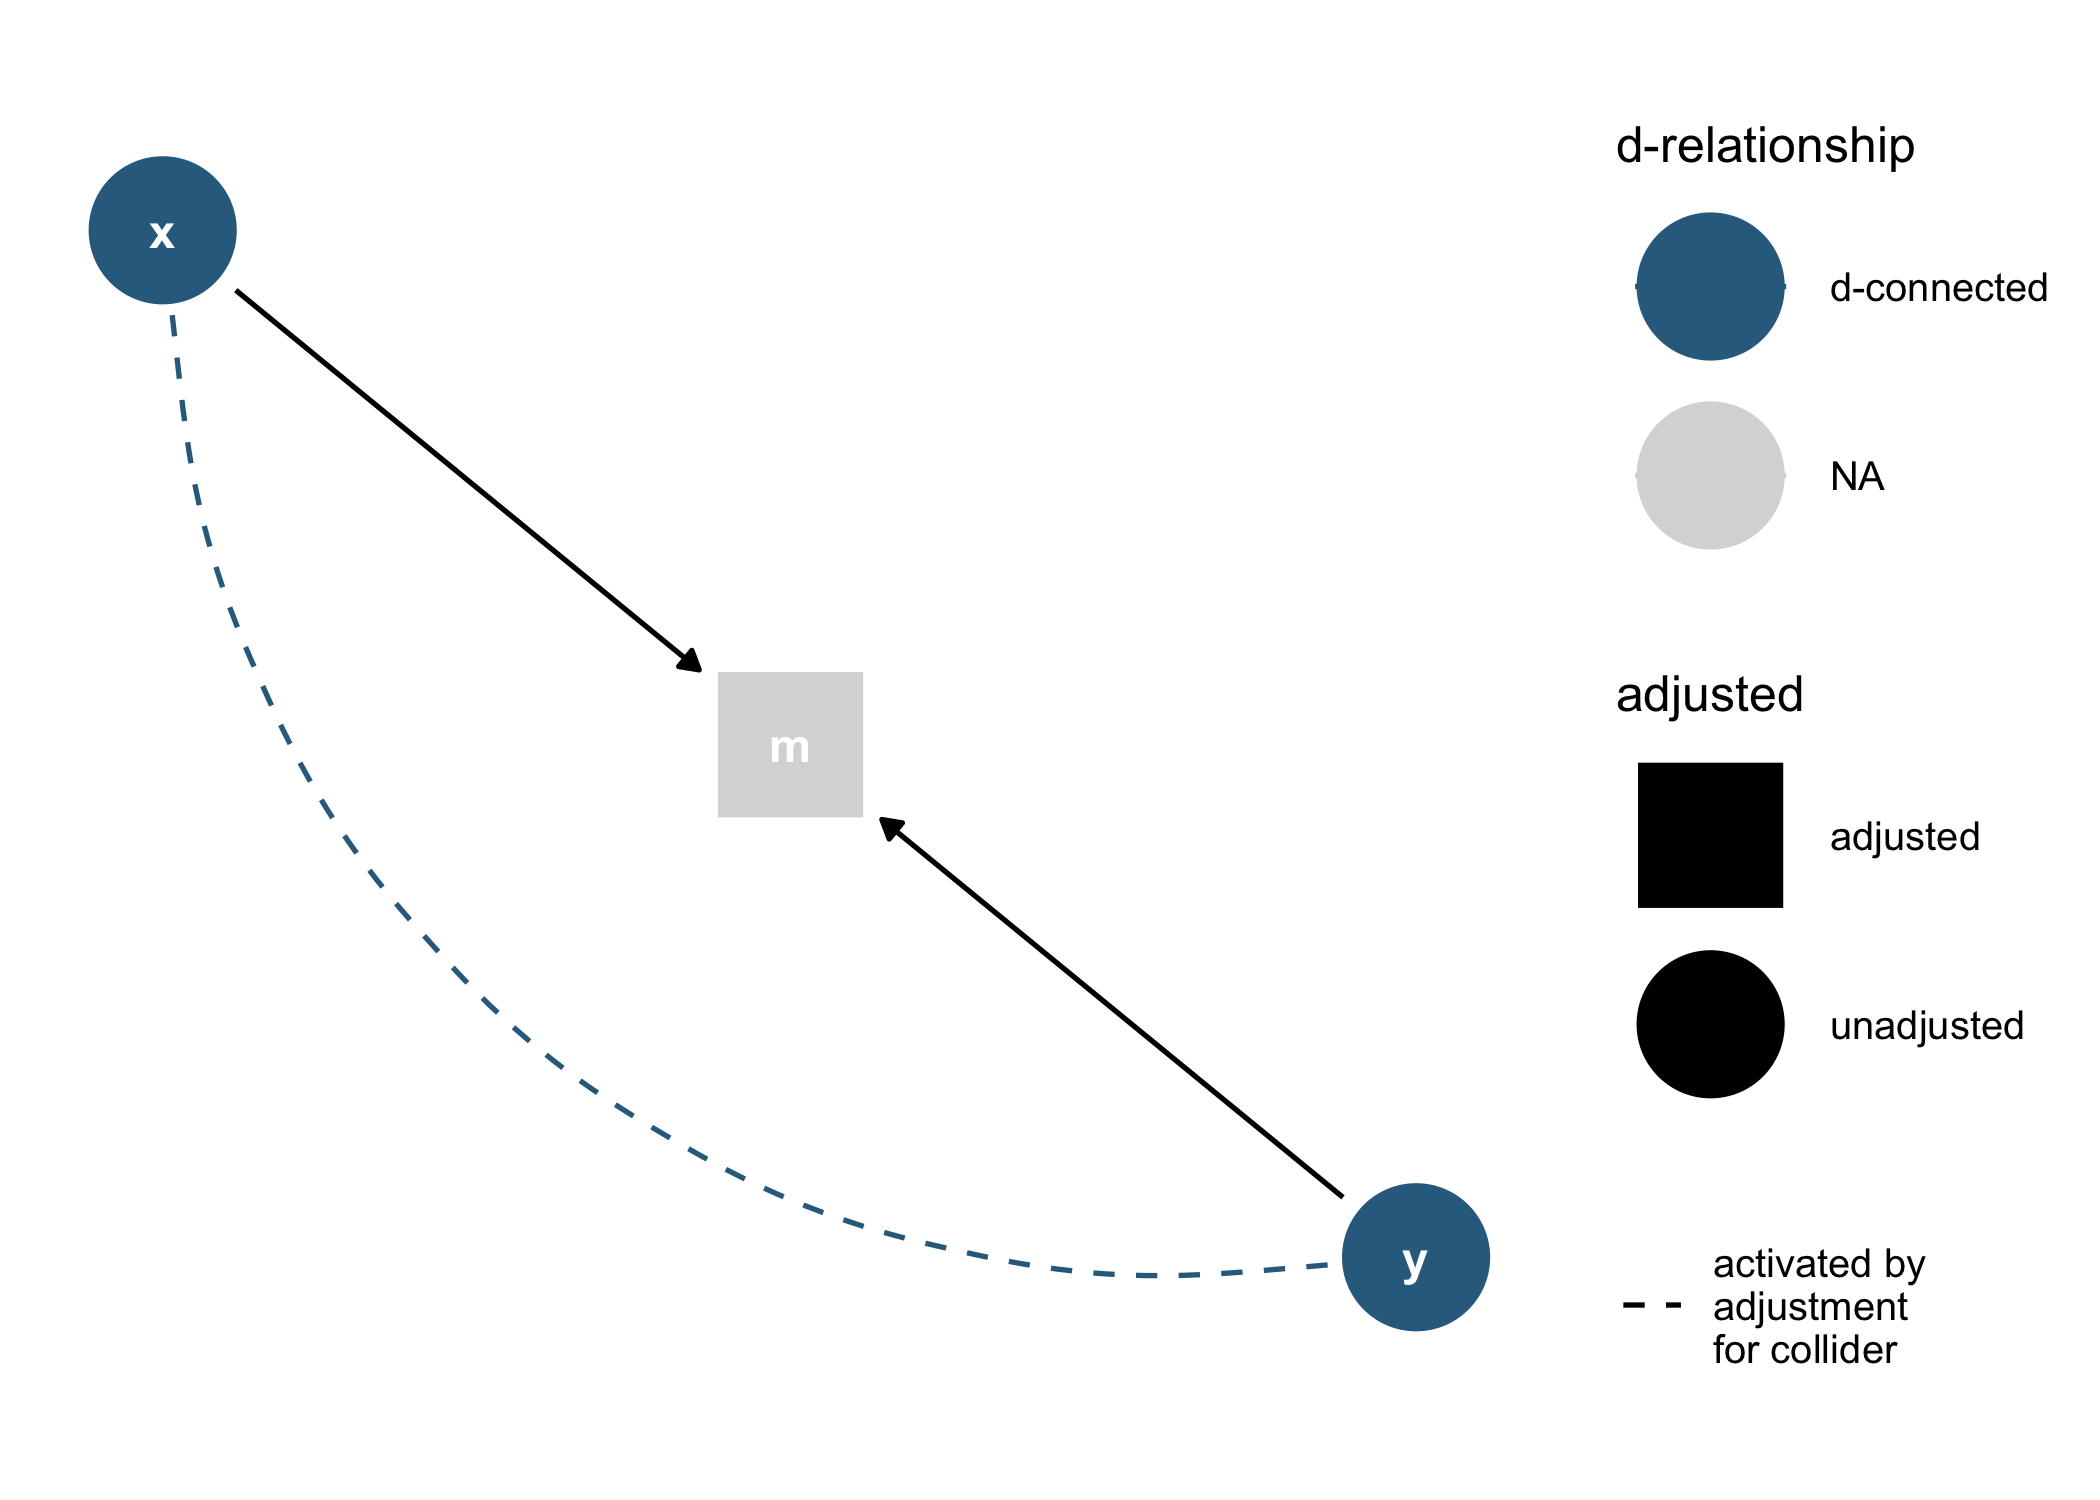
As well as geoms and other functions for plotting them directly in
ggplot2:
dagify(m ~ x + y) %>%
  tidy_dagitty() %>%
  node_dconnected("x", "y", controlling_for = "m") %>%
  ggplot(aes(
    x = x,
    y = y,
    xend = xend,
    yend = yend,
    shape = adjusted,
    col = d_relationship
  )) +
    geom_dag_edges(aes(end_cap = ggraph::circle(10, "mm"))) +
    geom_dag_collider_edges() +
    geom_dag_point() +
    geom_dag_text(col = "white") +
    theme_dag() +
    scale_adjusted() +
    expand_plot(expand_y = expansion(c(0.2, 0.2))) +
    scale_color_viridis_d(
      name = "d-relationship",
      na.value = "grey85",
      begin = .35
    )
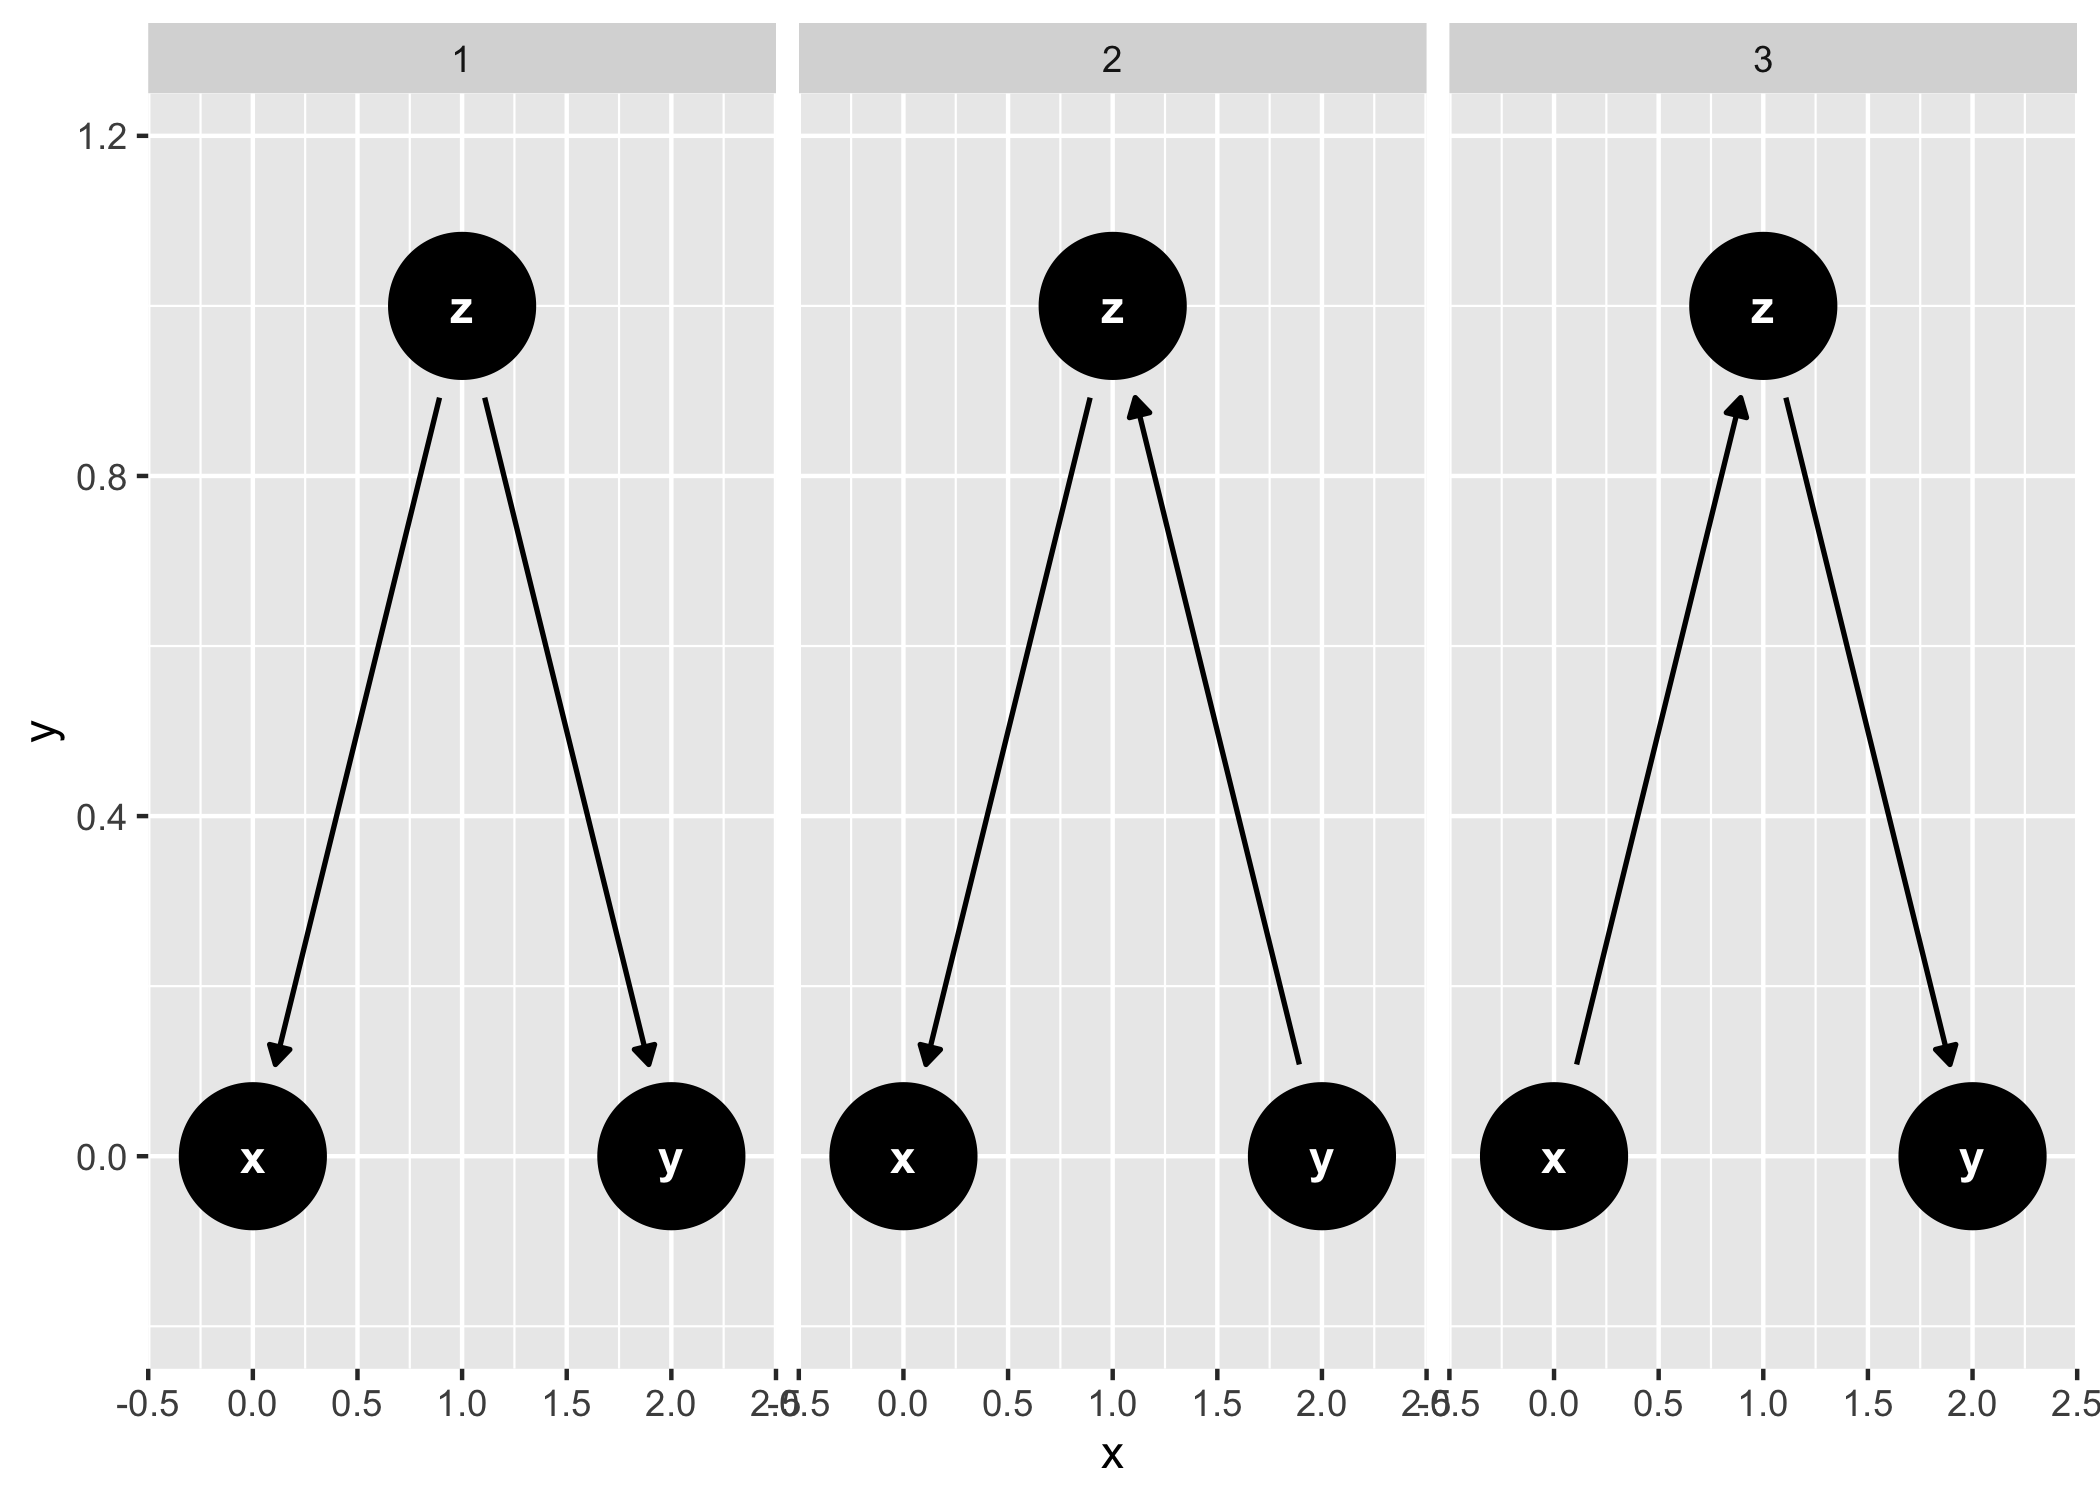
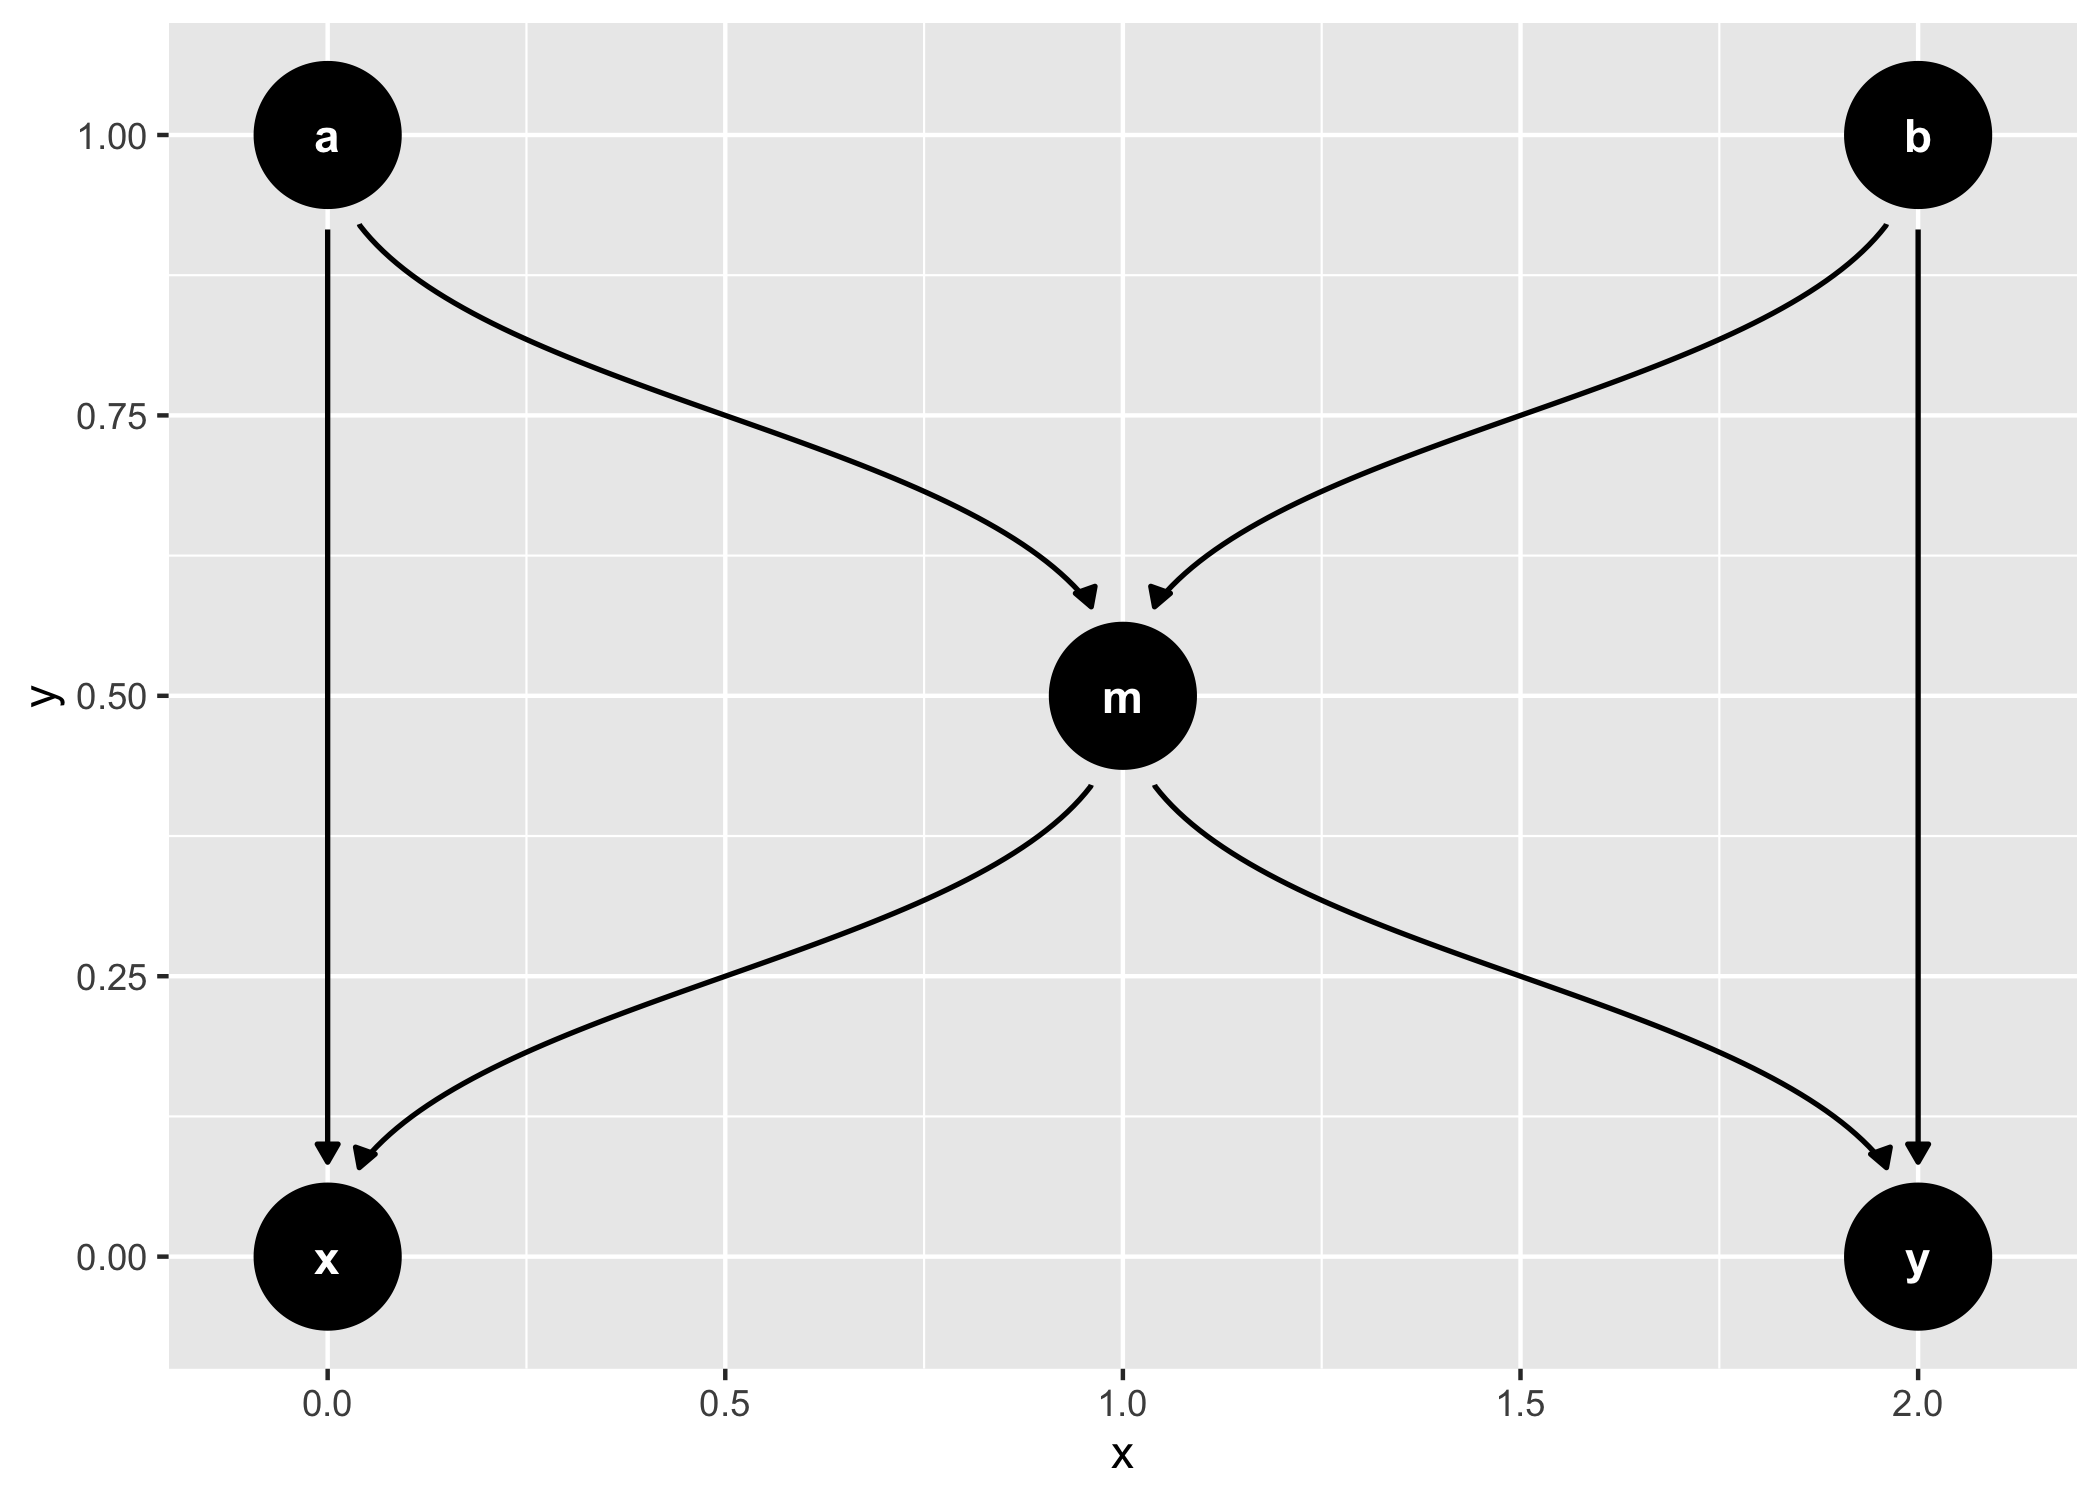
And common structures of bias:
ggdag_equivalent_dags(confounder_triangle())
ggdag_butterfly_bias(edge_type = "diagonal")
Note that the project description data, including the texts, logos, images, and/or trademarks,
for each open source project belongs to its rightful owner.
If you wish to add or remove any projects, please contact us at [email protected].

