All Projects β†’ const-ae β†’ Ggsignif

const-ae / Ggsignif

Easily add significance brackets to your ggplots

Programming Languages

r
7636 projects

Projects that are alternatives of or similar to Ggsignif

Ggalt
🌎 Extra Coordinate Systems, Geoms, Statistical Transformations & Scales for 'ggplot2'
Stars: ✭ 561 (+74.22%)
Mutual labels:  ggplot2, ggplot-extension, rstats
Patchwork
The Composer of ggplots
Stars: ✭ 2,002 (+521.74%)
Mutual labels:  ggplot2, ggplot-extension, rstats
Calendr
Ready to print calendars with ggplot2
Stars: ✭ 161 (-50%)
Mutual labels:  ggplot2, ggplot-extension, rstats
Ggbernie
A ggplot2 geom for adding Bernie Sanders to ggplot2
Stars: ✭ 96 (-70.19%)
Mutual labels:  ggplot2, ggplot-extension, rstats
Ggpointdensity
πŸ“ˆ πŸ“Š Introduces geom_pointdensity(): A Cross Between a Scatter Plot and a 2D Density Plot.
Stars: ✭ 286 (-11.18%)
Mutual labels:  ggplot2, ggplot-extension, rstats
Ggforce
Accelerating ggplot2
Stars: ✭ 640 (+98.76%)
Mutual labels:  ggplot2, ggplot-extension, rstats
Econocharts
Microeconomics/macroeconomics charts in ggplot2
Stars: ✭ 161 (-50%)
Mutual labels:  ggplot2, ggplot-extension, rstats
Hrbrthemes
πŸ” Opinionated, typographic-centric ggplot2 themes and theme components
Stars: ✭ 899 (+179.19%)
Mutual labels:  ggplot2, ggplot-extension, rstats
Ggcats
The geom you always wished for adding cats to ggplot2
Stars: ✭ 34 (-89.44%)
Mutual labels:  ggplot2, ggplot-extension, rstats
Gganimate
A Grammar of Animated Graphics
Stars: ✭ 1,744 (+441.61%)
Mutual labels:  ggplot2, ggplot-extension, rstats
Ggpomological
πŸ‘ Pomological plot theme for ggplot2
Stars: ✭ 293 (-9.01%)
Mutual labels:  ggplot2, rstats
Plotly
An interactive graphing library for R
Stars: ✭ 2,096 (+550.93%)
Mutual labels:  ggplot2, rstats
Ghibli
Studio Ghibli colour palettes
Stars: ✭ 227 (-29.5%)
Mutual labels:  ggplot2, rstats
Gghalves
βœ‚οΈ Easy half-half geoms in ggplot2
Stars: ✭ 174 (-45.96%)
Mutual labels:  ggplot2, ggplot-extension
cusumcharter
Easier CUSUM control charts. Returns simple CUSUM statistics, CUSUMs with control limit calculations, and function to generate faceted CUSUM Control Charts
Stars: ✭ 17 (-94.72%)
Mutual labels:  ggplot2, rstats
ggdogs
The geom you always wished for adding dogs to ggplot2
Stars: ✭ 28 (-91.3%)
Mutual labels:  ggplot2, ggplot-extension
Ggh4x
ggplot extension: options for tailored facets, multiple colourscales and miscellaneous
Stars: ✭ 148 (-54.04%)
Mutual labels:  ggplot2, ggplot-extension
ggbg
Miscellaneous Ggplot2 Extensions
Stars: ✭ 21 (-93.48%)
Mutual labels:  ggplot2, ggplot-extension
Ggextra
πŸ“Š Add marginal histograms to ggplot2, and more ggplot2 enhancements
Stars: ✭ 299 (-7.14%)
Mutual labels:  ggplot2, rstats
DataViz-Teaching
πŸ“ˆ Visualizations for DataViz Teaching
Stars: ✭ 29 (-90.99%)
Mutual labels:  ggplot2, rstats

ggsignif: Significance Brackets for β€˜ggplot2’

CRAN_Status_Badge R build status Downloads Codecov test coverage lifecycle

Description

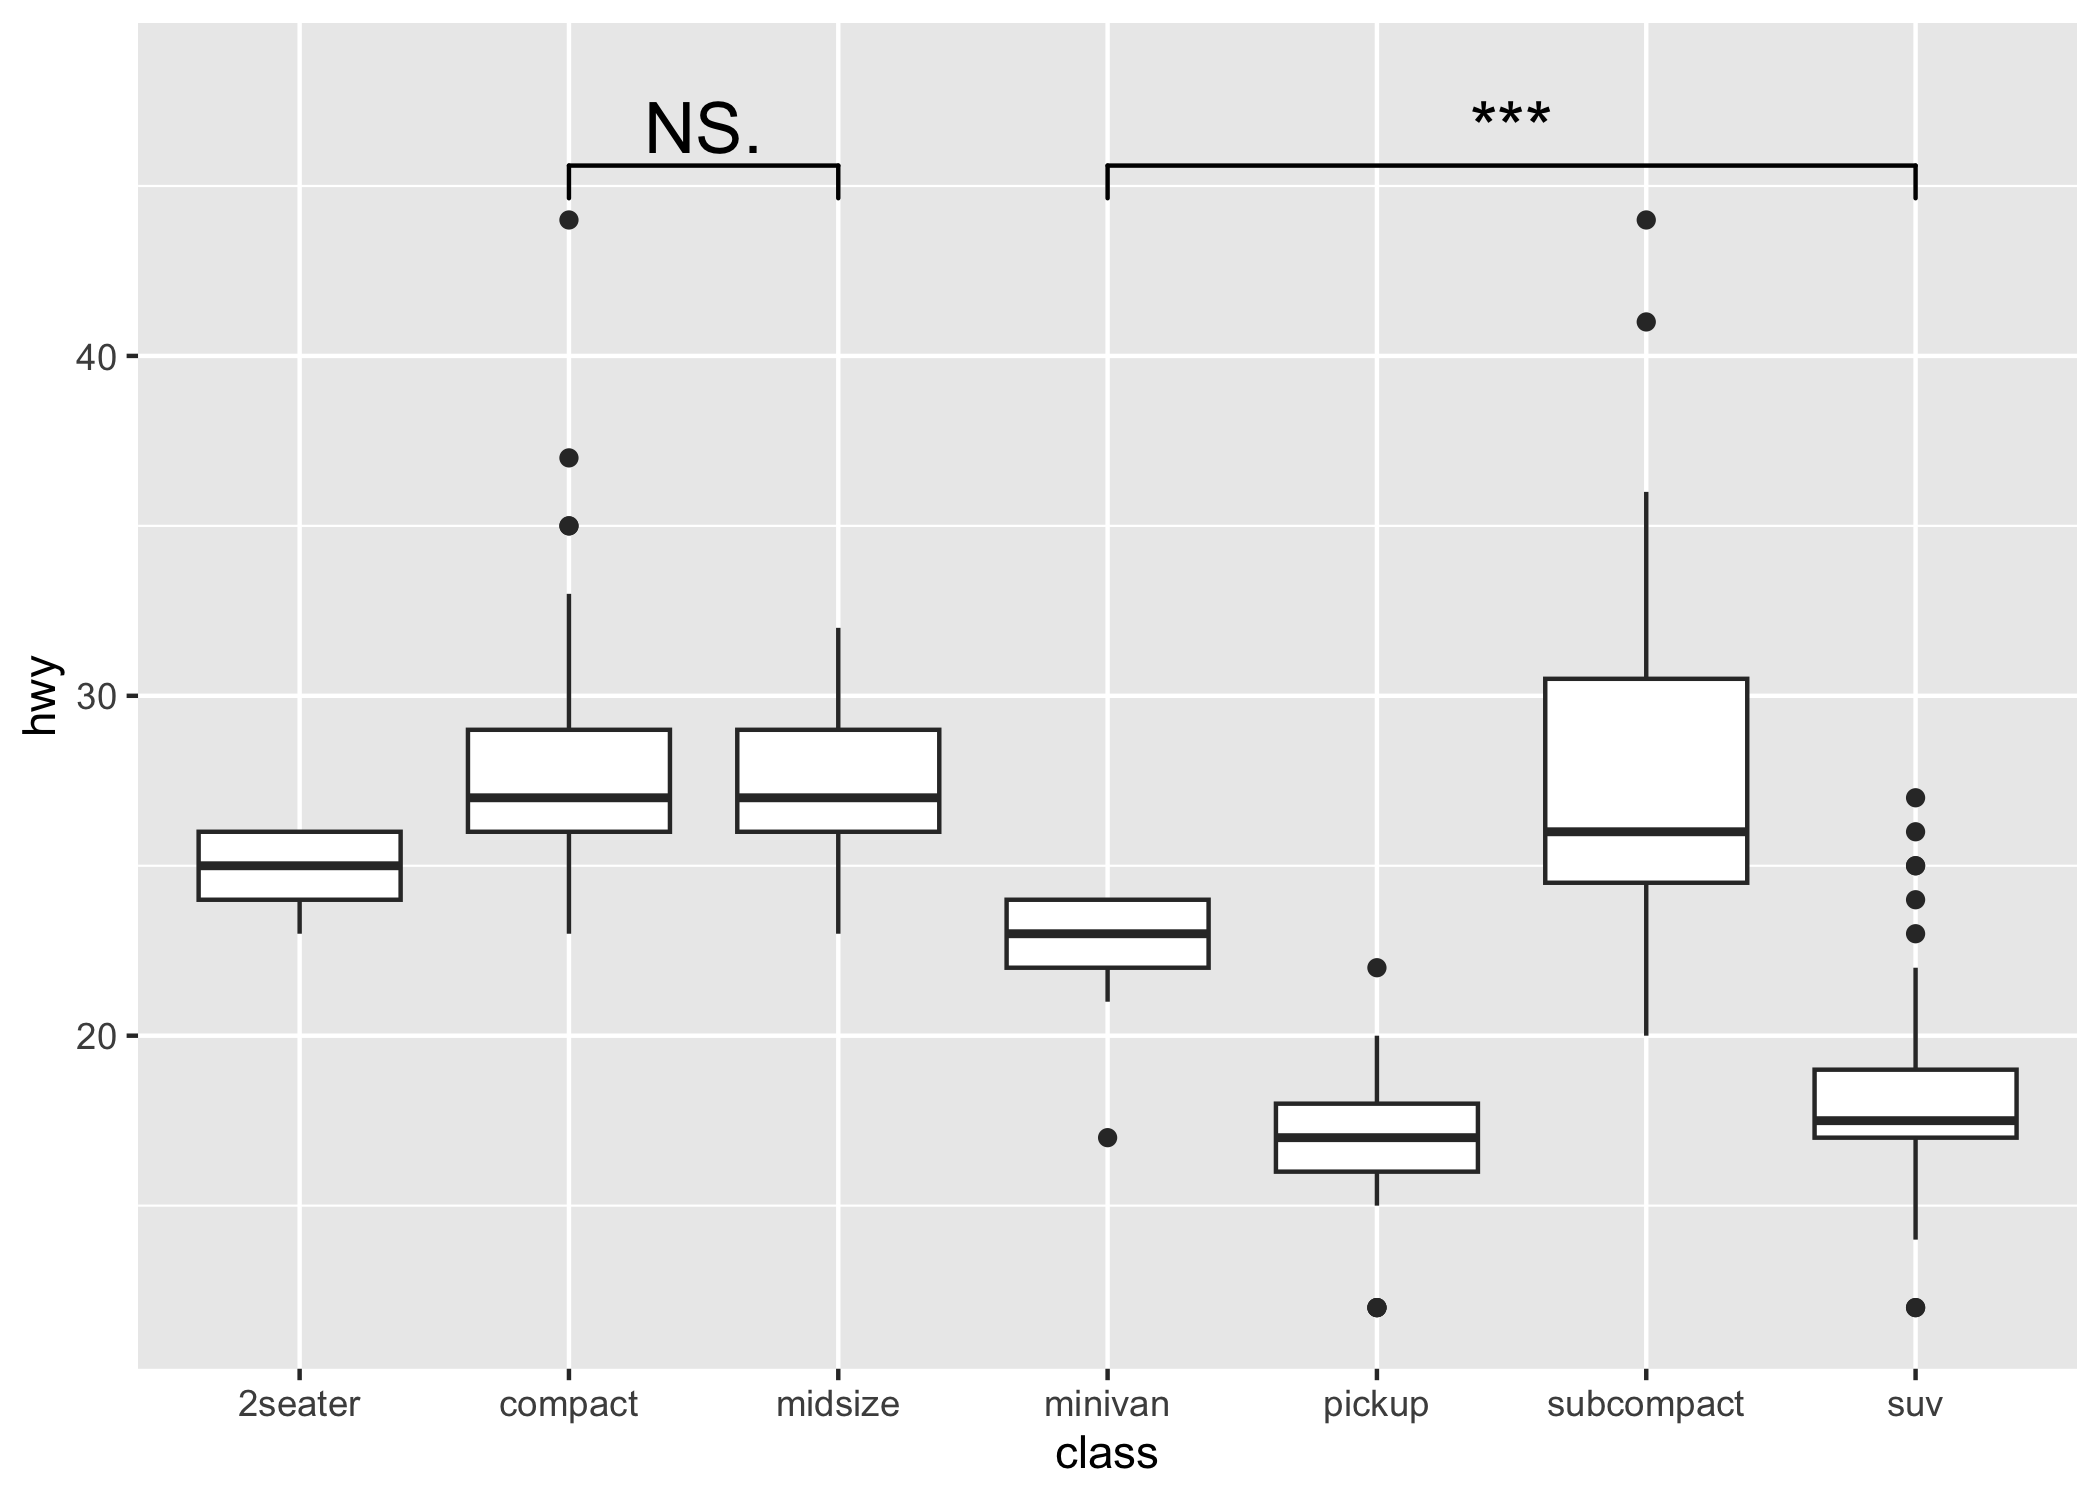
This package provides an easy way to indicate if two groups are significantly different. Commonly this is shown by a bar on top connecting the groups of interest which itself is annotated with the level of significance (NS, *, **, ***). The package provides a single layer (geom_signif) that takes the groups for comparison and the test (t.test, wilcox etc.) and adds the annotation to the plot.

Example

Install package

install.packages("ggsignif")

# Or for the latest development version
remotes::install_github("const-ae/ggsignif")

Plot significance

library(ggplot2)
library(ggsignif)

ggplot(mpg, aes(class, hwy)) +
  geom_boxplot() +
  geom_signif(
    comparisons = list(c("compact", "midsize"), c("minivan", "suv")),
    map_signif_level = TRUE, textsize = 6
  ) +
  ylim(NA, 48)

Setting the precise location

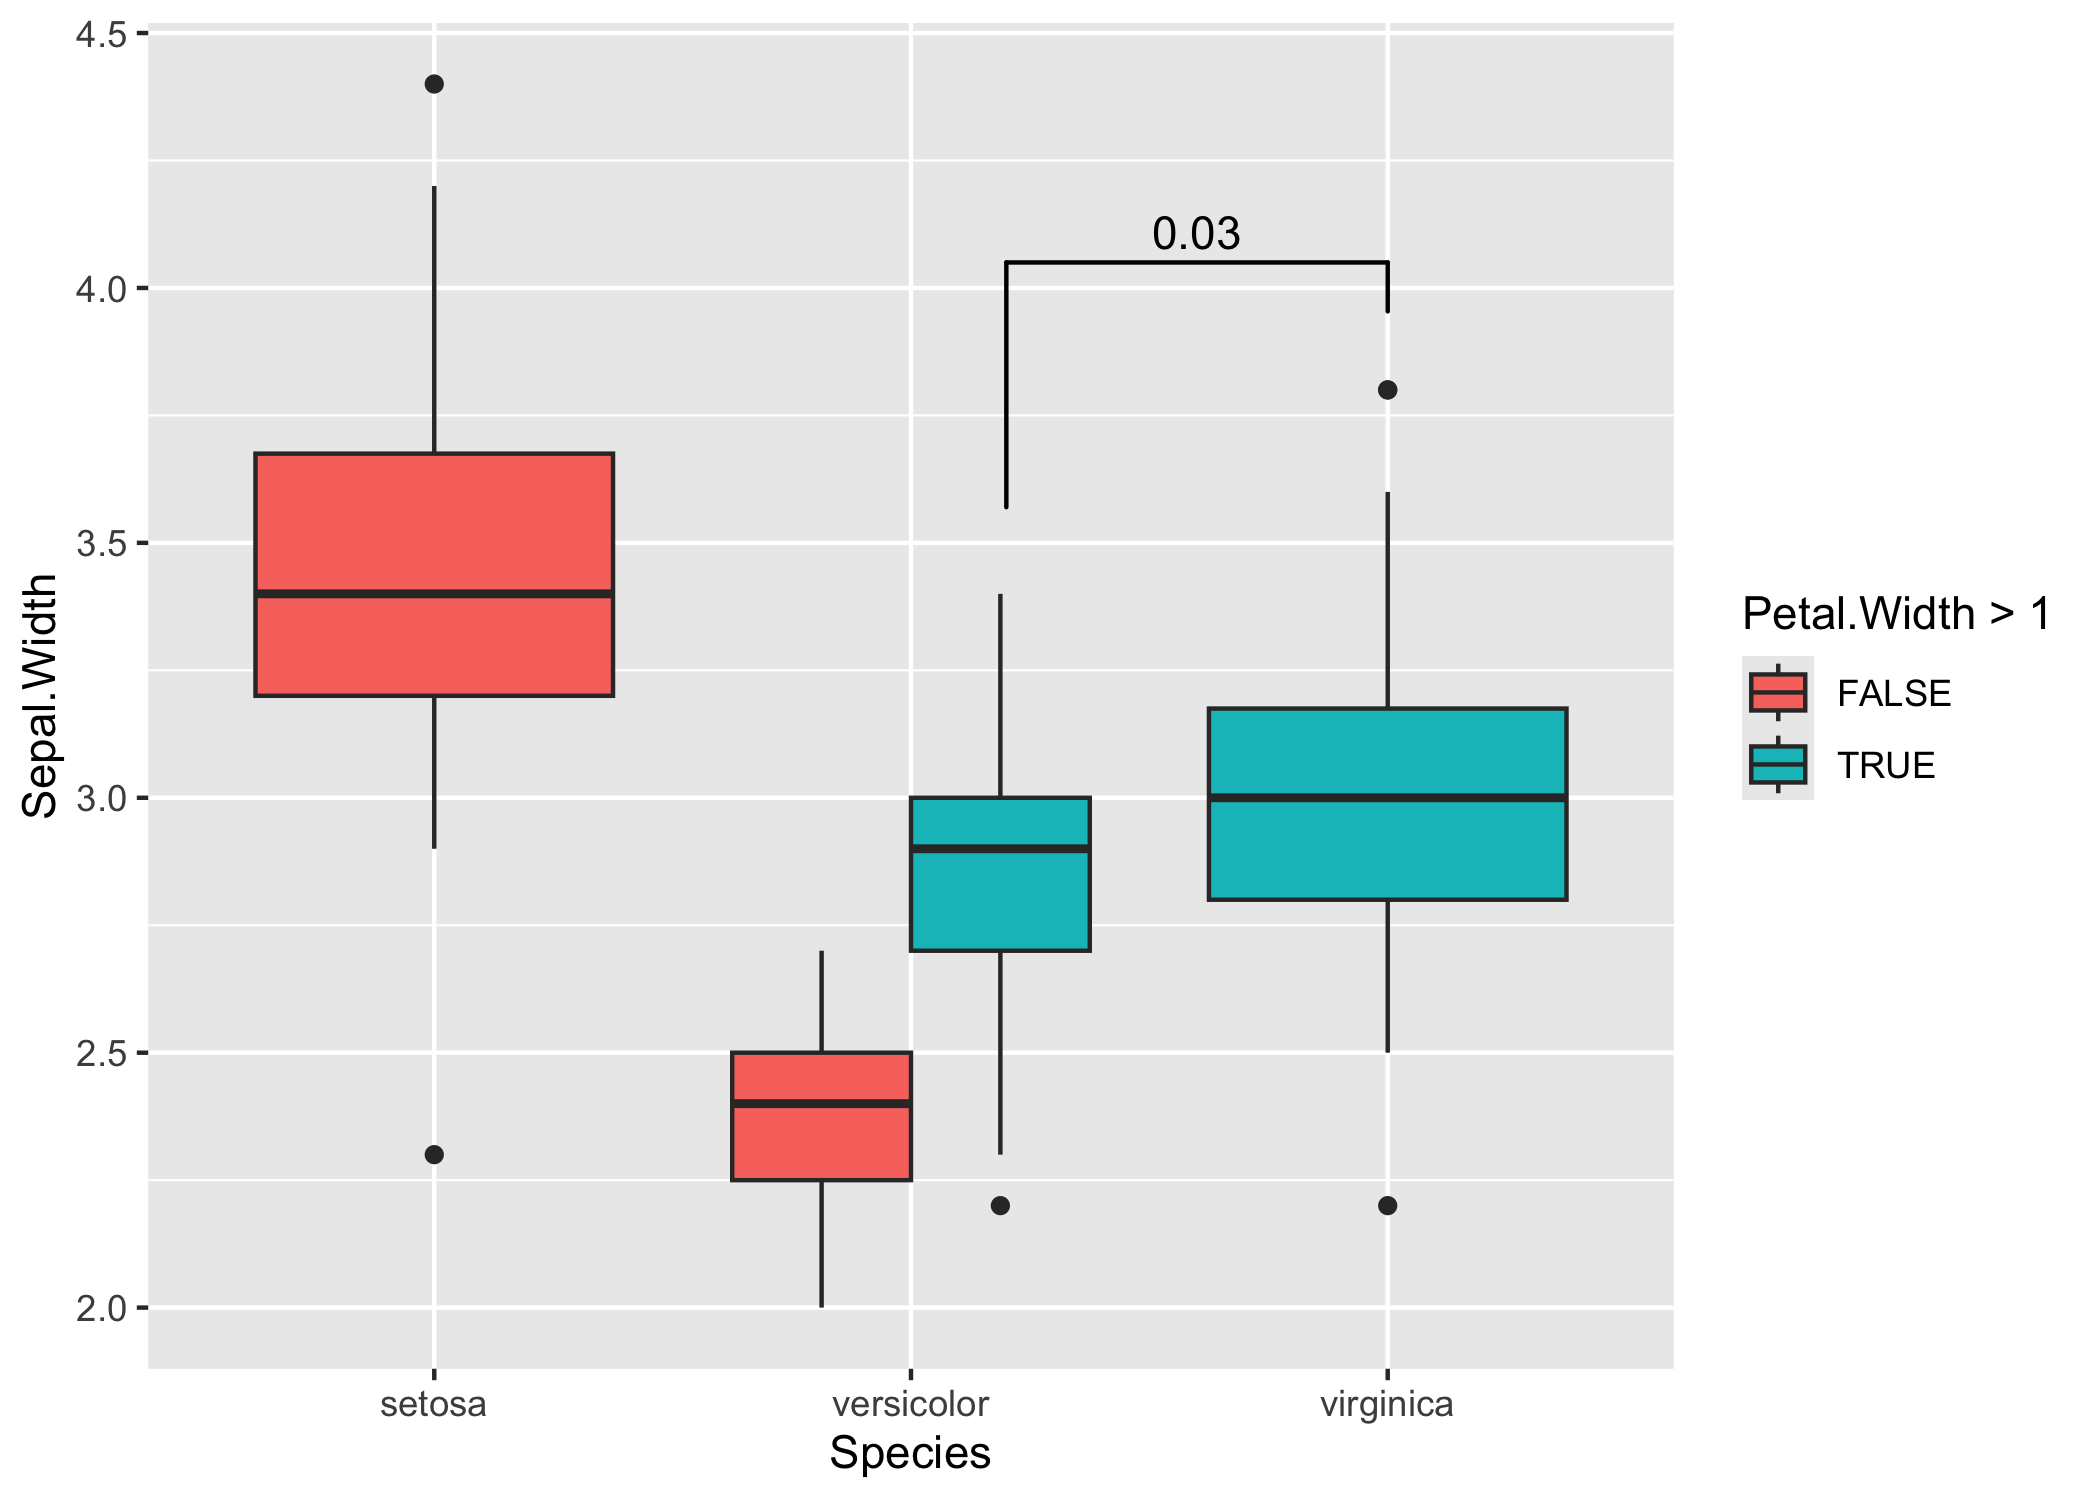
This is important if you use position="dodge", because in that case I cannot calculate the correct position of the bars automatically.

# Calculate annotation
anno <- t.test(
  iris[iris$Petal.Width > 1 & iris$Species == "versicolor", "Sepal.Width"],
  iris[iris$Species == "virginica", "Sepal.Width"]
)$p.value

# Make plot with custom x and y position of the bracket
ggplot(iris, aes(x = Species, y = Sepal.Width, fill = Petal.Width > 1)) +
  geom_boxplot(position = "dodge") +
  geom_signif(
    annotation = formatC(anno, digits = 1),
    y_position = 4.05, xmin = 2.2, xmax = 3,
    tip_length = c(0.2, 0.04)
  )

Advanced Example

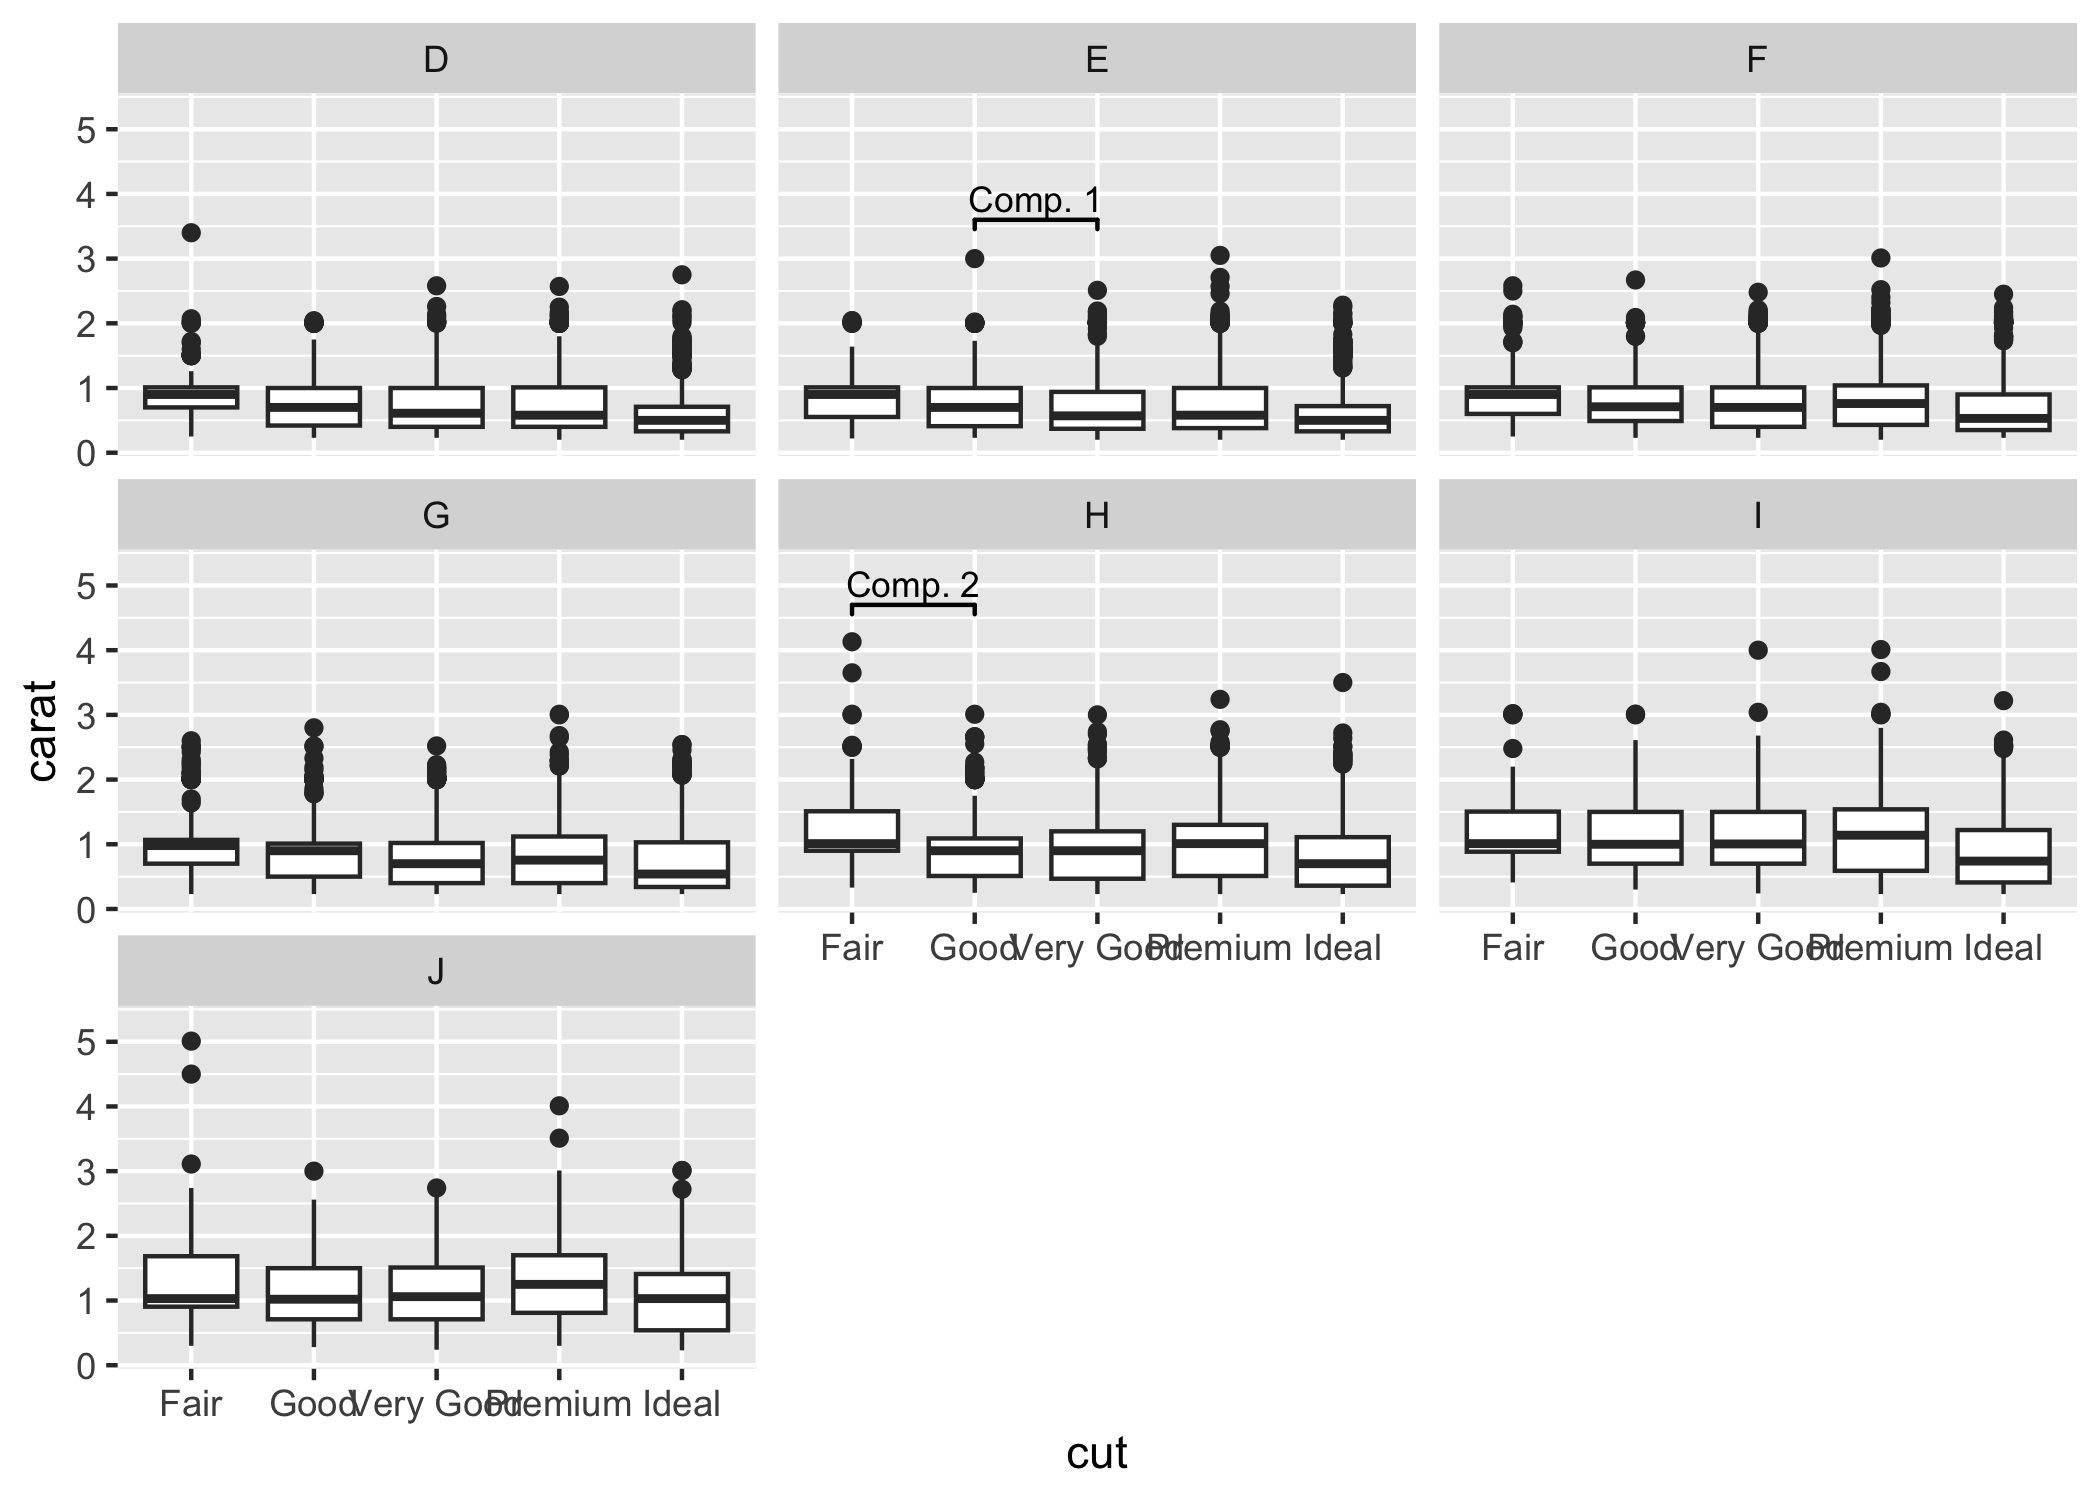
Sometimes one needs to have a very fine tuned ability to set the location of the the significance bars in combination with facet_wrap or facet_grid. In those cases it you can set the flag manual=TRUE and provide the annotations as a data.frame:

annotation_df <- data.frame(
  color = c("E", "H"),
  start = c("Good", "Fair"),
  end = c("Very Good", "Good"),
  y = c(3.6, 4.7),
  label = c("Comp. 1", "Comp. 2")
)

annotation_df
#>   color start       end   y   label
#> 1     E  Good Very Good 3.6 Comp. 1
#> 2     H  Fair      Good 4.7 Comp. 2

ggplot(diamonds, aes(x = cut, y = carat)) +
  geom_boxplot() +
  geom_signif(
    data = annotation_df,
    aes(xmin = start, xmax = end, annotations = label, y_position = y),
    textsize = 3, vjust = -0.2,
    manual = TRUE
  ) +
  facet_wrap(~color) +
  ylim(NA, 5.3)

You can ignore the warning about the missing aesthetics.

For further details go the CRAN page and check the examples in the vignette.

Maintenance

This package is provided as is and I currently don’t have any plans and the capacity to add any new features to it. If there is nonetheless a feature which you would like to see in the package, you are always welcome to submit pull request, which I will try to address as soon as possible.

Code of Conduct

Please note that the ggsignif project is released with a Contributor Code of Conduct. By contributing to this project, you agree to abide by its terms.

Note that the project description data, including the texts, logos, images, and/or trademarks, for each open source project belongs to its rightful owner. If you wish to add or remove any projects, please contact us at [email protected].