All Projects → Shians → Glimma

Shians / Glimma

Licence: LGPL-3.0 license
Glimma R package

Programming Languages

r
7636 projects

Projects that are alternatives of or similar to Glimma

Gglabeller
Shiny gadget for labeling points on ggplot
Stars: ✭ 161 (+235.42%)
Mutual labels:  plot
Charts
⚡ Laravel Charts — Build charts using laravel. The laravel adapter for Chartisan.
Stars: ✭ 2,337 (+4768.75%)
Mutual labels:  plot
sigstar
add significance stars to MATLAB plots
Stars: ✭ 33 (-31.25%)
Mutual labels:  plot
Scikit Plot
An intuitive library to add plotting functionality to scikit-learn objects.
Stars: ✭ 2,162 (+4404.17%)
Mutual labels:  plot
Plotjuggler
The Time Series Visualization Tool that you deserve.
Stars: ✭ 2,620 (+5358.33%)
Mutual labels:  plot
Dython
A set of data tools in Python
Stars: ✭ 200 (+316.67%)
Mutual labels:  plot
Godot Engine.easy Charts
A Godot Engine addon for plotting general purpose charts. A collection of Control, 2D and 3D Nodes to plot every chart possible.
Stars: ✭ 146 (+204.17%)
Mutual labels:  plot
maptalks.plot
🎨 | maptalks plot
Stars: ✭ 19 (-60.42%)
Mutual labels:  plot
Peroxide
Rust numeric library with R, MATLAB & Python syntax
Stars: ✭ 191 (+297.92%)
Mutual labels:  plot
publib
Produce publication-level quality images on top of Matplotlib
Stars: ✭ 34 (-29.17%)
Mutual labels:  plot
Computator.net
Computator.NET is a special kind of numerical software that is fast and easy to use but not worse than others feature-wise. It's features include: - Real and complex functions charts - Real and complex calculator - Real functions numerical calculations including different methods - Over 107 Elementary functions - Over 141 Special functions - Over 21 Matrix functions and operations - Scripting language with power to easy computations including matrices - You can declare your own custom functions with scripting language
Stars: ✭ 174 (+262.5%)
Mutual labels:  plot
Lets Plot Kotlin
Kotlin API for Lets-Plot - an open-source plotting library for statistical data.
Stars: ✭ 181 (+277.08%)
Mutual labels:  plot
Jkqtplotter
an extensive Qt5 Plotter framework (including a feature-richt plotter widget, a speed-optimized, but limited variant and a LaTeX equation renderer!), written fully in C/C++ and without external dependencies
Stars: ✭ 246 (+412.5%)
Mutual labels:  plot
Visbrain
A multi-purpose GPU-accelerated open-source suite for brain data visualization
Stars: ✭ 172 (+258.33%)
Mutual labels:  plot
Goodreads visualization
A Jupyter notebook where I play with my Goodreads data
Stars: ✭ 51 (+6.25%)
Mutual labels:  plot
Git Punchcard Plot
a tool to visualize the time distribution of commits
Stars: ✭ 158 (+229.17%)
Mutual labels:  plot
Swiftcharts
Easy to use and highly customizable charts library for iOS
Stars: ✭ 2,336 (+4766.67%)
Mutual labels:  plot
laravel-quasar
⏰📊✨Laravel Time Series - Provides an API to create and maintain data projections (statistics, aggregates, etc.) from your Eloquent models, and convert them to time series.
Stars: ✭ 78 (+62.5%)
Mutual labels:  plot
rush
R One-Liners from the Shell
Stars: ✭ 44 (-8.33%)
Mutual labels:  plot
Plotoptix
Data visualisation in Python based on OptiX 7.2 ray tracing framework.
Stars: ✭ 252 (+425%)
Mutual labels:  plot
Master Devel
Build Status Build Status
codecov codecov

Glimma

Welcome to Glimma, a R package for creating interactive plots for differential expression analysis.

User suggestions are very welcome, please start an issue for usability improvements or features you'd like to see!

Installation

Using BioConductor

This is the recommended method for installing Glimma. The release version can be installed by running the code below:

source("https://bioconductor.org/biocLite.R")
biocLite("Glimma")

If a more recent version is required the developmental version:

source("https://bioconductor.org/biocLite.R")
useDevel()
biocLite("Glimma")

Bug reports

If you find bugs please let me know by submitting an issue to this project. If possible please provide a small runnable example demonstrating the bug, operating system and R version.

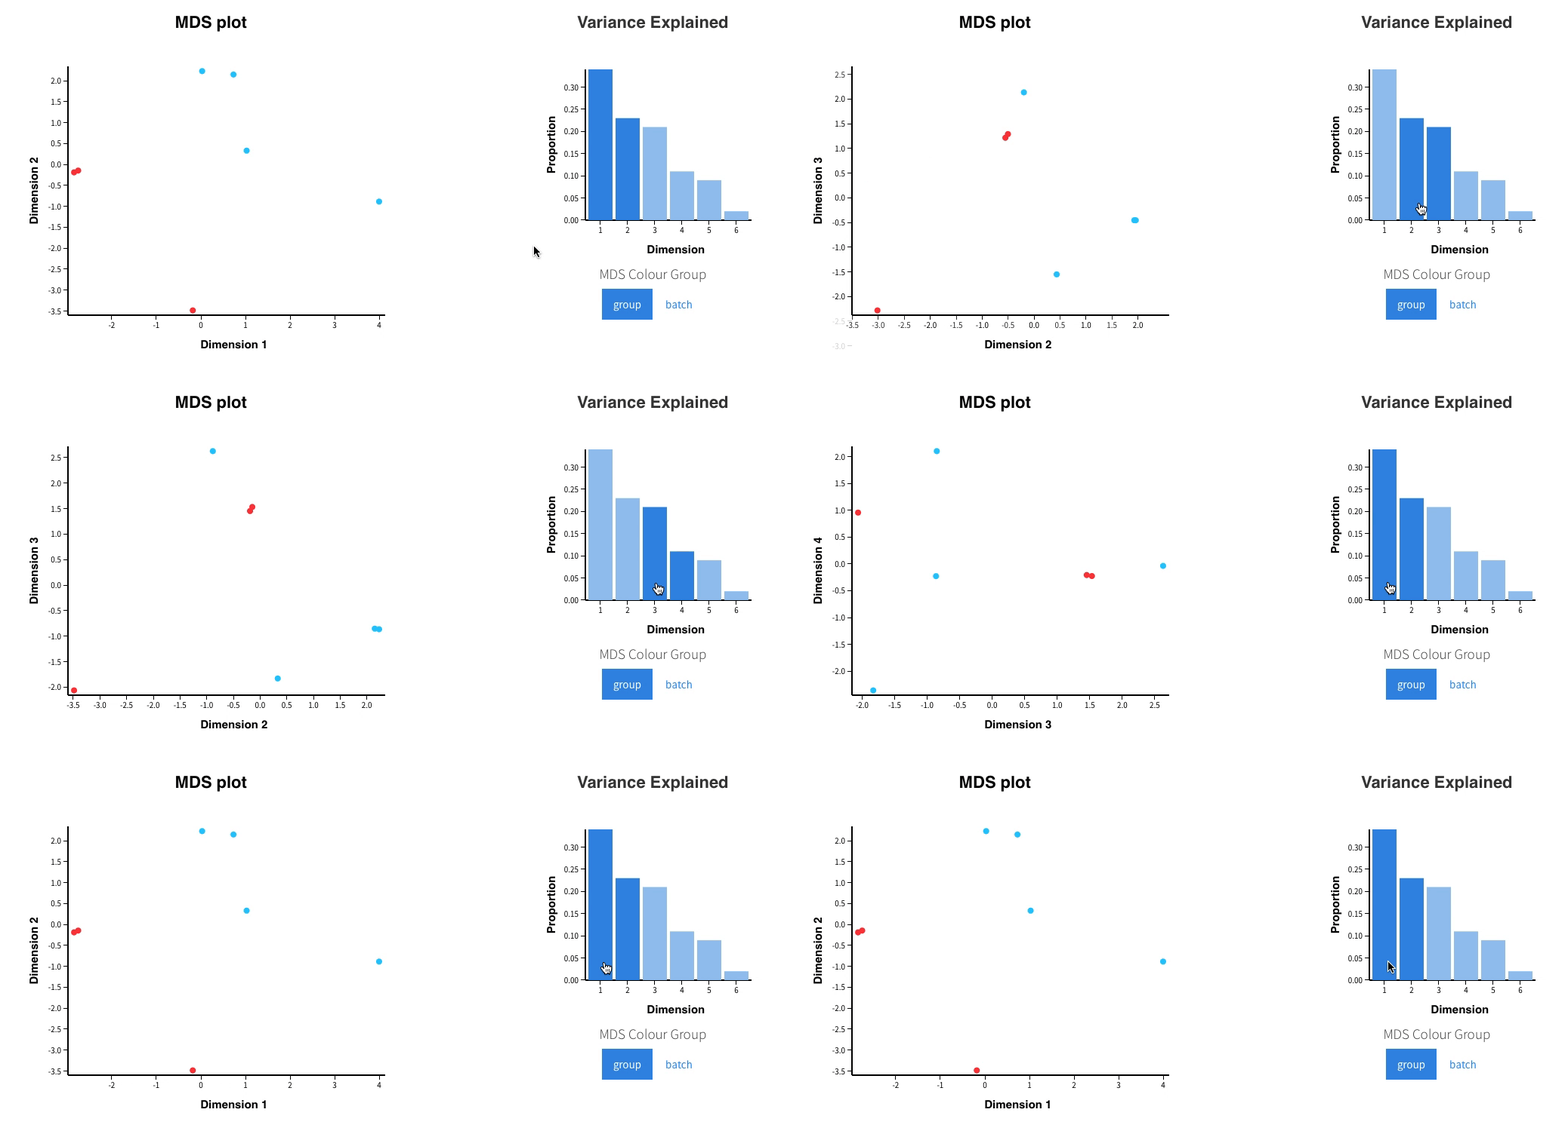
Features

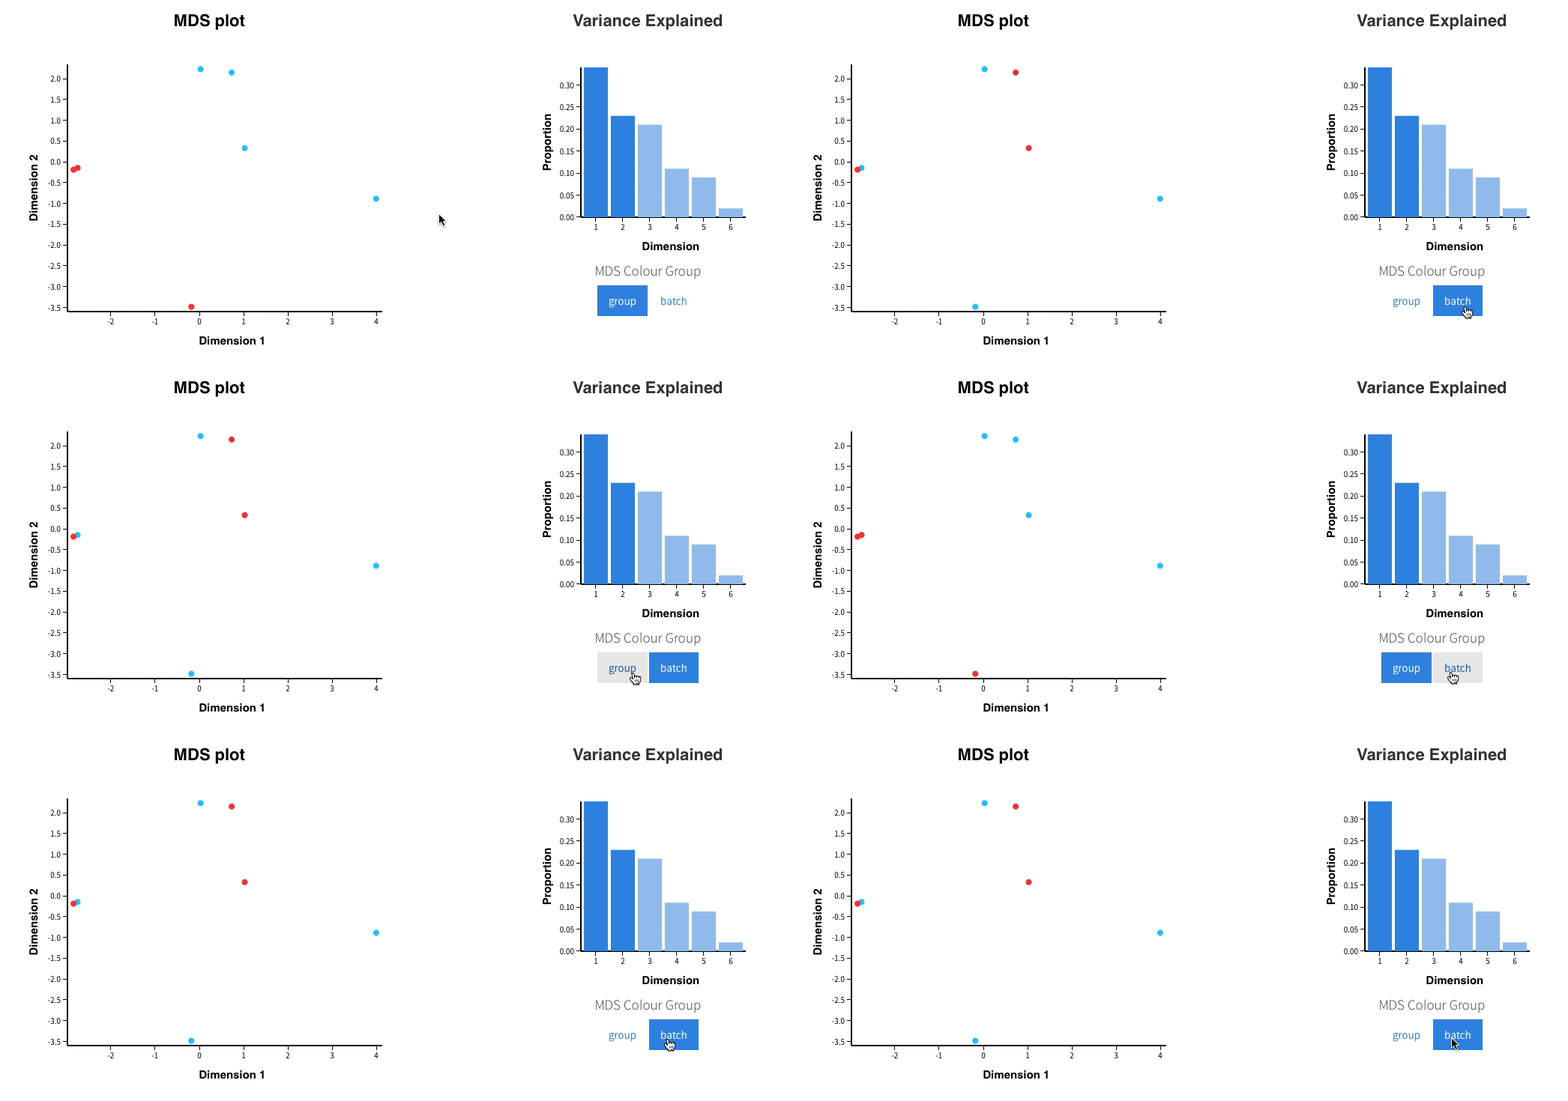
MDS Plots

Changing dimensions to plots

bar-click

Changing conditions to colour by

groups

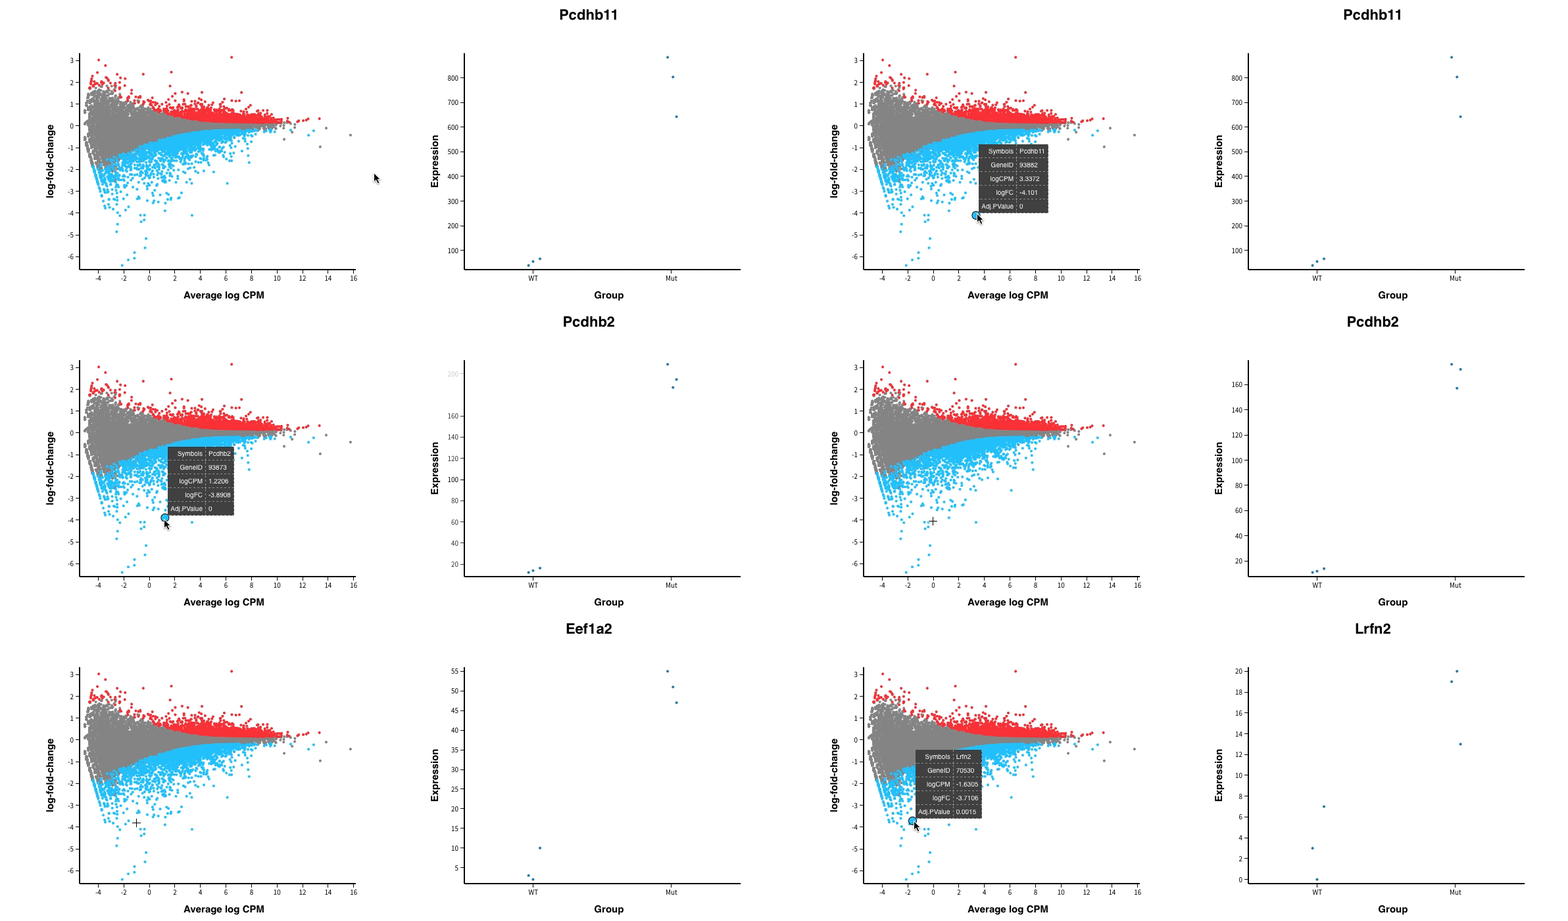
MD Plot

Hovering over points

points-hover

Clicking points

points-click

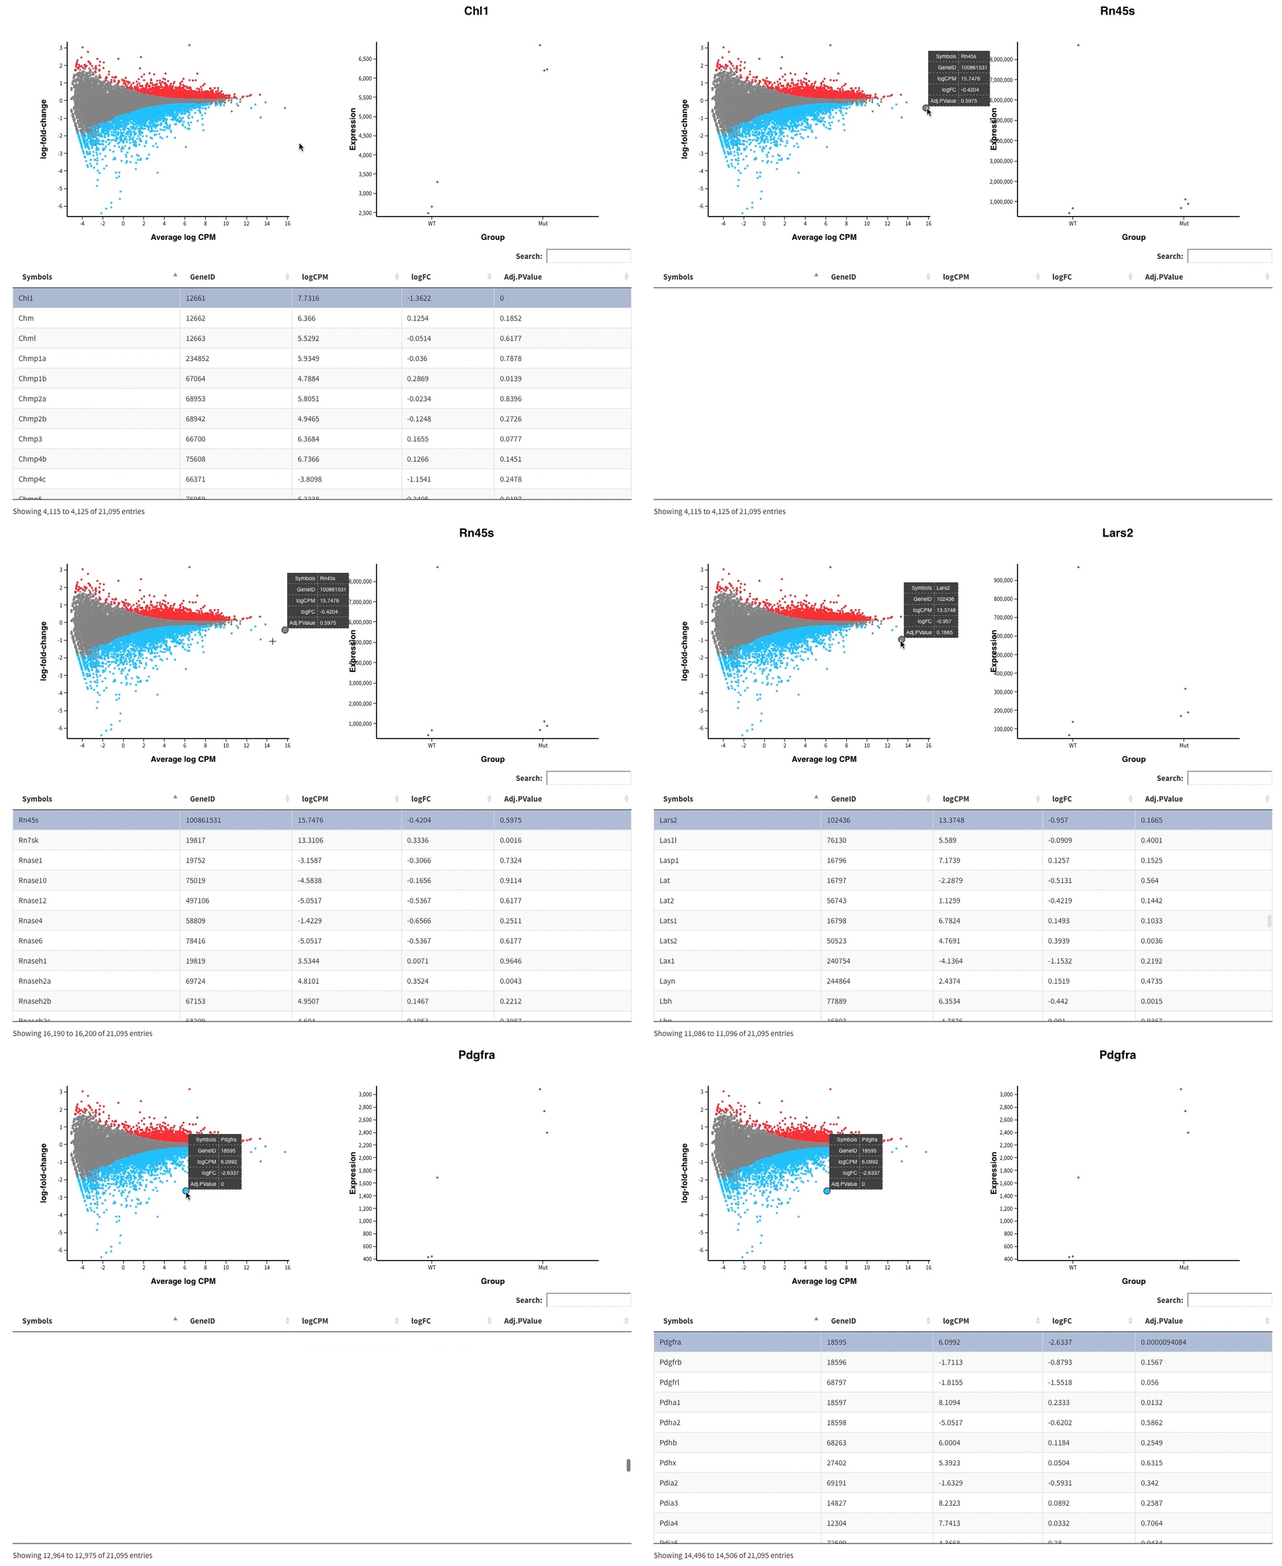
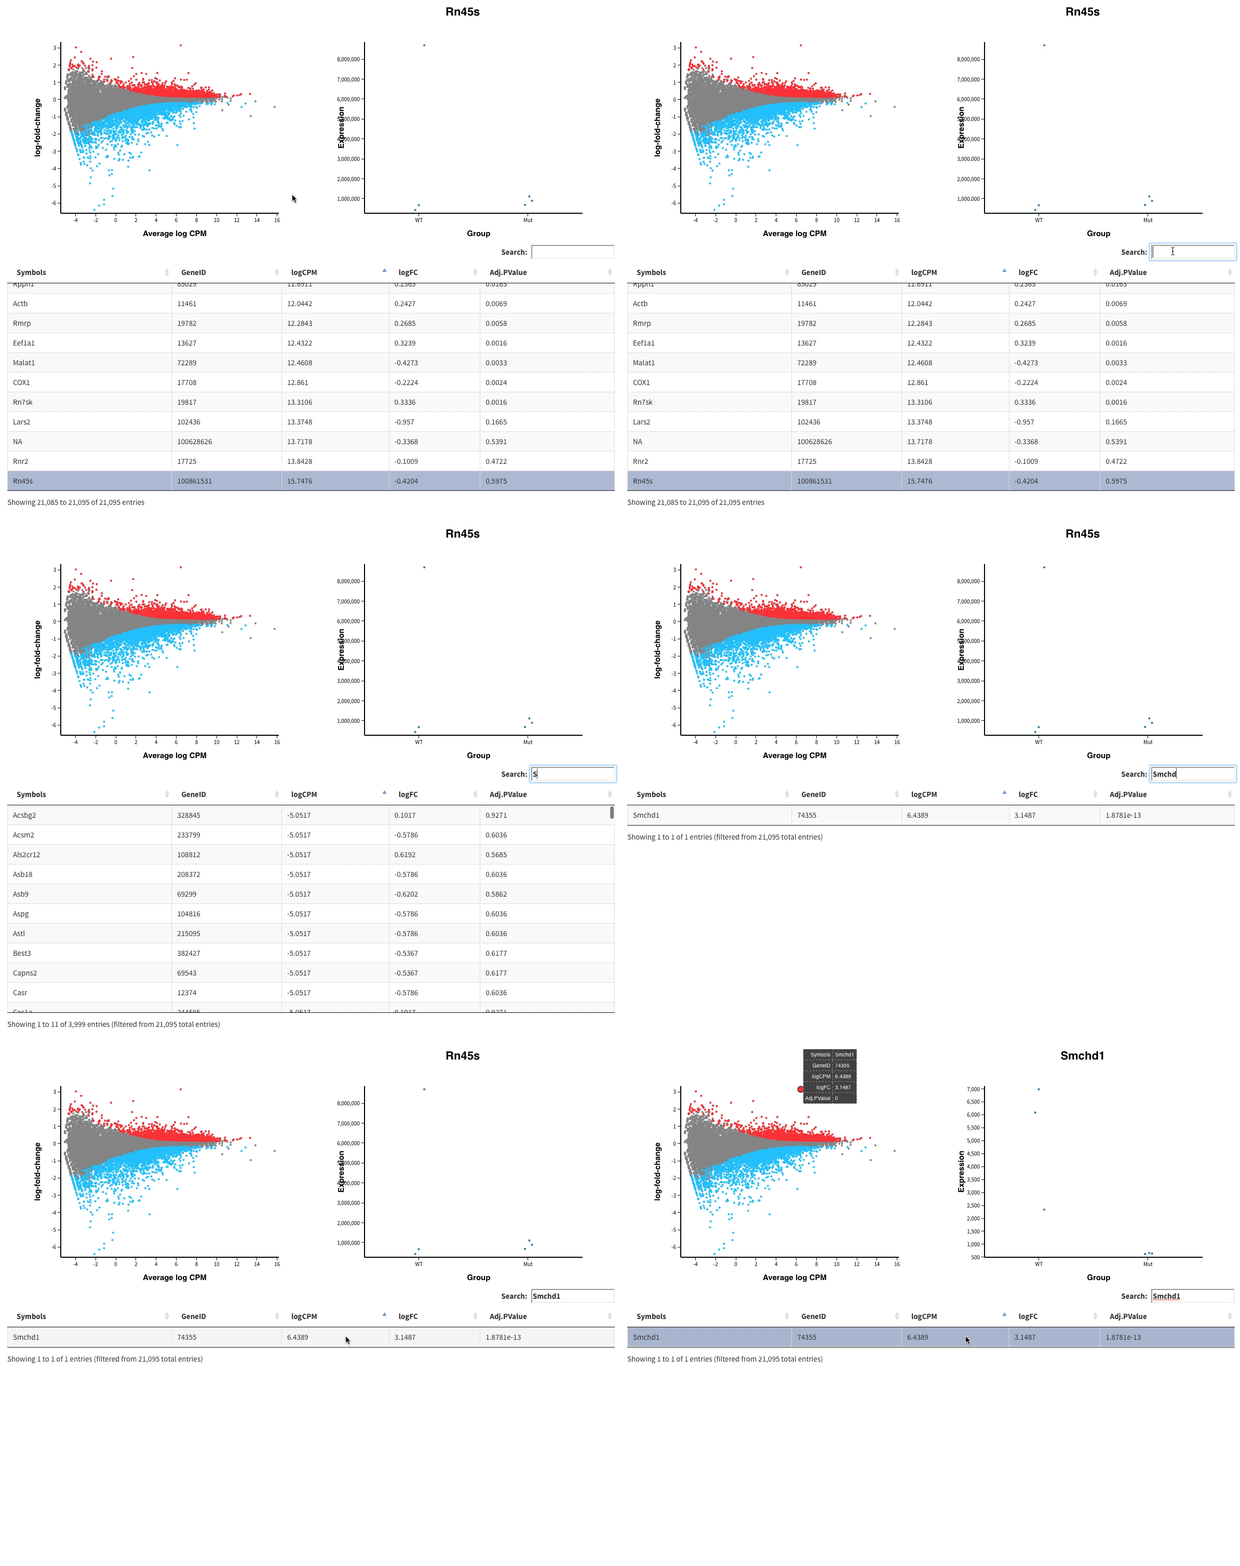
Clicking on table entries

table-click

Note that the project description data, including the texts, logos, images, and/or trademarks, for each open source project belongs to its rightful owner. If you wish to add or remove any projects, please contact us at [email protected].