gmplot / Gmplot
Licence: mit
Plot data on Google Maps, the easy way.
Stars: ✭ 668
Programming Languages
python
139335 projects - #7 most used programming language
Labels
Projects that are alternatives of or similar to Gmplot
Firebase-Realtime-Car-Moving-On-JavaScript-Google-Maps
This is the solution for moving realtime cars on Google Maps JavaScript using Google Firebase Realtime Database.
Stars: ✭ 26 (-96.11%)
Mutual labels: google-maps
Vue Googlemaps
Integrate Google Maps in your Vue application
Stars: ✭ 516 (-22.75%)
Mutual labels: google-maps
openapi-specification
OpenAPI specification for Google Maps Platform API
Stars: ✭ 27 (-95.96%)
Mutual labels: google-maps
Extramaputils
🌍 the simple utility for google maps in android
Stars: ✭ 293 (-56.14%)
Mutual labels: google-maps
Geo Golang
Go library to access geocoding and reverse geocoding APIs
Stars: ✭ 394 (-41.02%)
Mutual labels: google-maps
ionic3-google-maps-examples
Some examples of how to use google maps javascript API on a Ionic application and use HTML5 geolocation.
Stars: ✭ 24 (-96.41%)
Mutual labels: google-maps
Leku
🌍 Map location picker component for Android. Based on Google Maps. An alternative to Google Place Picker.
Stars: ✭ 612 (-8.38%)
Mutual labels: google-maps
Privacy Redirect
A simple web extension that redirects Twitter, YouTube, Instagram & Google Maps requests to privacy friendly alternatives.
Stars: ✭ 342 (-48.8%)
Mutual labels: google-maps
Xamarin.forms.googlemaps
Map library for Xamarin.Forms using Google maps API
Stars: ✭ 483 (-27.69%)
Mutual labels: google-maps
Photo Exif Toolkit
Photo Exif Toolkit Android app entirely written using Kotlin language
Stars: ✭ 37 (-94.46%)
Mutual labels: google-maps
Google Maps Clustering
Fast marker clustering library for Google Maps Android API.
Stars: ✭ 276 (-58.68%)
Mutual labels: google-maps
Trail Android
🚕 Simple, smooth animation for route / polylines on google maps using projections.
Stars: ✭ 465 (-30.39%)
Mutual labels: google-maps
polylineencoder
A C++ implementation of Google Encoded Polyline Algorithm Format (encoder/decoder)
Stars: ✭ 15 (-97.75%)
Mutual labels: google-maps
Flask Googlemaps
Easy way to add GoogleMaps to Flask applications. maintainer: @RiverFount
Stars: ✭ 550 (-17.66%)
Mutual labels: google-maps
event-jekyll-theme
Jekyll Theme package for your event
Stars: ✭ 119 (-82.19%)
Mutual labels: google-maps
Google Maps
Collection of Google Maps API Web Services for Laravel
Stars: ✭ 380 (-43.11%)
Mutual labels: google-maps
Heatmap.js
🔥 JavaScript Library for HTML5 canvas based heatmaps
Stars: ✭ 5,685 (+751.05%)
Mutual labels: google-maps
Snazzy Info Window
Customizable info windows using the Google Maps JavaScript API.
Stars: ✭ 560 (-16.17%)
Mutual labels: google-maps
Jquery Store Locator Plugin
A store locator plugin using Google Maps API version 3
Stars: ✭ 471 (-29.49%)
Mutual labels: google-maps
gmplot |PyVersions|_
.. |PyVersions| image:: https://img.shields.io/pypi/pyversions/gmplot?style=flat-square .. _PyVersions: https://www.python.org/
A matplotlib-like interface to render all the data you'd like on top of Google Maps.
Several plotting methods make creating exploratory map views effortless.
To install: pip install gmplot
Documentation (with examples): API Reference <https://github.com/gmplot/gmplot/wiki>_
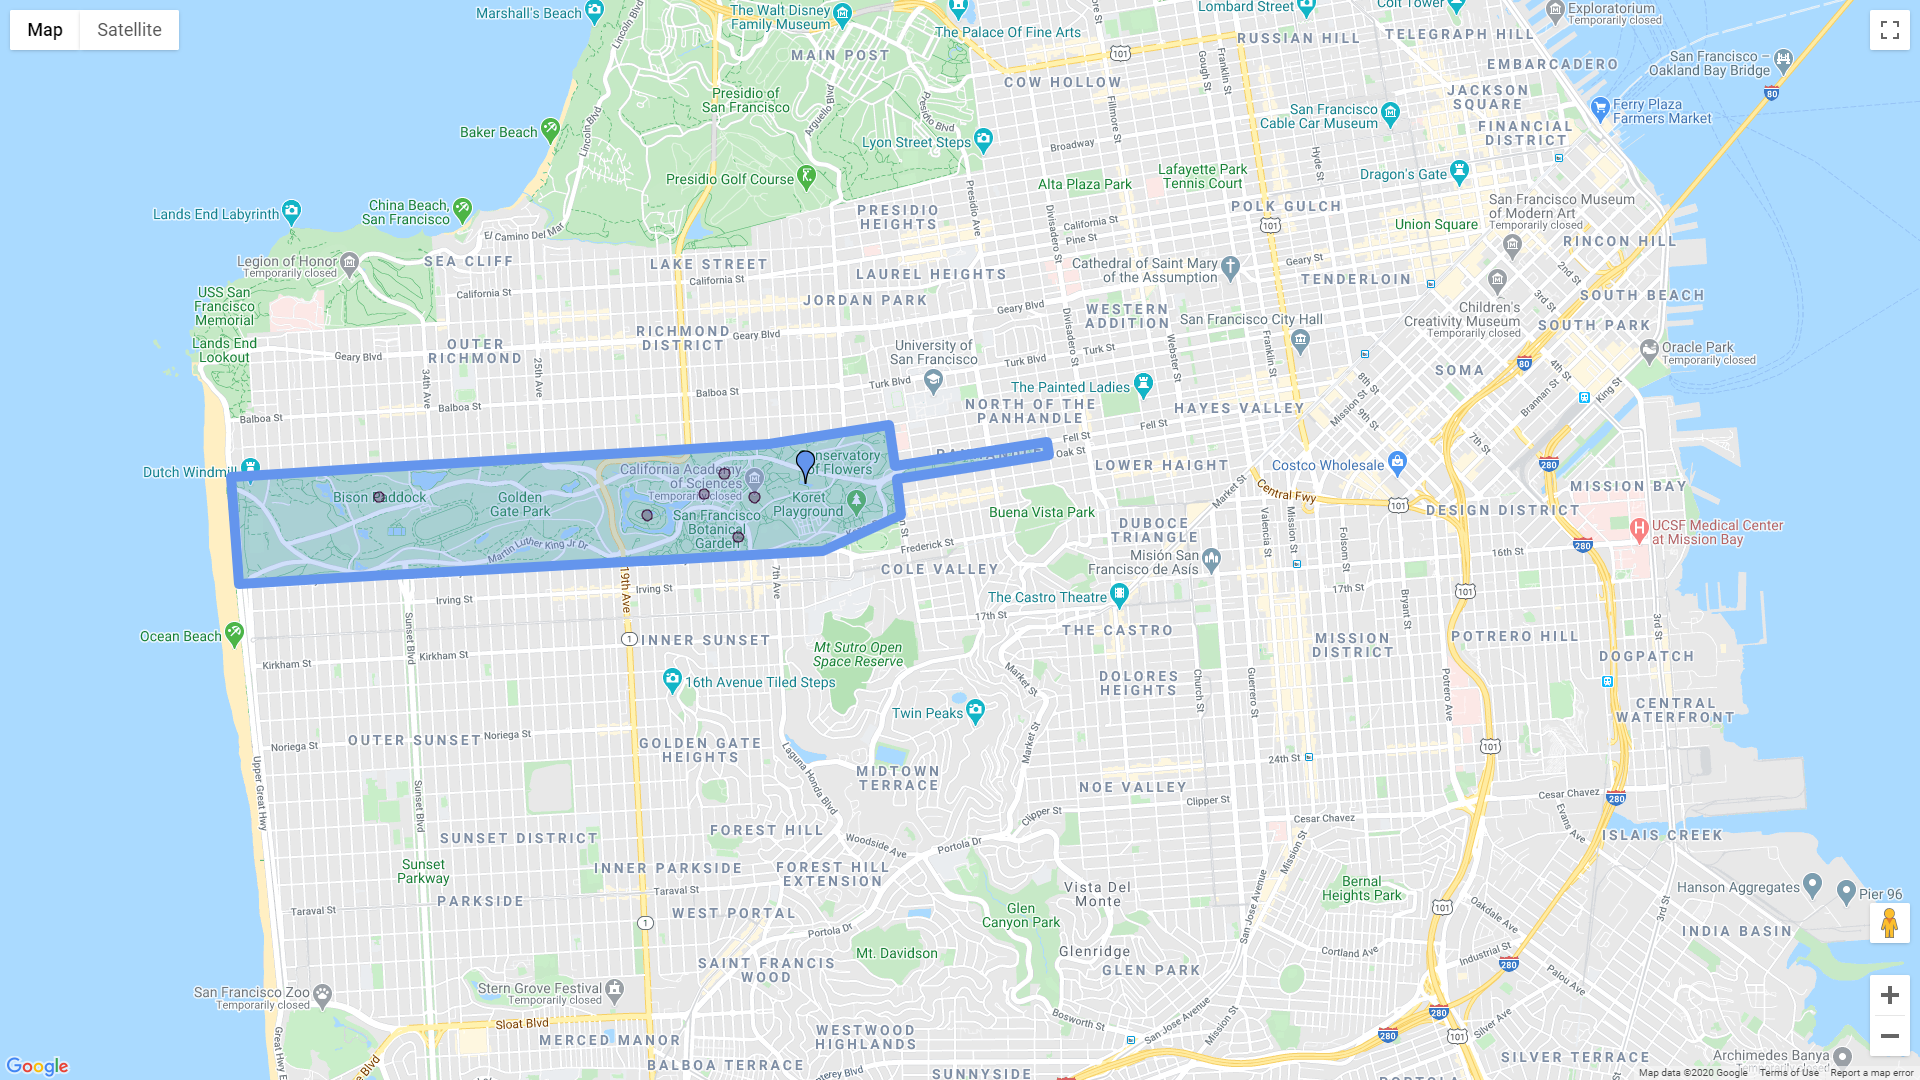
Crash course
.. code:: python
import gmplot

# Create the map plotter:
apikey = '' # (your API key here)
gmap = gmplot.GoogleMapPlotter(37.766956, -122.448481, 14, apikey=apikey)

# Mark a hidden gem:
gmap.marker(37.770776, -122.461689, color='cornflowerblue')

# Highlight some attractions:
attractions_lats, attractions_lngs = zip(*[
    (37.769901, -122.498331),
    (37.768645, -122.475328),
    (37.771478, -122.468677),
    (37.769867, -122.466102),
    (37.767187, -122.467496),
    (37.770104, -122.470436)
])
gmap.scatter(attractions_lats, attractions_lngs, color='#3B0B39', size=40, marker=False)

# Outline the Golden Gate Park:
golden_gate_park = zip(*[
    (37.771269, -122.511015),
    (37.773495, -122.464830),
    (37.774797, -122.454538),
    (37.771988, -122.454018),
    (37.773646, -122.440979),
    (37.772742, -122.440797),
    (37.771096, -122.453889),
    (37.768669, -122.453518),
    (37.766227, -122.460213),
    (37.764028, -122.510347)
])
gmap.polygon(*golden_gate_park, color='cornflowerblue', edge_width=10)

# Draw the map to an HTML file:
gmap.draw('map.html')
.. image:: https://raw.githubusercontent.com/gmplot/gmplot/master/docs/images/README_Example.png
Inspired by Yifei Jiang's ([email protected]) pygmaps <http://code.google.com/p/pygmaps/>_ module.
Note that the project description data, including the texts, logos, images, and/or trademarks,
for each open source project belongs to its rightful owner.
If you wish to add or remove any projects, please contact us at [email protected].