zieckey / Gochart
Licence: bsd-2-clause
A chart plotting tool implemented by Golang and Highcharts.
Stars: ✭ 293
Labels
Projects that are alternatives of or similar to Gochart
Aachartcore Kotlin
📈📊⛰⛰⛰An elegant modern declarative data visualization chart framework for Android . Extremely powerful, supports line, spline, area, areaspline, column, bar, pie, scatter, angular gauges, arearange, areasplinerange, columnrange, bubble, box plot, error bars, funnel, waterfall and polar chart types.极其精美而又强大的 Android 数据可视化图表框架,支持柱状图、条形图、折线图、曲线图、折线填充图、曲线填充图、气泡图、扇形图、环形图、散点图、雷达图、混合图等各种类型的多达几十种的信息图图表,完全满足工作所需.
Stars: ✭ 332 (+13.31%)
Mutual labels: plot, highcharts
Highcharts trendline
HighCharts demo of scatter plot, including a trend line
Stars: ✭ 79 (-73.04%)
Mutual labels: plot, highcharts
Highcharts Chart
Polymer Element wrapper for highcharts library. Seamlessly create various types of charts from one element.
Stars: ✭ 97 (-66.89%)
Mutual labels: plot, highcharts
QDashBoard
Sample dashboard developed with QML. Login, plots and several screens.
Stars: ✭ 34 (-88.4%)
Mutual labels: plot
excel2xx
导出 Excel 到结构化数据或代码 ( lua, c/c++, go 等等由你的 mako 模板决定 )
Stars: ✭ 14 (-95.22%)
Mutual labels: excel
Laravel Nova Excel
🚀 Supercharged Excel exports for Laravel Nova Resources
Stars: ✭ 259 (-11.6%)
Mutual labels: excel
Vincenty-Excel
Thaddeus Vincenty's Direct and Inverse formulae for geodesic calculations in Excel (distance, azimuth, latitude, longitude).
Stars: ✭ 29 (-90.1%)
Mutual labels: excel
Poiji
🍬 A tiny library converting excel rows to a list of Java objects based on Apache POI
Stars: ✭ 255 (-12.97%)
Mutual labels: excel
compareGroups
R package to easily build publication-ready univariate or bivariate descriptive tables from a data set.
Stars: ✭ 23 (-92.15%)
Mutual labels: plot
jupyterlab-spreadsheet-editor
JupyterLab spreadsheet editor for tabular data (e.g. csv, tsv)
Stars: ✭ 72 (-75.43%)
Mutual labels: excel
Unioffice
Pure go library for creating and processing Office Word (.docx), Excel (.xlsx) and Powerpoint (.pptx) documents
Stars: ✭ 3,111 (+961.77%)
Mutual labels: excel
Google-Data-Analytics-Professional-Certificate
Quizzes & Assignment Solutions for Google Data Analytics Professional Certificate on Coursera. Also included a few resources on side that I found helpful.
Stars: ✭ 19 (-93.52%)
Mutual labels: excel
phpspreadsheet-bundle
A Symfony bundle to integrate with PHPOffice's PhpSpreadsheet library
Stars: ✭ 47 (-83.96%)
Mutual labels: excel
LibPQ
Detach your M code from workbooks to reuse it! Import modules from local or web storage (unlimited number of sources)
Stars: ✭ 55 (-81.23%)
Mutual labels: excel
Pymeasure
Scientific measurement library for instruments, experiments, and live-plotting
Stars: ✭ 255 (-12.97%)
Mutual labels: plot
gochart
gochart is a chart ploting tool which is simple to use. It used the open sources golang and highcharts which is modeled after goplot. It can plot spline/line/area/bar/column/pie. This tool is just a binary independent with any other lib or environment.
Dependent
Install from resource
- Install go
- Execute the command :
go get -u github.com/zieckey/gochart
Usage
- Download the binary tar.gz file and untar it. Enter the gochart directory, you can see an executable file
gochartand some *.chart files. This chart files are the example data files. Execute the exegochart, then you can open your browser and navigate to http://localhost:8000, and now you can see the charts. - You can put
gochartto yourPATHenvironment and executegochartin the directory which holds *.chart files. If you have several *.chart files, you can refresh the web page to plot diffrent chart.
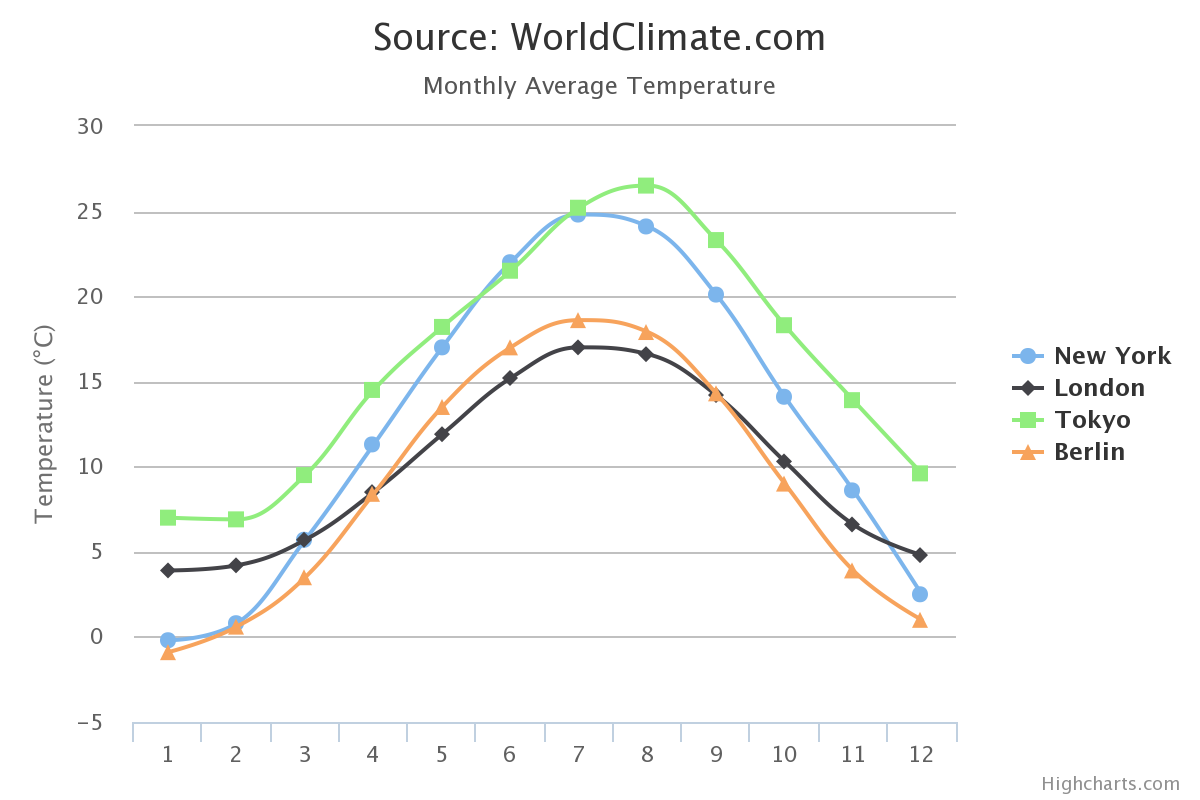
Example 1 : Spline data format
This data format can be also used to plot line/bar/column/area when you can change the value of ChartType. The option value of ChartType is below :
- spline
- line
- bar
- column
- area
# The chart type , option : spline/line/bar/column/area
ChartType = spline
Title = Source: WorldClimate.com
SubTitle = Monthly Average Temperature
ValueSuffix = °C

# The height (px) of the chart
Height = 400

# The x Axis numbers. The count this numbers MUST be the same with the data series
XAxisNumbers = 1, 2, 3, 4, 5, 6, 7, 8, 9, 10, 11, 12

# The y Axis text
YAxisText = Temperature (°C)

# The data and the name of the lines
Data|Tokyo = 7.0, 6.9, 9.5, 14.5, 18.2, 21.5, 25.2, 26.5, 23.3, 18.3, 13.9, 9.6
Data|New York = -0.2, 0.8, 5.7, 11.3, 17.0, 22.0, 24.8, 24.1, 20.1, 14.1, 8.6, 2.5
Data|Berlin = -0.9, 0.6, 3.5, 8.4, 13.5, 17.0, 18.6, 17.9, 14.3, 9.0, 3.9, 1.0
Data|London = 3.9, 4.2, 5.7, 8.5, 11.9, 15.2, 17.0, 16.6, 14.2, 10.3, 6.6, 4.8
Example 1 : Pie chart
ChartType  = pie
Title 	   = Browser market shares at a specific website, 2014
SubTitle   = from website.com
SeriesName = Browser shares

# The data and the name of the pieces of the pie
Data|Firefox = 45.0
Data|IE 	 = 26.8
Data|Chrome  = 12.8
Data|Safari  = 8.5
Data|Opera   = 6.2
Data|Others  = 0.7
Spline
Pie
Column
Line
Bar
Note that the project description data, including the texts, logos, images, and/or trademarks,
for each open source project belongs to its rightful owner.
If you wish to add or remove any projects, please contact us at [email protected].


