virtualstaticvoid / Highcharts_trendline
Licence: mit
HighCharts demo of scatter plot, including a trend line
Stars: ✭ 79
Programming Languages
javascript
184084 projects - #8 most used programming language
Projects that are alternatives of or similar to Highcharts trendline
Aachartcore Kotlin
📈📊⛰⛰⛰An elegant modern declarative data visualization chart framework for Android . Extremely powerful, supports line, spline, area, areaspline, column, bar, pie, scatter, angular gauges, arearange, areasplinerange, columnrange, bubble, box plot, error bars, funnel, waterfall and polar chart types.极其精美而又强大的 Android 数据可视化图表框架,支持柱状图、条形图、折线图、曲线图、折线填充图、曲线填充图、气泡图、扇形图、环形图、散点图、雷达图、混合图等各种类型的多达几十种的信息图图表,完全满足工作所需.
Stars: ✭ 332 (+320.25%)
Mutual labels: chart, plot, highcharts
Highcharts Chart
Polymer Element wrapper for highcharts library. Seamlessly create various types of charts from one element.
Stars: ✭ 97 (+22.78%)
Mutual labels: chart, plot, highcharts
React Jsx Highcharts
Highcharts built with proper React components
Stars: ✭ 336 (+325.32%)
Mutual labels: chart, highcharts
SwiftCharts
Easy to use and highly customizable charts library for iOS
Stars: ✭ 2,405 (+2944.3%)
Mutual labels: chart, plot
Gochart
A chart plotting tool implemented by Golang and Highcharts.
Stars: ✭ 293 (+270.89%)
Mutual labels: plot, highcharts
Aachartkit
📈📊🚀🚀🚀An elegant modern declarative data visualization chart framework for iOS, iPadOS and macOS. Extremely powerful, supports line, spline, area, areaspline, column, bar, pie, scatter, angular gauges, arearange, areasplinerange, columnrange, bubble, box plot, error bars, funnel, waterfall and polar chart types. 极其精美而又强大的跨平台数据可视化图表框架,支持柱状图、条形图、折…
Stars: ✭ 4,358 (+5416.46%)
Mutual labels: chart, highcharts
Ttyplot
a realtime plotting utility for terminal/console with data input from stdin
Stars: ✭ 532 (+573.42%)
Mutual labels: chart, plot
Asciichart
Nice-looking lightweight console ASCII line charts ╭┈╯ for NodeJS, browsers and terminal, no dependencies
Stars: ✭ 1,107 (+1301.27%)
Mutual labels: chart, plot
chart
📊📉 Add beautiful and reusable charts with one line of ruby for Rails 5.x
Stars: ✭ 42 (-46.84%)
Mutual labels: chart, highcharts
Angular Highcharts
Highcharts directive for Angular
Stars: ✭ 202 (+155.7%)
Mutual labels: chart, highcharts
Uplot
📈 A small, fast chart for time series, lines, areas, ohlc & bars
Stars: ✭ 6,808 (+8517.72%)
Mutual labels: chart, plot
Charts
⚡ Laravel Charts — Build charts using laravel. The laravel adapter for Chartisan.
Stars: ✭ 2,337 (+2858.23%)
Mutual labels: chart, plot
Swiftcharts
Easy to use and highly customizable charts library for iOS
Stars: ✭ 2,336 (+2856.96%)
Mutual labels: chart, plot
Aachartcore
📈📊☕️☕️☕️An elegant modern declarative data visualization chart framework for Android. Extremely powerful, supports line, spline, area, areaspline, column, bar, pie, scatter, angular gauges, arearange, areasplinerange, columnrange, bubble, box plot, error bars, funnel, waterfall and polar chart types.极其精美而又强大的 Android 数据可视化图表框架,支持柱状图、条形图、折线图、曲线图、折线填充图、曲线填充图、气泡图、扇形图、环形图、散点图、雷达图、混合图等各种类型的多达几十种的信息图图表,完全满足工作所需.
Stars: ✭ 424 (+436.71%)
Mutual labels: chart, highcharts
Highcharts Trendline Example
This project illustrates how you can easily add a trendline to your Highchart charts.
Note: If you are looking for a more complete implementation, checkout the highcharts-regression plugin.
Usage
Include the regression.js script into your HTML page.
Given your source data array, supply a function which calls fitData(<source>).data to produce the regression data for the trendline.
E.g.
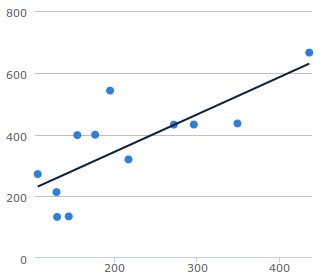
// E.g. source data
var sourceData = [
    [106.4, 271.8], [129.2, 213.4],
    [295.6, 432.3], [154.4, 398.1],
    [129.9, 133.2], [271.5, 432.1],
    [144.0, 134.7], [176.0, 399.2],
    [216.4, 319.2], [194.1, 542.1],
    [435.6, 665.3], [348.5, 435.9]
];

var chart_linear = new Highcharts.Chart({
    chart: {
      renderTo: 'linear'
    },
    plotOptions: {
      series: {
        enableMouseTracking: false
      }
    },
    series: [{
      type: 'scatter',
      data: sourceData
    },
    {
      type: 'line',
      marker: { enabled: false },
      /* function returns data for trend-line */
      data: (function() {
        return fitData(sourceData).data;
      })()
    }]
});
Examples
Checkout the demo HTML files for examples of how to plot various trendlines.
-
-
Linear Regression - One dimensional data
-
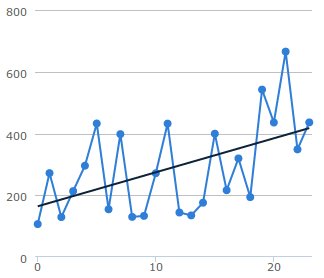
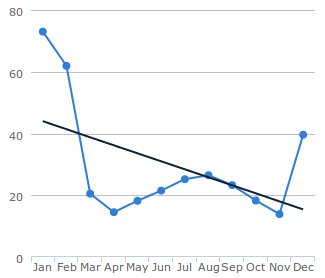
Line Regression (X axis set to category)
-
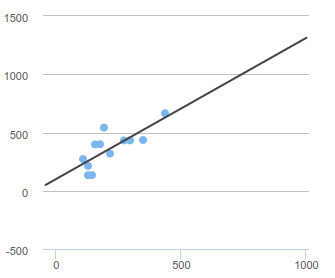
Linear Regression - With Projection


Credits
The code for the regression.js script was extracted from jqplot.trendline.js, by Chris Leonello.
Note that the project description data, including the texts, logos, images, and/or trademarks,
for each open source project belongs to its rightful owner.
If you wish to add or remove any projects, please contact us at [email protected].