sraoss / Grafana Sunburst Panel
Licence: other
Sunburst panel plugin for Grafana 3.0+
Stars: ✭ 24
Programming Languages
javascript
184084 projects - #8 most used programming language
Projects that are alternatives of or similar to Grafana Sunburst Panel
Prometheus
Kubernetes Setup for Prometheus and Grafana
Stars: ✭ 824 (+3333.33%)
Mutual labels: grafana
D3fc
A collection of components that make it easy to build interactive charts with D3
Stars: ✭ 898 (+3641.67%)
Mutual labels: d3
Varken
Standalone application to aggregate data from the Plex ecosystem into InfluxDB using Grafana for a frontend
Stars: ✭ 829 (+3354.17%)
Mutual labels: grafana
Party Mode
An experimental music visualizer using d3.js and the web audio api.
Stars: ✭ 690 (+2775%)
Mutual labels: d3
D3 Dot Graph
This module provides D3js compatible library to parse and load files in graphviz DOT (.dot) (graph description language) format.
Stars: ✭ 23 (-4.17%)
Mutual labels: d3
Spring Petclinic Microservices
Distributed version of Spring Petclinic built with Spring Cloud
Stars: ✭ 814 (+3291.67%)
Mutual labels: grafana
Snow Grafana Proxy
Connector for grafana simple-json data source and ServiceNow incidents retieved over ServiceNow API
Stars: ✭ 18 (-25%)
Mutual labels: grafana
Rickshaw
JavaScript toolkit for creating interactive real-time graphs
Stars: ✭ 6,506 (+27008.33%)
Mutual labels: d3
Angular D3 Word Cloud
angular directive of D3 word cloud plugin, include simple options to binding.
Stars: ✭ 17 (-29.17%)
Mutual labels: d3
D3 Graphviz
Graphviz DOT rendering and animated transitions using D3
Stars: ✭ 901 (+3654.17%)
Mutual labels: d3
D3 Annotation
Use d3-annotation with built-in annotation types, or extend it to make custom annotations. It is made for d3-v4 in SVG.
Stars: ✭ 693 (+2787.5%)
Mutual labels: d3
Prometheusalert
Prometheus Alert是开源的运维告警中心消息转发系统,支持主流的监控系统Prometheus,Zabbix,日志系统Graylog和数据可视化系统Grafana发出的预警消息,支持钉钉,微信,华为云短信,腾讯云短信,腾讯云电话,阿里云短信,阿里云电话等
Stars: ✭ 822 (+3325%)
Mutual labels: grafana
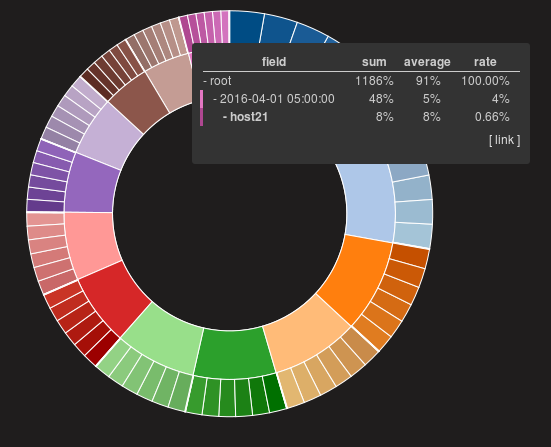
grafana-sunburst-panel
The sunburst panel is a multi-level pie chart. It can contain hierarchical data.
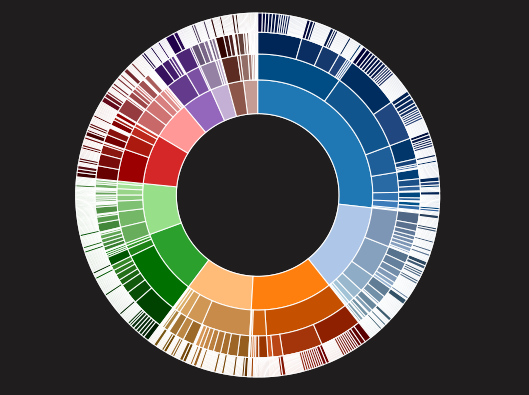
Features
Tooltip
Tooltip is shown on mouse over of each arch node. Tooltip of a node shows information about same-leveled nodes and its child nodes.
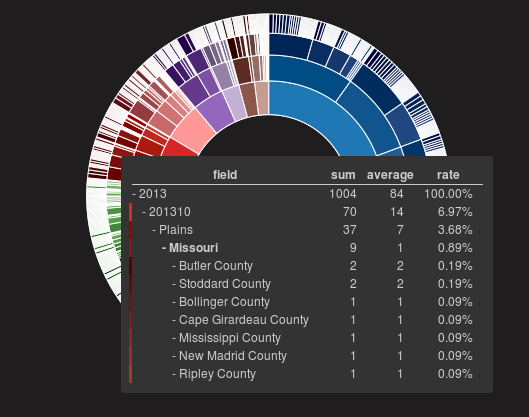
| Description | |
|---|---|
| sum | The value of a node. If the node has children, the value of the node means sum of the values of its children. |
| average | If the node has children, the value of the node means average of the values of its children. |
| rate | The rate against the value of parent node. |
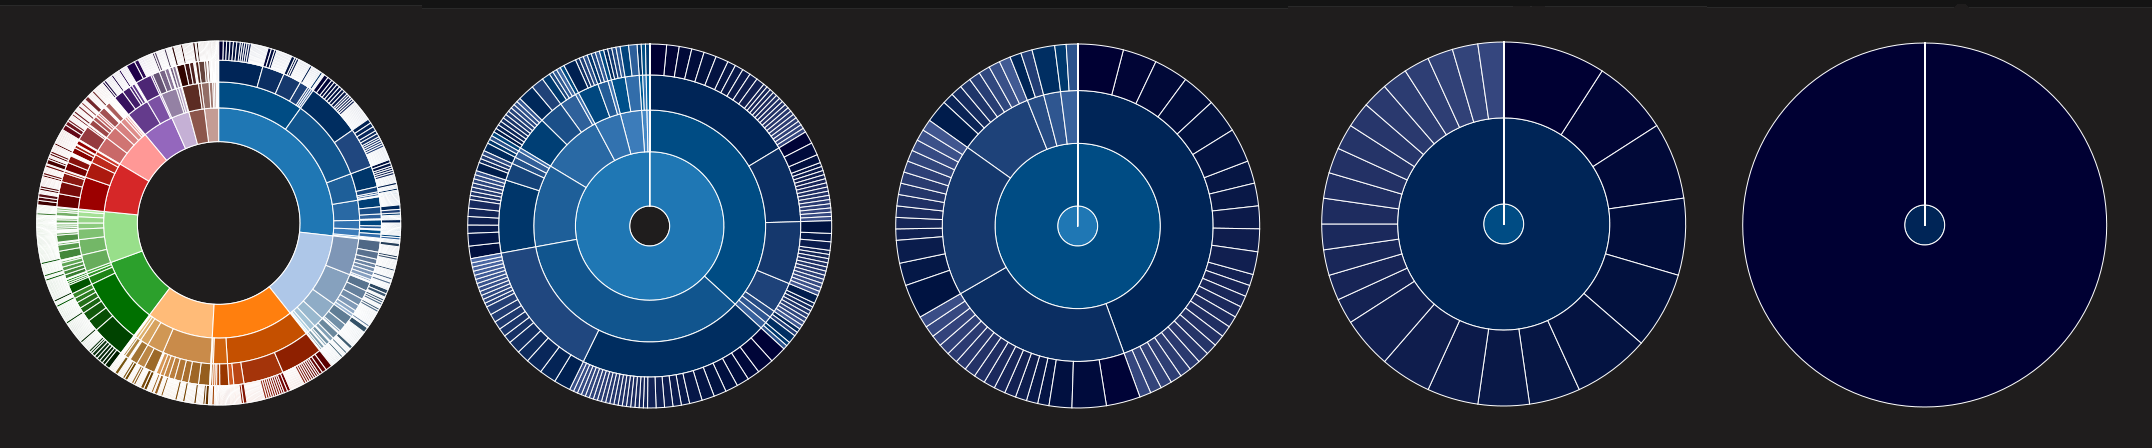
Drill down
If you click an node in the graph, the graph transforms to zoom and show the child nodes.
Options
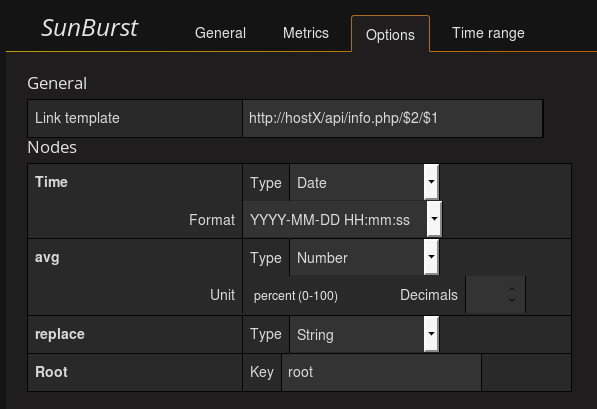
Link template
If link template isn't blank, tooltip contains a link with values of node and its ancectors. You can use $1, $2, $3 ... to add values to the link.
Nodes
You can specify fields' types of a node.
| Description | |
|---|---|
| Number | Add unit (%, $, bits/sec, ...) |
| String | Do nothing and just display. |
| Date | Convert numbers as unix timestamp to date text in specified format. |
Ex.)
Supported datasources and formats
| Data source | TimeSeries | Table | Docs |
|---|---|---|---|
| ElasticSearch | OK | -- | OK |
| InfluxDB | OK | OK | -- |
| Sqldb (not released) | OK | OK | OK |
- Docs is the format returned by terms-aggregation in ElasticSearch.
License
Apache V2.0 License
Note that the project description data, including the texts, logos, images, and/or trademarks,
for each open source project belongs to its rightful owner.
If you wish to add or remove any projects, please contact us at [email protected].