All Projects → C-JSN → D3 Id3

C-JSN / D3 Id3

Licence: mit
iD3: an Integrated Development Environment for D3.js

Programming Languages

javascript
184084 projects - #8 most used programming language
python
139335 projects - #7 most used programming language

Projects that are alternatives of or similar to D3 Id3

React Plotly.js
A plotly.js React component from Plotly 📈
Stars: ✭ 701 (-11.15%)
Mutual labels:  data-visualization, d3
Floweaver
View flow data as Sankey diagrams
Stars: ✭ 266 (-66.29%)
Mutual labels:  data-visualization, d3
Keen Dataviz.js
Data Visualization Charting Library
Stars: ✭ 215 (-72.75%)
Mutual labels:  data-visualization, d3
Semiotic
A data visualization framework combining React & D3
Stars: ✭ 2,207 (+179.72%)
Mutual labels:  data-visualization, d3
Anichart.js
Easily create data visualization animation videos
Stars: ✭ 480 (-39.16%)
Mutual labels:  data-visualization, d3
Visx
🐯 visx | visualization components
Stars: ✭ 14,544 (+1743.35%)
Mutual labels:  data-visualization, d3
Plotly Graphing Library For Matlab
Plotly Graphing Library for MATLAB®
Stars: ✭ 234 (-70.34%)
Mutual labels:  data-visualization, d3
Just Dashboard
📊 📋 Dashboards using YAML or JSON files
Stars: ✭ 1,511 (+91.51%)
Mutual labels:  data-visualization, d3
Py d3
D3 block magic for Jupyter notebook.
Stars: ✭ 428 (-45.75%)
Mutual labels:  data-visualization, d3
Britecharts
Client-side reusable Charting Library based on D3.js v5 that allows easy and intuitive use of charts and components that can be composed together creating amazing visualizations.
Stars: ✭ 3,688 (+367.43%)
Mutual labels:  data-visualization, d3
Calendar Heatmap
A d3 heatmap for representing time series data similar to github's contribution chart
Stars: ✭ 1,985 (+151.58%)
Mutual labels:  data-visualization, d3
D3 Node
Server-side D3 for static chart/map generation ✨📊
Stars: ✭ 606 (-23.19%)
Mutual labels:  data-visualization, d3
Victory Native
victory components for react native
Stars: ✭ 2,013 (+155.13%)
Mutual labels:  data-visualization, d3
Plotly.js
Open-source JavaScript charting library behind Plotly and Dash
Stars: ✭ 14,268 (+1708.37%)
Mutual labels:  data-visualization, d3
Electricitymap Contrib
A real-time visualisation of the CO2 emissions of electricity consumption
Stars: ✭ 2,138 (+170.98%)
Mutual labels:  data-visualization, d3
Reaviz
📊 Data visualization library for React based on D3
Stars: ✭ 215 (-72.75%)
Mutual labels:  data-visualization, d3
C3
📊 A D3-based reusable chart library
Stars: ✭ 9,163 (+1061.34%)
Mutual labels:  data-visualization, d3
Logation
Analyse your NGINX access logs and create beautiful maps of the locations from which people access your service.
Stars: ✭ 99 (-87.45%)
Mutual labels:  data-visualization, d3
Victory Chart
Chart Component for Victory
Stars: ✭ 286 (-63.75%)
Mutual labels:  data-visualization, d3
Historical Ranking Data Visualization Based On D3.js
这是一个数据可视化项目,能够将历史数据排名转化为动态柱状图图表
Stars: ✭ 4,649 (+489.23%)
Mutual labels:  data-visualization, d3

d3-id3

iD3 - an IDE dedicated for development in D3.js

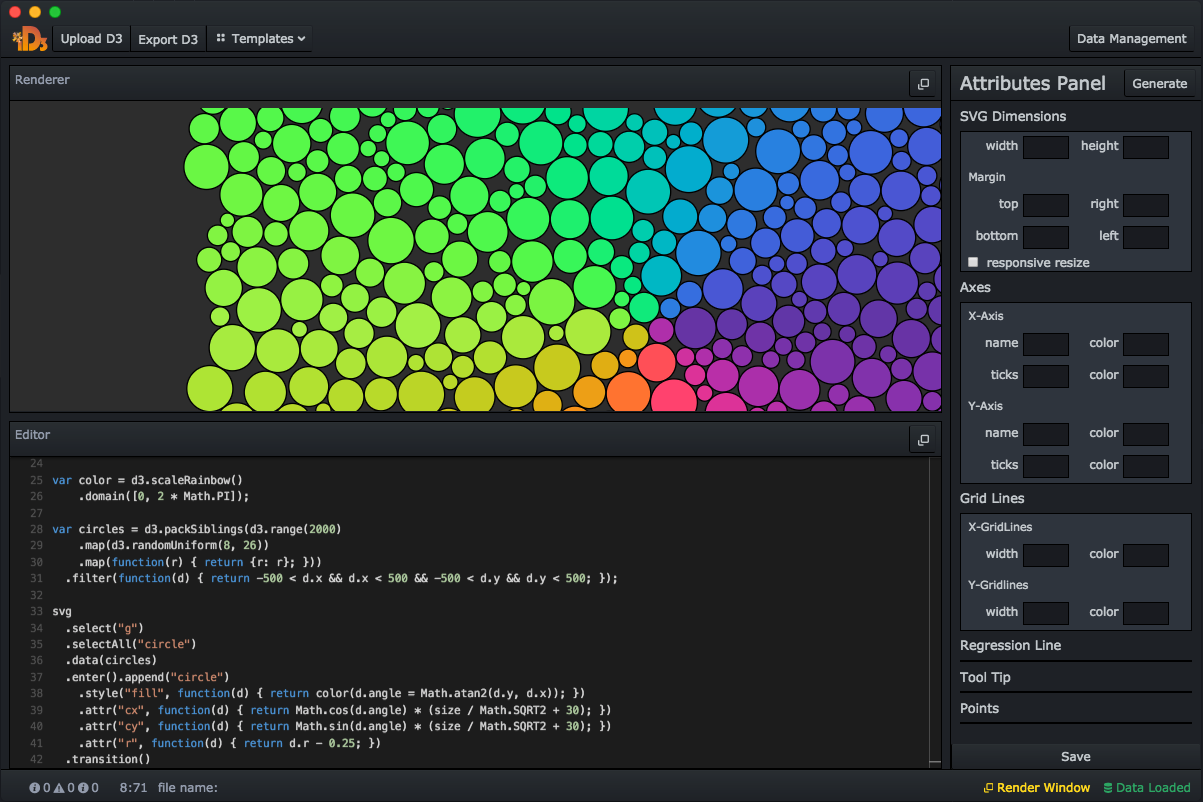
iD3 is an open-source, cross-platform desktop application geared to simplify data visualization with D3 for non-JavaScript and JavaScript data scientists and analysts. With our integrated Python based data management system and custom generated attribute controls, iD3 supports the full process from importing your data to exporting your final presentation.

iD3 is in active development. Please follow this repo for contribution guidelines and upcoming updates.

iD3 Screenshot

To Use

Fork or download

# Clone this repository
git clone https://github.com/C-JSN/D3-ID3.git
# Go into the repository
cd D3-ID3
# Install dependencies
npm install  
# Run webpack
npm run webpack
# Run the app  
npm start  

Please make sure you have Python 3.6 installed. Click here to install Python 3.6

Keyboard shortcuts:

ctrl + s (main app editor) = run code and render
ctrl + s (data management editor) = run code

Take control of your visualization

Upload your own D3 code and see it visualized immediately on the Renderer. Modify your data visualization straight in the editor, or through the custom generated attribute controls to your right and see your changes reflected in the Renderer as you go.

New to D3? Use a Template

Select a template from our library and start creating right away.

Export files

Export your finalized code to be used on your other projects!

Note: Refresh the Attribute Panel by clicking Generate Attr when you upload a new file or run a new template

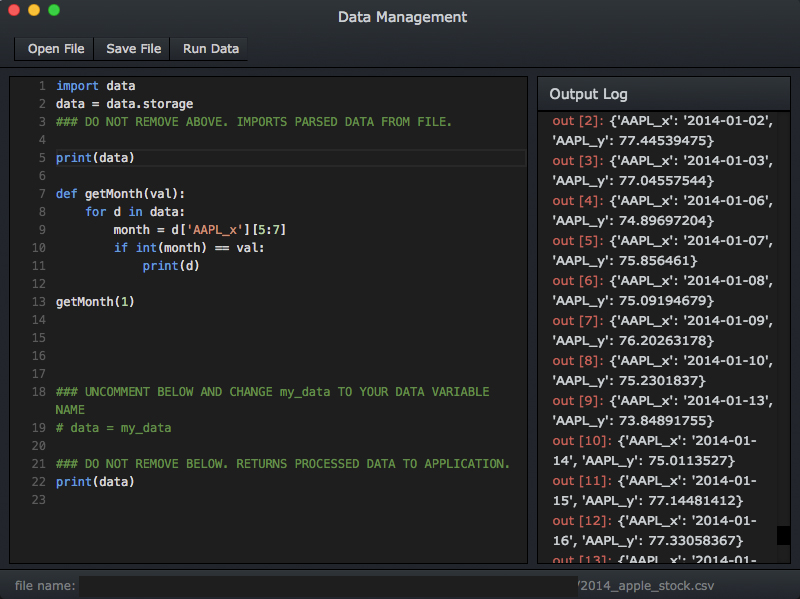
iD3 Data Management

Manage your data

Use your custom data processing algorithms on top of D3's built-in functions with our integrated Python based data management system. This system allows you to feed your .csv or .json files through your personal Python script and check your data in the print statement window before sending it back to the main application to render in your visualization.

Resources

Find us on www.d3-id3.com
Special thanks to Mike Bostock for creating D3.js

Contributors

Christian Pascual | Jeffrey Ma | Steve Meads | Naomi Lai

Note that the project description data, including the texts, logos, images, and/or trademarks, for each open source project belongs to its rightful owner. If you wish to add or remove any projects, please contact us at [email protected].