epickrram / Grav
Programming Languages
Projects that are alternatives of or similar to Grav
grav
A collection of tools to help visualise process execution.
This blog post has some detail on the rationale and implementation detail.
Scheduler profile
Visual cues to inform whether your application's threads are being pre-empted by the kernel scheduler before they are ready to yield the processor.
Pre-requisites: install iovisor BCC
Usage:
$ ./bin/scheduling-profile.sh $PID
Recording scheduling information for 10 seconds
Wrote scheduler-profile-$PID.svg
CPU tenancy
Determine whether application threads would be better restricted to a certain set of CPUs.
Pre-requisites: install perf_events
Usage:
$ ./bin/perf-cpu-tenancy.sh $PID
Recording samples..
Wrote cpu-tenancy-$PID.svg
JVM heap allocation flamegraphs
Use built-in UDST DTrace probes to capture information about heap allocations in a running JVM.
Pre-requisites: the following repositories need to be cloned and available locally:
Enable allocation probes using the following JVM params:
-XX:+DTraceAllocProbes
Usage:
# set up environment variables
$ export PERF_MAP_AGENT_DIR=/path/to/perf-map-agent/
$ export FLAMEGRAPH_DIR=/path/to/flamegraph/
$ ./bin/heap-alloc-flames -p $PID -e "java/lang/String" -d 10
Profiling application to generate stack trace symbols
Recording events for 5 seconds (adapt by setting PERF_RECORD_SECONDS)
[ perf record: Woken up 3 times to write data ]
[ perf record: Captured and wrote 1.156 MB /tmp/perf-$PID.data (3498 samples) ]
Wrote allocation-flamegraph-$PID.svg
Parameters:
-p PID
-i regex of stacks to include (e.g. -i "mycompany" "java/lang/Double")
-e regex of stacks to exclude (e.g. -e "java/lang/String" "C[]")
-d duration of sample in seconds
-s sampling interval (e.g. -s 1000 -> sample every 1000th allocation)
-j path of libjvm.so (default: /usr/lib/jvm/java-8-openjdk-amd64/jre/lib/amd64/server/libjvm.so)
Java flamegraphs with thread name
Annotate JVM flamegraphs with thread names for easier focus.
Pre-requisites: the following repositories need to be cloned and available locally:
Usage:
# set up environment variables
$ export PERF_MAP_AGENT_DIR=/path/to/perf-map-agent/
$ export FLAMEGRAPH_DIR=/path/to/flamegraph/
$ ./bin/perf-thread-flames.sh $PID
Recording events for 10 seconds (adapt by setting PERF_RECORD_SECONDS)
[ perf record: Woken up 1 times to write data ]
[ perf record: Captured and wrote 0.343 MB /tmp/perf-$PID.data (835 samples) ]
Wrote flamegraph-$PID.svg
To filter out particular threads, supply a regex as the second argument:
$ ./bin/perf-thread-flames.sh $PID ".*GC.*"
Capturing stacks for threads matching '.*GC.*'
Recording events for 10 seconds (adapt by setting PERF_RECORD_SECONDS)
[ perf record: Woken up 7 times to write data ]
[ perf record: Captured and wrote 1.026 MB /tmp/perf-$PID.data (496 samples) ]
Wrote flamegraph-$PID.svg
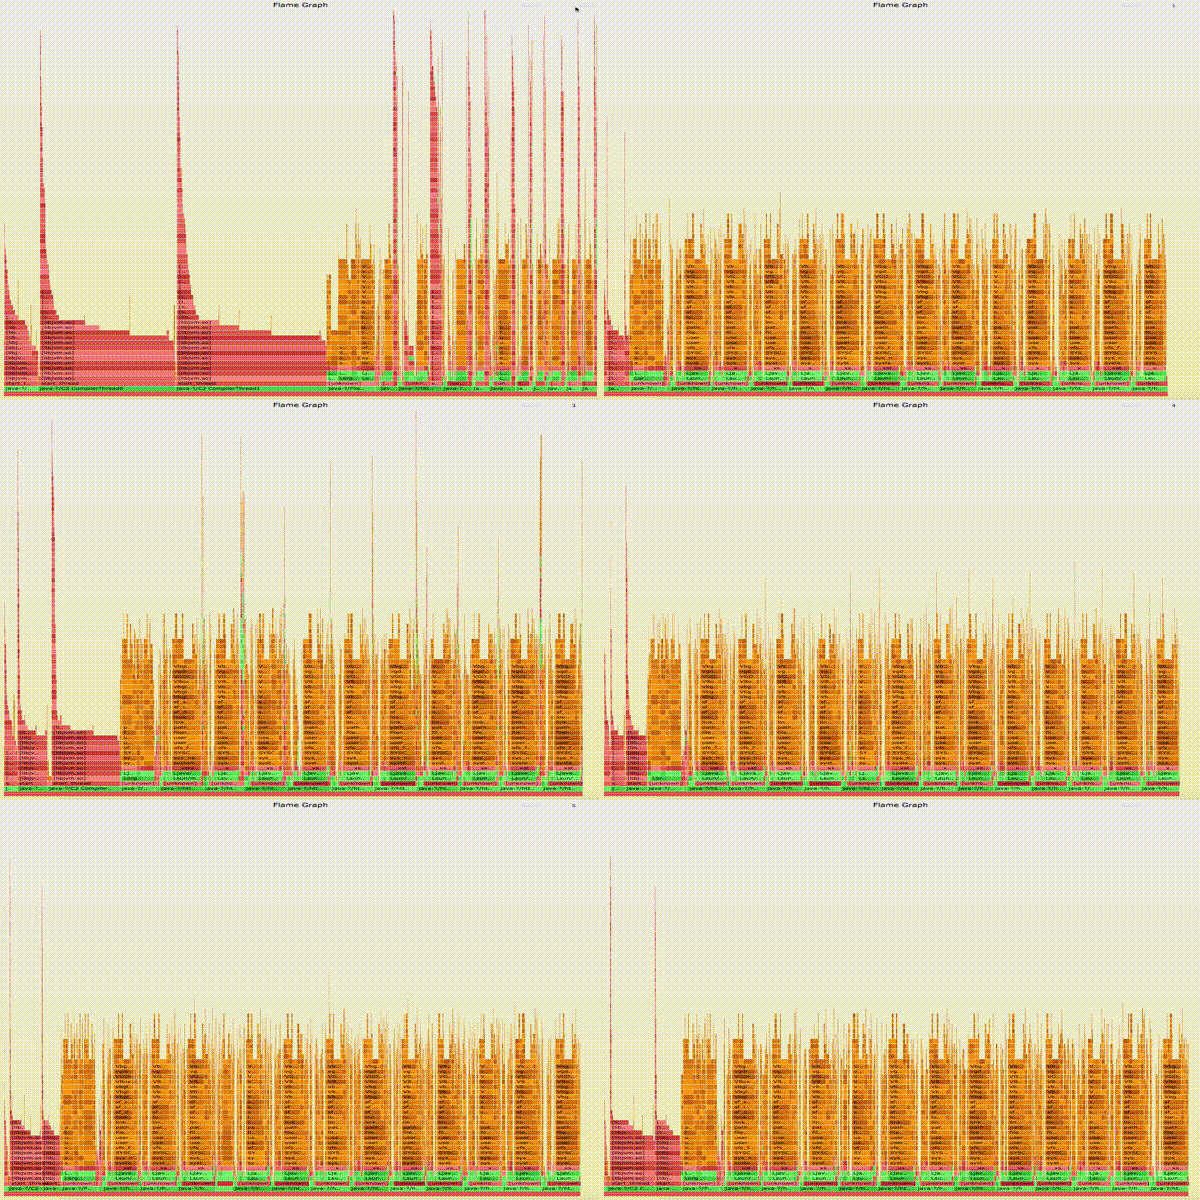
Animated flamegraphs
Create several flame graphs in time and one animated SVG FlameGraph that captures all of them.
Pre-requisites: the following repositories need to be cloned and available locally:
Usage:
# set up environment variables
$ export PERF_MAP_AGENT_DIR=/path/to/perf-map-agent/
$ export FLAMEGRAPH_DIR=/path/to/flamegraph/
# run animate-flames PID NUMBER_OF_RECORDINGS SLEEP_SECONDS
# (in this example  NUMBER_OF_RECORDINGS = 5, SLEEP_SECONDS=10)
$ ./bin/animate-flames $PID 5 10
Recording events for 10 seconds (adapt by setting PERF_RECORD_SECONDS)
[ perf record: Woken up 1 times to write data ]
[ perf record: Captured and wrote 0.114 MB /tmp/perf-$PID.data (~4993 samples) ]
1 Wrote /tmp/out-threads-$PID-1.collapsed
Wrote flamegraph-$PID-1.svg
Recording events for 10 seconds (adapt by setting PERF_RECORD_SECONDS)
[ perf record: Woken up 1 times to write data ]
[ perf record: Captured and wrote 0.120 MB /tmp/perf-$PID.data (~5249 samples) ]
2 Wrote /tmp/out-threads-$PID-2.collapsed
Wrote flamegraph-$PID-2.svg
Recording events for 10 seconds (adapt by setting PERF_RECORD_SECONDS)
[ perf record: Woken up 1 times to write data ]
[ perf record: Captured and wrote 0.117 MB /tmp/perf-$PID.data (~5127 samples) ]
3 Wrote /tmp/out-threads-$PID-3.collapsed
Wrote flamegraph-$PID-3.svg
Recording events for 10 seconds (adapt by setting PERF_RECORD_SECONDS)
[ perf record: Woken up 1 times to write data ]
[ perf record: Captured and wrote 0.118 MB /tmp/perf-$PID.data (~5143 samples) ]
4 Wrote /tmp/out-threads-$PID-4.collapsed
Wrote flamegraph-$PID-4.svg
Recording events for 10 seconds (adapt by setting PERF_RECORD_SECONDS)
[ perf record: Woken up 1 times to write data ]
[ perf record: Captured and wrote 0.118 MB /tmp/perf-$PID.data (~5158 samples) ]
5 Wrote /tmp/out-threads-$PID-5.collapsed
Wrote flamegraph-$PID-5.svg
Wrote animated-flamegraph-$PID.svg
vagrant-grav
A Vagrant box that can be used as a grav development environment on non-linux machines.
Pre-requisite:
Usage:
$ cd vagrant-grav
$ vagrant up
will run a vagrant box with:
- ubuntu zesty64
- Java OpenJDK8
- perf
- iovisor BCC
- perf-map-agent
- FlameGraph scripts
- grav scripts
$ vagrant ssh
...
[email protected]:~$ echo $JAVA_HOME
/usr/lib/jvm/java-8-openjdk-amd64/
[email protected]:~$ echo $GRAV_DIR
/vagrant/grav
[email protected]:~$ echo $FLAMEGRAPH_DIR
/vagrant/FlameGraph
[email protected]:~$ echo $PERF_MAP_AGENT_DIR
/vagrant/perf-map-agent
The VM is now ready for grav development.
[email protected]:~$ logout
Connection to 127.0.0.1 closed.
$ vagrant port
The forwarded ports for the machine are listed below. Please note that
these values may differ from values configured in the Vagrantfile if the
provider supports automatic port collision detection and resolution.

    22 (guest) => 2200 (host)
  8080 (guest) => 18080 (host)
Forwarded port 8080 to port 18080 to allow access to a server running inside the box.


