All Projects → timescale → Tobs

timescale / Tobs

Licence: apache-2.0
tobs - The Observability Stack for Kubernetes. Easy install of a full observability stack into a k8s cluster with a CLI tool or Helm charts.

Programming Languages

go
31211 projects - #10 most used programming language

Projects that are alternatives of or similar to Tobs

Kube State Metrics
Add-on agent to generate and expose cluster-level metrics.
Stars: ✭ 3,433 (+1745.7%)
Mutual labels:  monitoring, metrics, observability, kubernetes-monitoring
Sematext Agent Docker
Sematext Docker Agent - host + container metrics, logs & event collector
Stars: ✭ 194 (+4.3%)
Mutual labels:  monitoring, metrics, kubernetes-monitoring
Graphite exporter
Server that accepts metrics via the Graphite protocol and exports them as Prometheus metrics
Stars: ✭ 217 (+16.67%)
Mutual labels:  monitoring, metrics, observability
Myperf4j
High performance Java APM. Powered by ASM. Try it. Test it. If you feel its better, use it.
Stars: ✭ 2,281 (+1126.34%)
Mutual labels:  monitoring, metrics, observability
Sensu Go
Simple. Scalable. Multi-cloud monitoring.
Stars: ✭ 625 (+236.02%)
Mutual labels:  monitoring, metrics, observability
Mtail
extract internal monitoring data from application logs for collection in a timeseries database
Stars: ✭ 3,028 (+1527.96%)
Mutual labels:  monitoring, metrics, observability
Swagger Stats
API Observability. Trace API calls and Monitor API performance, health and usage statistics in Node.js Microservices.
Stars: ✭ 559 (+200.54%)
Mutual labels:  monitoring, metrics, observability
Opstrace
Secure observability, deployed in your own network. An open source alternative to SaaS solutions like Datadog, SignalFx, ...
Stars: ✭ 743 (+299.46%)
Mutual labels:  monitoring, metrics, observability
Scouter
Scouter is an open source APM (Application Performance Management) tool.
Stars: ✭ 1,792 (+863.44%)
Mutual labels:  monitoring, metrics
Prom Client
Prometheus client for node.js
Stars: ✭ 2,062 (+1008.6%)
Mutual labels:  monitoring, metrics
Collector
pganalyze statistics collector for gathering PostgreSQL metrics and log data
Stars: ✭ 181 (-2.69%)
Mutual labels:  monitoring, metrics
Inspectit Ocelot
inspectIT Ocelot - Java agent for collecting application performance, tracing and behavior data
Stars: ✭ 135 (-27.42%)
Mutual labels:  monitoring, observability
Lindb
LinDB is a scalable, high performance, high availability distributed time series database.
Stars: ✭ 2,105 (+1031.72%)
Mutual labels:  monitoring, metrics
Stagemonitor
an open source solution to application performance monitoring for java server applications
Stars: ✭ 1,664 (+794.62%)
Mutual labels:  monitoring, metrics
Legend
Legend builds and publishes Grafana dashboards for your services with prefilled metrics and alerts for your services.
Stars: ✭ 149 (-19.89%)
Mutual labels:  monitoring, observability
Swiftmetrics
Swift Application Metrics instruments the Swift runtime for performance monitoring, providing the monitoring data programatically via an API or visually with an Eclipse Client.
Stars: ✭ 145 (-22.04%)
Mutual labels:  monitoring, metrics
Grafana Influx Dashboard
Grafana InfluxDB scripted dashboard
Stars: ✭ 130 (-30.11%)
Mutual labels:  monitoring, metrics
Telemetry metrics
Collect and aggregate Telemetry events over time
Stars: ✭ 144 (-22.58%)
Mutual labels:  monitoring, metrics
Appmetrics
App Metrics is an open-source and cross-platform .NET library used to record and report metrics within an application.
Stars: ✭ 1,986 (+967.74%)
Mutual labels:  monitoring, metrics
Github Monitoring
Monitor your GitHub Repos with Docker & Prometheus
Stars: ✭ 163 (-12.37%)
Mutual labels:  monitoring, metrics

tobs - The Observability Stack for Kubernetes

Go Report Card GoDoc

Tobs is a tool that aims to make it as easy as possible to install a full observability stack into a Kubernetes cluster. Currently this stack includes:
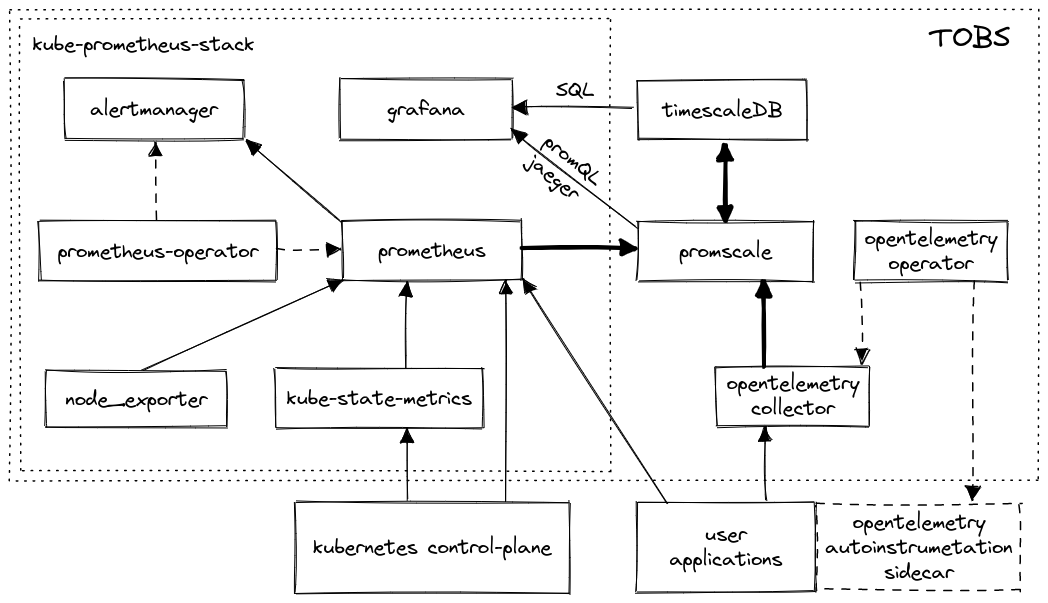
Tobs Architecture Diagram
  • Prometheus to collect metrics
  • Grafana to visualize what's going on
  • Promscale (design doc) to store metrics for the long-term and allow analysis with both PromQL and SQL.
  • TimescaleDB for long term storage of metrics and provides ability to query metrics data using SQL.
  • Kube-State-Metrics to get metrics from kubernetes api-server.
  • Promlens tool to build and analyse promql queries with ease.
  • Node-Exporter to export metrics from the nodes.

We plan to expand this stack over time and welcome contributions.

Tobs provides a CLI tool to make deployment and operations easier. We also provide Helm charts that can be used directly or as sub-charts for other projects.

See a demo of tobs in action by clicking the video below:

🔥 Quick start

Dependencies: Helm 3

Using the tobs CLI tool

The CLI tool (usage docs) provides the most seamless experience for interacting with tobs.

Getting started with the CLI tool is a two-step process: First you install the CLI tool locally, then you use the CLI tool to install the tobs stack into your Kubernetes cluster.

Installing the CLI tool

To download and install tobs, run the following in your terminal, then follow the on-screen instructions.

curl --proto '=https' --tlsv1.2 -sSLf  https://tsdb.co/install-tobs-sh |sh

Alternatively, you can download the CLI directly via our releases page

Using the tobs CLI tool to deploy the stack into your Kubernetes cluster

After setting up tobs run the following to install the tobs helm charts into your Kubernetes cluster

tobs install

This will deploy all of the tobs components into your cluster and provide instructions as to next steps.

Getting started by viewing your metrics in Grafana

To see your Grafana dashboards after installation run

tobs grafana change-password <new_password>
tobs grafana port-forward

Then, point your browser to http://127.0.0.1:8080/ and login with the admin username.

Do more with the CLI

Our full usage docs give a good overview of what you can do with the CLI tool.

More details about the CLI tool can be found here

Configuring the stack

All configuration for all components happens through the helm values.yml file. You can view the self-documenting default values.yaml in the repo. We also have additional documentation about individual configuration settings in our Helm chart docs.

To modify the settings, first create a values.yaml file:

tobs helm show-values > values.yaml

Then modify the values.yaml file using your favorite editor. Finally, deploy with the new settings using:

tobs install -f values.yaml

🛠Alternative deployment methods

Using the Helm charts without the CLI tool

Users sometimes want to use our Helm charts as sub-charts for other project or integrate them into their infrastructure without using our CLI tool. This is a supported use-case and instructions on using the Helm charts can be found here.

✏️ Contributing

We welcome contributions to tobs, which is licensed and released under the open-source Apache License, Version 2. The same Contributor's Agreement applies as in TimescaleDB; please sign the Contributor License Agreement (CLA) if you're a new contributor.

Note that the project description data, including the texts, logos, images, and/or trademarks, for each open source project belongs to its rightful owner. If you wish to add or remove any projects, please contact us at [email protected].