


A library to enhance the internal compilations of any Android app, adding useful tools for their early stage users. They can get info on what they are testing, send comprehensive crash reports and deeply inspect their running app on the go. It also bring a customizable team panel and other helpful tools, all within your app.


All your internal users (QA, managers, client, beta testers...) can get precise information on what they are testing and use an exclusive panel customized by the dev team with actions and resources. They also can send contextualized reports, which automagically include highly valuable information like repro steps, screenshots, crash details, full logs and environment info (app, build, repo status, device and OS).
For developers this is conceptually similar to Chrome DevTools but packed inside your app, a revolutionary concept that enhance their daily compilations. We provide a complete set of tools to inspect, analyze and modify a running app from within it, without cable and on the go. It helps them to understand what's really happening underneath in order to highlight issues and bug causes. They also receive comprehensive reports, can customize our tools for others and can make use of some coding helpers.
Production users get neither any of our features nor apk size increase. They get a spotless app thoroughly polished in an agile development process, enhanced by our tools :)
Tools
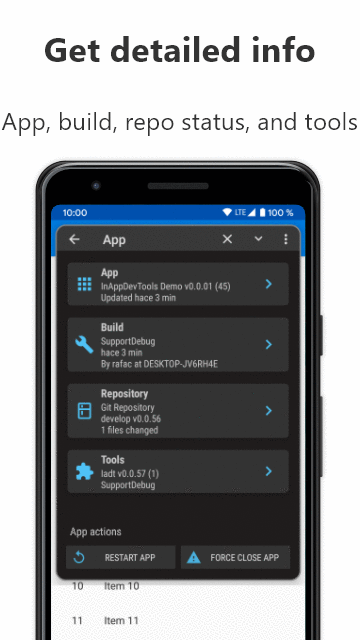
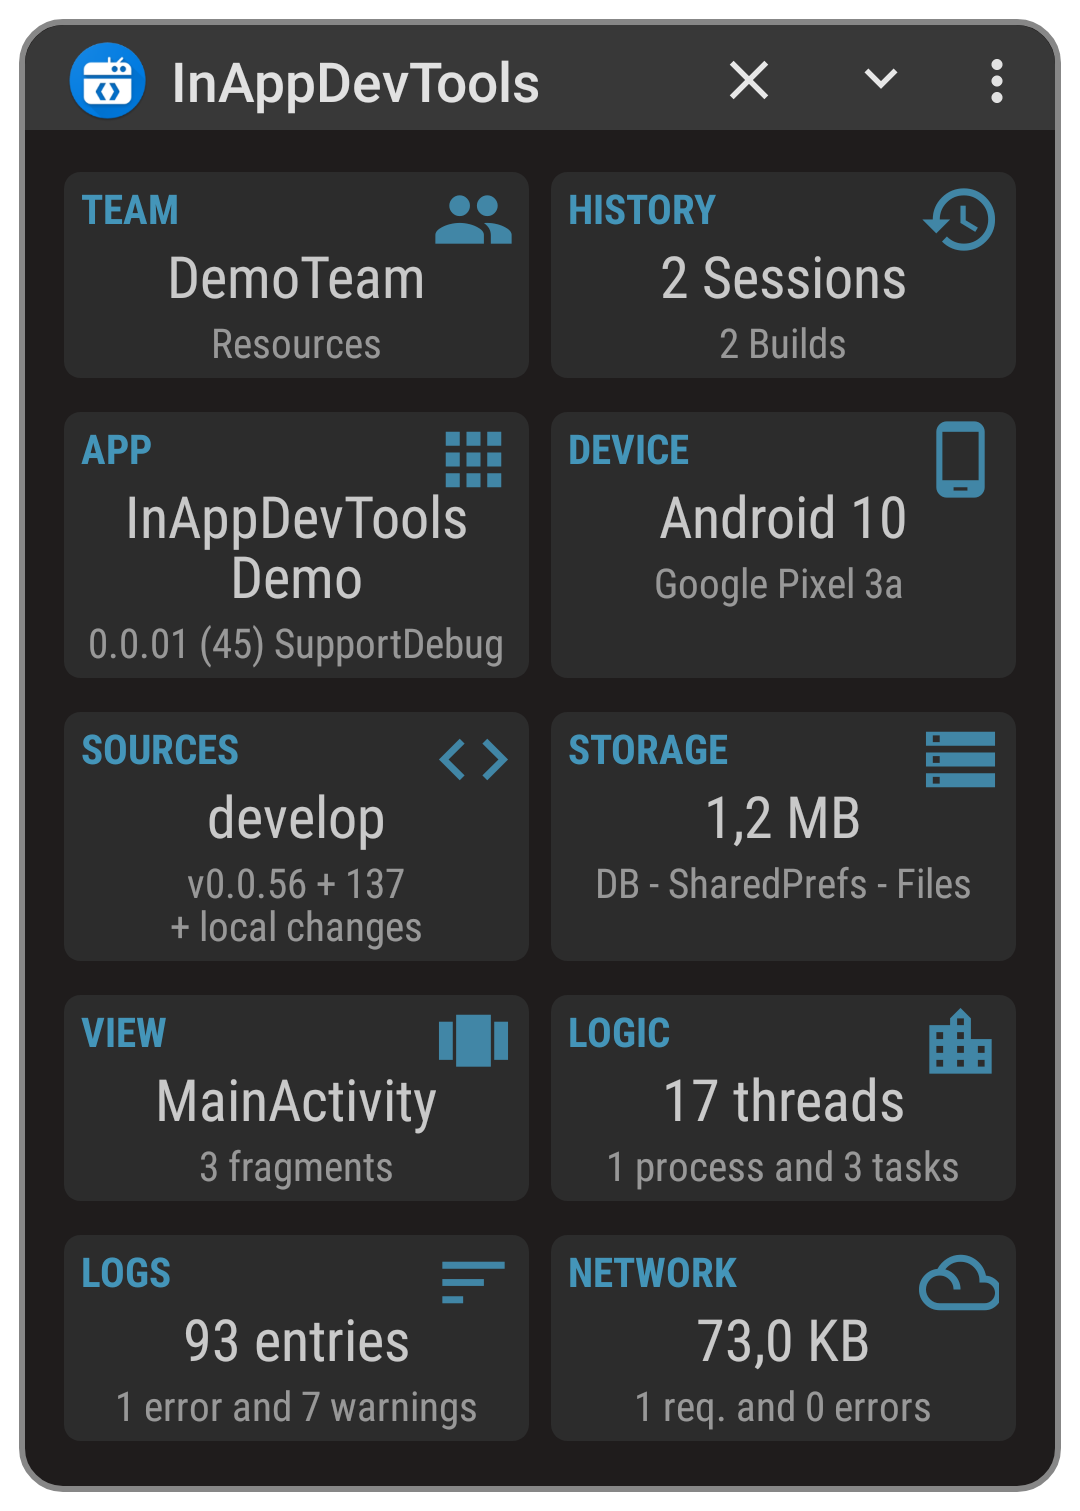
Auto-logger, repro step generator, logcat viewer, crash handler, reports, source browser, layout inspector, component browser, storage editor, network activity, info panels (apk , build, repo, device and os), coding helpers and much more.
Characteristics
- Usable everywhere without cable, our UI overlap your app.
- Easy to install, just add our dependencies to your Gradle files.
- Careful with your releases, where everything will be auto disabled by default.
- Flexible to configure via Gradle extension.
- Handy integrations available to improve the experience of your testers and to assist your developers.
Features
 |
App and device info |
 |
Team resources and reports |
 |
Crash visualization and report |
 |
Logs, reproduction steps and advance events |
 |
View inspector |
 |
Logic and network inspector |
Setup
You only need to modify 2 gradle files. On your root build.gradle file:
buidscript {...}

plugins {
    id "es.rafaco.inappdevtools" version "0.0.58" apply false           // 1.
}

allprojects {
    repositories {
        maven { url "https://jitpack.io"}                               // 2.
    }
}
Show details
- Add our plugin in your
pluginsclosure, which should be just beforebuildscript. - Add JitPack to
allprojects,repositories.
On your app module build.gradle file:
apply plugin: 'com.android.application'
apply plugin: 'es.rafaco.inappdevtools'                                 // 1.

android {
    ...
}

dependencies {
    releaseImplementation 'es.rafaco.inappdevtools:noop:0.0.58'         // 2.

    debugImplementation 'es.rafaco.inappdevtools:support:0.0.58'        // 3.
    //debugImplementation 'es.rafaco.inappdevtools:androidx:0.0.58'
}

inappdevtools {                                                         // 4.
    enabled = true
    teamName = 'YourTeam'
    teamEmail = '[email protected]'
    notes = 'First build note, replace me on the next ones.'
}
Show details
- Apply our plugin
- Add our
noopfor your release builds - Choose between
androidxorsupportfor your debug builds, according to the Android libraries in your project.androidxrequire Jetifier enabled. - Add our configuration closure
inappdevtoolsand fill your email at least.
From now on, when building your project artifacts:
- Iadt will be enabled on your Debug builds: all features will be available and your source code will be exposed throw our UI and in your APK files.
- Iadt will be disabled on your Release builds: no feature will be available, your sources aren't exposed and your APK size will be minimally increased.
Ready to go! Just run a Debug build and our welcome dialog will pop up on your device.
For additional setup details visit our wiki:
- Compatibility
- Detailed setup
- Configurations
- Redefine which are your internal compilations
- Limit source code exposition
- Web apps and Hybrid apps
- Including additional modules
Usage
|
After the setup process, you only need to Run a debug build of your app into a real device or emulator. On first start, our welcome dialog will pop up. It gives basic information about the running apk, allows to disable our tools and helps in accepting the permission to show over your app. |  |
 |
You can invoke our UI at any time by tapping the new floating icon that appear over your app or by shaking your device with your app on foreground. It gives you access to all our tools while you keep using your app. Our UI will auto popup on crash, showing full details about the crash and allowing to report it. |
Integrations
There are multiple ways to integrate your app with our library for a better customization or to improve the experience of your internal users. All this methods will be safely ignored when our library is disabled (release builds, disabled configuration or using noop artifacts).
Customize your team info
You can customize a lot of things in the 'Team Screen' of your compilations by using our Gradle configuration. For field details, visit configurations.
inappdevtools {
    teamName = "DemoTeam"
    teamEmail = '[email protected]'
    teamDesc = "Team description or any text you want to show on top of Team screen. Change it with 'teamDesc' configuration."
    teamLinks = [ website   : "http://inappdevtools.org",
                  repo      : "https://github.com/rafaco/InAppDevTools"]
}
Add team actions
You can easily add buttons into your 'Team screen' to perform any logic or to call any of your methods. Pass a ButtonFlexData instance to Iadt.addTeamAction(), with your action in a Runnable and details for the button (message, icon, color...). Add them on startup (i.e. onCreate of your app or main activity) or dynamically at any point (i.e. after user log in).
Iadt.addTeamAction(new ButtonFlexData("Call yourMethod",
        R.drawable.ic_run_white_24dp,
        new Runnable() {
            @Override
            public void run() {
                YourClass.yourMethod("someParam");
            }
        }));
Add build notes
You can provide a text to describe your compilation, their changes or to provide instructions. It will be shown at welcome dialog, team screen and build screen.
Use our notes configuration in Gradle or modify BuildConfigField.NOTES at runtime:
inappdevtools {
    notes = "This is a SAMPLE NOTE provided at buildtime by our Gradle extension"
}Iadt.getConfig()
.setString(BuildConfigField.NOTES,
"This is a SAMPLE NOTE provided at runtime by our Java interface");Show internal messages
You can show special toast messages only for your internal users. This messages will be shown when this library is enabled and will be ignored on your release builds.
Your internal users can easily distinguish them from the standard toast as they are shown in a top position and they are colored base on the severity. This messages will auto generate an event.
Iadt.buildMessage("This is a DEV message").fire();                 //Light blue (default)
Iadt.buildMessage("This is a INFO message").isInfo().fire();       //Green
Iadt.buildMessage("This is a WARNING message").isWarning().fire(); //Yellow
Iadt.buildMessage("This is a ERROR message").isError().fire();     //Red
Fire your own events
You can create and fire your own events manually. These events will be shown on our log screen like any other auto-generated events. It will also appear in reproduction steps if it has a verbosity greater than Info (I, W and E).
Iadt.buildEvent("Quick event sample").fire();

Iadt.buildEvent("User logged in: " + userData.getName())
    .setExtra(userData.toString())
    .setCategory("User")
    .setSubcategory("LogIn")
    .isInfo()
    .fire();
Contributing and building instructions
There are many ways to help us starting from giving this project a GitHub
For more, please check out our CONTRIBUTING.md document and our Coding contributions guide in our Wiki.
Join our community and help us making your job easy! :)
About this project
I started this project while I was working on an international flight information app. We had a user in another country with a nasty bug that we were unable to reproduce. I send him a special apk to record their logs and to send them to us on crash. We identify the problem straight away just looking at the log.
Days after I added an overlay to see the logs over our activities and the first info panel... and it became my personal tool for my daily duties. I carried on adding more tools and I started to realise that it could be useful for other Android developers as well. Few months later, I quit my job to fully focus on this project and to make it flexible for other apps.
Year and a half later, I am very excited with the results obtained and I'm looking forward to create a friendly community to push this project to the moon, join us!. Meanwhile, I'm currently searching for job at Madrid, ideally within an Android team open to use this tools. Check out my LinkedIn profile.
Links
- External references:
- inappdevtools.org. Our new website (under construction)
- [Your link here] Write a public entry and notify us!
- Apps using this library:
InAppDevTools DemoComing soon at Google Play- [Your app here] Let us know and get a link to your app.
Thanks
- To @whataa for Pandora, key for layout, network and storage inspection
🏆 - To @Zsolt Kocsi for Paperwork, inspiration for CompileConfig
- To @tiagohm for CodeView
- To @alorma for TimelineView
- To @valdesekamdem for MaterialDesign-Toast
- To @rnevet for WCViewPager
- To @SalomonBrys for ANR-WatchDog
- To @nisrulz for EasyDeviceInfo
- To Android Open Source Project for Arch
License
Copyright 2018-2020 Rafael Acosta Alvarez

Licensed under the Apache License, Version 2.0 (the "License");
you may not use this file except in compliance with the License.
You may obtain a copy of the License at

    http://www.apache.org/licenses/LICENSE-2.0

Unless required by applicable law or agreed to in writing, software
distributed under the License is distributed on an "AS IS" BASIS,
WITHOUT WARRANTIES OR CONDITIONS OF ANY KIND, either express or implied.
See the License for the specific language governing permissions and
limitations under the License.
This project modify, include and use products with separate copyright notices and license terms. For details, see LICENSE