The IYFThreading library
This is a header only C++11 (and later) library that contains a thread pool and a profiler. It is licensed under the 3-clause BSD license and only depends on the standard library. Last but not least, when testing, this library is built with -fsanitize=thread and the sanitizer does not detect any invalid behaviour.
Some components of this library may be used independently of one another. Here's a list of what does what:
- ThreadPool.hpp: independent of other headers, unless you enable thread pool profiling. The thread pool distributes assigned work to multiple worker threads. It supports barriers (blocking a thread until specified tasks complete) and tasks with or without returned results.
- ThreadProfiler.hpp: Depends on the ThreadProfilerSettings header. A lightweight header that contains function definitions and macros used for profiling. It enables you to record the durations of specified scopes. Moreover, even if profiling is disabled, you may use some of the macros defined in this header to assign names to your threads and to retrieve constant sequential zero-based IDs for them as well.
- ThreadProfilerCore.hpp: depends on the Spinlock and ThreadProfilerSettings headers. Heavy, but you only need to include it in two cases:
- the cpp file will contain the implementation (that is,
IYFT_THREAD_PROFILER_IMPLEMENTATIONwill be defined in it); - the functions in the file will need to retrieve, process and/or draw the recorded results using Ocornut's Dear ImGui.
- the cpp file will contain the implementation (that is,
- ThreadProfilerSettings.hpp: customizable settings and values, specific to your project. Make sure to not accidentally overwrite this file when updating this library.
- Spinlock.hpp: a really basic atomic_flag based spinlock that anyone can write in a minute. Independent of other headers.
This library is still being tested and refined. You should consider it to be a BETA VERSION.
Configuration
Three macros need to be defined (or not, if you want to disable the features) globally, e.g., in your CMake file:
IYFT_ENABLE_PROFILING
Defining this macro will enable profiling. Even if you don't record anything, having profiling enabled will introduce a little bit of overhead to your code.
If this macro isn't defined, most IYFT_PROFILER macros will do nothing or return constant values.
IYFT_THREAD_POOL_PROFILE
Defining this macro enables profiling of the thread pool. If this macro is defined, but IYFT_ENABLE_PROFILING isn't, profiling will still be disabled. Moreover, defining this macro will force ThreadPool.hpp to include ThreadProfiler.hpp.
IYFT_PROFILER_WITH_IMGUI
Defining this macro allows you to draw the results retrieved from the profiler using Ocornut's Dear ImGui. Defining this macro will make the ThreadProfilerCore.hpp include imgui.h
Other options only apply to the thread profiler. They are documented in the ThreadProfilerSettings.hpp header and should be adjusted there. You should also use the said header to define custom scope tags, names and colours, suitable for your application.
Documentation
To build the full documentation, use Doxygen with the provided Doxyfile.
Usage
This is a simple example. For a more complete example that uses more features, check out the contents of the examples folder.
// This needs to be built with -DIYFT_ENABLE_PROFILING (and, optionally, -DIYFT_THREAD_POOL_PROFILE), e.g, on Linux:
//
// clang++ -pthread -std=c++11 -Wall -Wextra -pedantic -DIYFT_ENABLE_PROFILING -DIYFT_THREAD_POOL_PROFILE MinimalTest.cpp
// OR
// g++ -pthread -std=c++11 -Wall -Wextra -pedantic -DIYFT_ENABLE_PROFILING -DIYFT_THREAD_POOL_PROFILE MinimalTest.cpp
//
// C++11 is the minimum supported standard version.

#include <iostream>
#include <string>

// Add the profiler and designate this cpp file as the implementation
#define IYFT_THREAD_PROFILER_IMPLEMENTATION
// This is a lightweight header that should be included in the file that will contain
// the implementation and all files that contain functions you want to profile.
#include "ThreadProfiler.hpp"
// This header should only be included in two cases:
// 1. the cpp has IYFT_THREAD_PROFILER_IMPLEMENTATION defined and contains the
// implementation;
// 2. in any files where you need to access, save or process the records.
#include "ThreadProfilerCore.hpp"

// Add the pool AFTER the profiler if IYFT_THREAD_POOL_PROFILE is defined
#include "ThreadPool.hpp"

#define FRAME_COUNT 5

std::string withResult(std::size_t num, const std::string& str) {
    IYFT_PROFILE(TaskWithResult, iyft::ProfilerTag::NoTag);

    return str + std::to_string(num);
}

int main() {
    // Name this thread (optional - a name will be assigned by default otherwise)
    IYFT_PROFILER_NAME_THREAD("Main");

    // Start the recording
    IYFT_PROFILER_SET_RECORDING(true);

    // Create a thread pool with std::thread::hardware_concurrency() - 1 workers.
    iyft::ThreadPool pool;

    // This string needs to be kept alive until we're done with it.
    const std::string test = "test";

    for (std::size_t i = 0; i < FRAME_COUNT; ++i) {
        // Add a task from a function and obtain a future.
        auto result = pool.addTaskWithResult(withResult, i, test);

        // Add a task lambda with no result
        pool.addTask([](){
            IYFT_PROFILE(TaskWithoutAResult, iyft::ProfilerTag::NoTag);
            std::this_thread::sleep_for(std::chrono::milliseconds(5));
        });

        // Busy wait until all jobs are done
        pool.waitForAll();

        // This should happen immediately because we waited for all tasks
        IYFT_ASSERT(result.get() == (test + std::to_string(i)));

        // Mark the end of the frame and start a new one
        IYFT_PROFILER_NEXT_FRAME
    }

    // Write the results to an std::string and std::cout
    // Calling iyft::GetThreadProfiler().getResults() will automatically stop the
    // recording.
    std::cout << iyft::GetThreadProfiler().getResults().writeToString() << "\n";

    return 0;
}
Drawing in ImGui
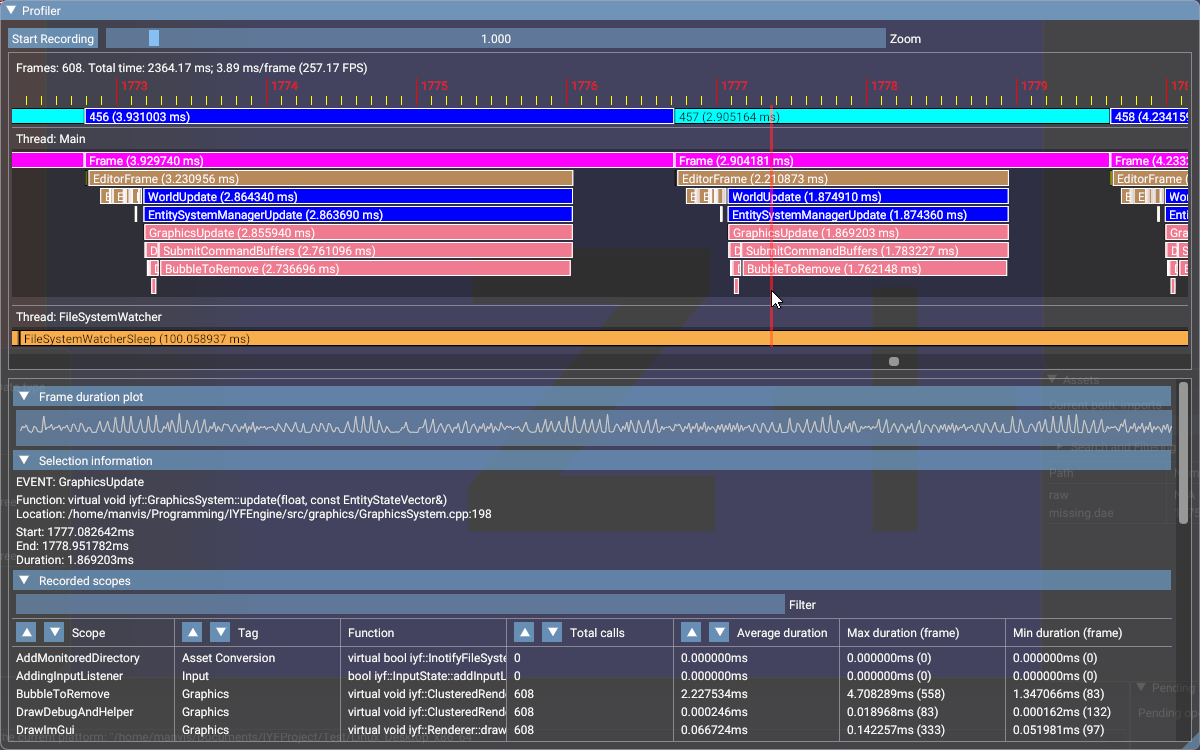
If your engine or framework uses Ocornut's Dear ImGui, you may draw the recorded data directly.
// Make sure IYFT_PROFILER_WITH_IMGUI was defined or you'll get a ton of errors

#include "imgui.h"
#include "ThreadProfilerCore.hpp"

// ...

std::unique_ptr<iyft::ProfilerResults> profilerResults;
void drawiProfilerResults(float delta) {
    static float profilerZoom = 1.0f;

    ImGui::SetNextWindowSize(ImVec2(1200,750), ImGuiCond_FirstUseEver);
    if (ImGui::Begin("Profiler", nullptr)) {
        if (IYFT_PROFILER_STATUS == iyft::ProfilerStatus::EnabledAndNotRecording) {
            if (ImGui::Button("Start Recording")) {
                IYFT_PROFILER_SET_RECORDING(true);
            }
        } else if (IYFT_PROFILER_STATUS == iyft::ProfilerStatus::EnabledAndRecording) {
            if (ImGui::Button("Stop Recording")) {
                IYFT_PROFILER_SET_RECORDING(false);
                profilerResults = std::make_unique<iyft::ProfilerResults>(std::move(iyft::GetThreadProfiler().getResults()));
            }
        } else {
            // The profiler must be enabled for recording to work
            assert(0);
        }

        ImGui::SameLine();
        ImGui::SliderFloat("Zoom", &profilerZoom, iyft::ProfilerResults::GetMinScale(), iyft::ProfilerResults::GetMaxScale());

        if (profilerResults != nullptr) {
            profilerResults->drawInImGui(profilerZoom);
        } else {
            ImGui::Text("Results not yet loaded or recorded.");
        }
    }

    ImGui::End();
}

// ...
You'll get something like this: