JPlotter
OpenGL based 2D Plotting Library for Java using AWT/Swing and LWJGL through lwjgl3-awt. An AWT Graphics2D fallback solution was introduced to support systems lacking OpenGL-3.3 as well as MacOS.


JPlotter's concept is pretty straight forward, you get a JPlotterCanvas that is backed by OpenGL (or not in case of fallback).
What is displayed by this canvas depends on the set Renderer.
Most likely you want to set a CoordSysRenderer that displays a coordinate system.
Within that coordinate system you may want to display points or lines, which you can do by again using a Renderer (or multiple) as content.
A PointsRenderer can be used to draw points as in a scatter plot, or a LinesRenderer can be used to make a line chart or contour plot.
JPlotter is also capable of exporting plots as Scalable Vector Graphics (SVG) through Apache Batik as well as exporting to portable document format (PDF) through Apache PDFBox.
More details and information can be found in the Wiki.
Maven
JPlotter is available as Maven artifact at the Central Maven Repository.
<dependency>
  <groupId>com.github.hageldave.jplotter</groupId>
  <artifactId>jplotter</artifactId>
  <version>0.6.1</version>
</dependency>
Teaser Image
See the Gallery for more images.
Code Example
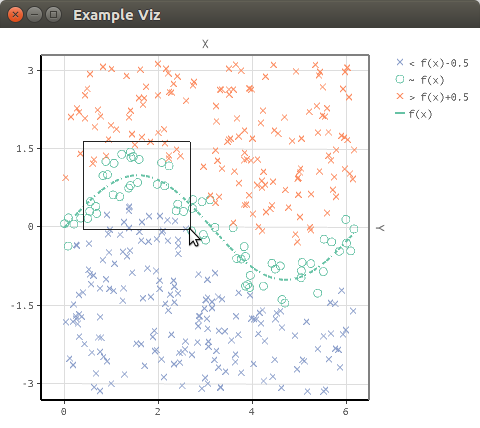
Before visualizing anything, some data has to be generated first. Lets sample the sine function so we can later plot a line.
DoubleUnaryOperator fx = Math::sin;
int numCurveSamples = 100;
double[] curveX = new double[numCurveSamples];
double[] curveY = new double[numCurveSamples];
for(int i=0; i<numCurveSamples; i++){
   double x = i*Math.PI*2/numCurveSamples;
   double y = fx.applyAsDouble(x);
   curveX[i]=x;  curveY[i]=y;
}
Lets also mix in some random samples for plotting points.
int numPointSamples = 400;
double[] pointsX = new double[numPointSamples];
double[] pointsY = new double[numPointSamples];
double[] diffToCurve = new double[numPointSamples];
for(int i=0; i<numPointSamples; i++){
   double x = Math.random()*Math.PI*2;
   double y = Math.random()*Math.PI*2-Math.PI;
   diffToCurve[i] = y-fx.applyAsDouble(x);
   pointsX[i]=x;  pointsY[i]=y;
}
Now that data is set up, we are good to go and can think about representation of the data. The sine samples should be visualized as a line, whereas the random samples should be displayed as points. Lets also divide the points into 3 classes:
- y(x) < sin(x)-0.5
- sin(x)-0.5 <= y(x) <= sin(x)+0.5
- sin(x)+0.5 < y(x)
Lines sineLine = new Lines();
int sineColor = 0xff66c2a5;
sineLine.setGlobalThicknessMultiplier(2)
   .setStrokePattern(0xf790)
   .addLineStrip(curveX, curveY)
   .forEach(segment -> segment.setColor(sineColor));
Points pointsC1 = new Points(DefaultGlyph.CROSS);
Points pointsC2 = new Points(DefaultGlyph.CIRCLE);
Points pointsC3 = new Points(DefaultGlyph.CROSS);
int c1Color = 0xff8da0cb, c2Color = sineColor, c3Color = 0xfffc8d62;
for(int i=0; i<numPointSamples; i++){
   if(diffToCurve[i] < -0.5){
      pointsC1.addPoint(pointsX[i], pointsY[i]).setColor(c1Color);
   } else if(diffToCurve[i] > 0.5) {
      pointsC3.addPoint(pointsX[i], pointsY[i]).setColor(c3Color);
   } else {
      pointsC2.addPoint(pointsX[i], pointsY[i]).setColor(c2Color);
   }
}
Alright next we put everything into a coordinate system.
CoordSysRenderer coordsys = new CoordSysRenderer();
CompleteRenderer content = new CompleteRenderer();
coordsys.setContent( content
      .addItemToRender(sineLine)
      .addItemToRender(pointsC1)
      .addItemToRender(pointsC2)
      .addItemToRender(pointsC3));
// lets set the coordinate view to cover the whole sampling space
coordsys.setCoordinateView(-.5, -3.3, 6.5, 3.3);
We can also add a legend to the plot so that a viewer can make more sense of the viz.
Legend legend = new Legend();
coordsys.setLegendRightWidth(80);
coordsys.setLegendRight(legend
      .addLineLabel(2, sineColor, "f(x)")
      .addGlyphLabel(DefaultGlyph.CROSS, c1Color, "< f(x)-0.5")
      .addGlyphLabel(DefaultGlyph.CIRCLE, c2Color, "~ f(x)")
      .addGlyphLabel(DefaultGlyph.CROSS, c3Color, "> f(x)+0.5"));
We will use a blank canvas to display our coordinate system. For exploring the plot we can add some controls for zooming.
boolean useOpenGL = true;
JPlotterCanvas canvas = useOpenGL ? new BlankCanvas() : new BlankCanvasFallback();
canvas.setRenderer(coordsys);
// lets add some controls for exploring the data
new CoordSysScrollZoom(canvas,coordsys).setZoomFactor(1.7).register();
new CoordSysViewSelector(canvas,coordsys) {
   {extModifierMask=0;/* no need for shift to be pressed */}
   public void areaSelected(double minX, double minY, double maxX, double maxY) {
      coordsys.setCoordinateView(minX, minY, maxX, maxY);
   }
}.register();
Nice, now we conclude with some typical AWT/Swing code to launch the viz in a JFrame.
JFrame frame = new JFrame("Example Viz");
frame.setDefaultCloseOperation(JFrame.EXIT_ON_CLOSE);
frame.getContentPane().add(canvas.asComponent());
canvas.asComponent().setPreferredSize(new Dimension(480, 400));
canvas.asComponent().setBackground(Color.white);

// register a listener that will cleanup GL resources on window closing
canvas.addCleanupOnWindowClosingListener(frame);

SwingUtilities.invokeLater(()->{
   frame.pack();
   frame.setVisible(true);
});
We can also add a pop up menu for exporting to SVG or PNG.
PopupMenu menu = new PopupMenu();
canvas.asComponent().add(menu);
canvas.asComponent().addMouseListener(new MouseAdapter() {
   public void mouseClicked(MouseEvent e) {
      if(SwingUtilities.isRightMouseButton(e))
         menu.show(canvas.asComponent(), e.getX(), e.getY());
   }
});
MenuItem svgExport = new MenuItem("SVG export");
svgExport.addActionListener(e->{
   Document svg = SVGUtils.containerToSVG(frame.getContentPane());
   SVGUtils.documentToXMLFile(svg, new File("example_export.svg"));
   System.out.println("exported SVG.");
});
menu.add(svgExport);
MenuItem pngExport = new MenuItem("PNG export");
pngExport.addActionListener(e->{
   Img img = new Img(frame.getContentPane().getSize());
   img.paint(g -> frame.getContentPane().paintAll(g));
   ImageSaver.saveImage(img.getRemoteBufferedImage(), "example_export.png");
   System.out.println("exported PNG.");
});
menu.add(pngExport);