All Projects → lineupjs → lineup_htmlwidget

lineupjs / lineup_htmlwidget

Licence: other
HTMLWidget wrapper of LineUp for Visual Analysis of Multi-Attribute Rankings

Programming Languages

r
7636 projects
javascript
184084 projects - #8 most used programming language

Projects that are alternatives of or similar to lineup htmlwidget

grillade
Grid sytem for shiny apps or rmarkdown and to create htmlwidgets matrix
Stars: ✭ 16 (-68.63%)
Mutual labels:  shiny, htmlwidgets
echarty
Minimal R/Shiny Interface to ECharts.js
Stars: ✭ 49 (-3.92%)
Mutual labels:  shiny, crosstalk
rfrappe
htmlwidget for frappe charts js library
Stars: ✭ 24 (-52.94%)
Mutual labels:  shiny, htmlwidgets
jsTreeR
A wrapper of the jQuery plugin `jsTree`.
Stars: ✭ 36 (-29.41%)
Mutual labels:  shiny, htmlwidgets
Manipulatewidget
Add More Interactivity to htmlwidgets
Stars: ✭ 110 (+115.69%)
Mutual labels:  shiny, htmlwidgets
vueR
vue.js for R
Stars: ✭ 131 (+156.86%)
Mutual labels:  shiny, htmlwidgets
Reactable
Interactive data tables for R
Stars: ✭ 345 (+576.47%)
Mutual labels:  shiny, htmlwidgets
taucharts
📊 An R htmlwidget interface to the TauCharts javascript library
Stars: ✭ 66 (+29.41%)
Mutual labels:  htmlwidgets, htmlwidget
RagGrid
R interface to ag-grid.
Stars: ✭ 31 (-39.22%)
Mutual labels:  shiny, htmlwidgets
Highcharter
R wrapper for highcharts
Stars: ✭ 583 (+1043.14%)
Mutual labels:  shiny, htmlwidgets
rAmCharts4
An R interface to amCharts 4
Stars: ✭ 26 (-49.02%)
Mutual labels:  shiny, htmlwidgets
Scatterd3
R scatter plot htmlwidget based on D3.js
Stars: ✭ 135 (+164.71%)
Mutual labels:  shiny, htmlwidgets
quickglobe
🌎 View Country Data via a 3D, D3, Globe 🌍
Stars: ✭ 22 (-56.86%)
Mutual labels:  htmlwidgets, htmlwidget
d3Tree
htmlwidget that binds d3js collapsible trees to R and Shiny to make an interactive search tool
Stars: ✭ 79 (+54.9%)
Mutual labels:  shiny, htmlwidgets
bpmn
BPMN diagrams in R
Stars: ✭ 16 (-68.63%)
Mutual labels:  htmlwidgets, htmlwidget
Rhandsontable
A htmlwidgets implementation of Handsontable.js
Stars: ✭ 320 (+527.45%)
Mutual labels:  shiny, htmlwidgets
Dt
R Interface to the jQuery Plug-in DataTables
Stars: ✭ 451 (+784.31%)
Mutual labels:  shiny, htmlwidgets
Collapsibletree
Create Interactive Collapsible Tree Diagrams in R using D3.js
Stars: ✭ 126 (+147.06%)
Mutual labels:  shiny, htmlwidgets
Explor
Interfaces for Multivariate Analysis in R
Stars: ✭ 157 (+207.84%)
Mutual labels:  shiny, htmlwidgets
Shinyjqui
jQuery UI Interactions and Effects for Shiny
Stars: ✭ 225 (+341.18%)
Mutual labels:  shiny

LineUp.js as HTMLWidget

License: MIT Github Actions

LineUp is an interactive technique designed to create, visualize and explore rankings of items based on a set of heterogeneous attributes. This is a HTMLWidget wrapper around the JavaScript library LineUp.js. Details about the LineUp visualization technique can be found at https://jku-vds-lab.at/tools/lineup/.

It can be used within standalone R Shiny apps or R Markdown files. Crosstalk is supported for synching selections and filtering among widgets.

Installation

install.packages('lineupjs')
library(lineupjs)

Examples

lineup(mtcars)
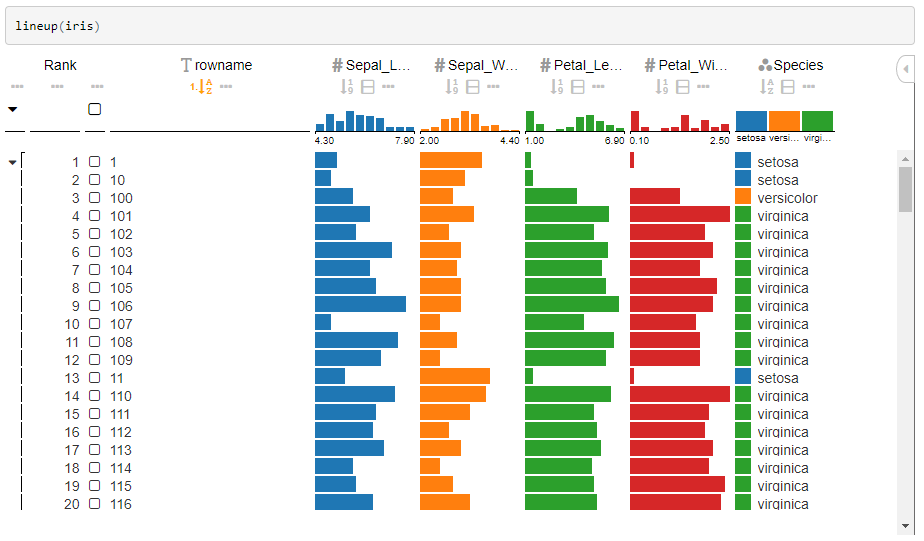
lineup(iris)

iris output

Advanced Example

lineup(iris,
  ranking=lineupRanking(columns=c('_*', '*', 'impose'),
                        sortBy=c('Sepal_Length:desc'), groupBy=c('Species'),
                        impose=list(type='impose', column='Sepal_Length', categoricalColumn='Species')))

iris advanced output

Crosstalk Example

devtools::install_github("jcheng5/d3scatter")
library(d3scatter)
library(crosstalk)

shared_iris = SharedData$new(iris)

d3scatter(shared_iris, ~Petal.Length, ~Petal.Width, ~Species, width="100%")
lineup(shared_iris, width="100%")

crosstalk output

Shiny Example

library(shiny)
library(crosstalk)
library(lineupjs)
library(d3scatter)

# Define UI for application that draws a histogram
ui <- fluidPage(
  titlePanel("LineUp Shiny Example"),

  fluidRow(
    column(5, d3scatterOutput("scatter1")),
    column(7, lineupOutput("lineup1"))
  )
)

# Define server logic required to draw a histogram
server <- function(input, output) {
  shared_iris <- SharedData$new(iris)

  output$scatter1 <- renderD3scatter({
    d3scatter(shared_iris, ~Petal.Length, ~Petal.Width, ~Species, width = "100%")
  })

  output$lineup1 <- renderLineup({
    lineup(shared_iris, width = "100%")
  })
}

# Run the application
shinyApp(ui = ui, server = server)

Hint:

In case you see scrollbars in each cell it is because of the font the cells are too narrow, you can specify a larger row height using

lineup(iris, options=list(rowHeight=20))

Authors

  • Samuel Gratzl (@sgratzl)
  • Datavisyn GmbH (@datavisyn)
Note that the project description data, including the texts, logos, images, and/or trademarks, for each open source project belongs to its rightful owner. If you wish to add or remove any projects, please contact us at [email protected].