All Projects → jrowen → Rhandsontable

jrowen / Rhandsontable

Licence: other
A htmlwidgets implementation of Handsontable.js

Programming Languages

javascript
184084 projects - #8 most used programming language
r
7636 projects

Projects that are alternatives of or similar to Rhandsontable

Manipulatewidget
Add More Interactivity to htmlwidgets
Stars: ✭ 110 (-65.62%)
Mutual labels:  shiny, htmlwidgets
RagGrid
R interface to ag-grid.
Stars: ✭ 31 (-90.31%)
Mutual labels:  shiny, htmlwidgets
Collapsibletree
Create Interactive Collapsible Tree Diagrams in R using D3.js
Stars: ✭ 126 (-60.62%)
Mutual labels:  shiny, htmlwidgets
Reactable
Interactive data tables for R
Stars: ✭ 345 (+7.81%)
Mutual labels:  shiny, htmlwidgets
jsTreeR
A wrapper of the jQuery plugin `jsTree`.
Stars: ✭ 36 (-88.75%)
Mutual labels:  shiny, htmlwidgets
Highcharter
R wrapper for highcharts
Stars: ✭ 583 (+82.19%)
Mutual labels:  shiny, htmlwidgets
Explor
Interfaces for Multivariate Analysis in R
Stars: ✭ 157 (-50.94%)
Mutual labels:  shiny, htmlwidgets
Dt
R Interface to the jQuery Plug-in DataTables
Stars: ✭ 451 (+40.94%)
Mutual labels:  shiny, htmlwidgets
rAmCharts4
An R interface to amCharts 4
Stars: ✭ 26 (-91.87%)
Mutual labels:  shiny, htmlwidgets
lineup htmlwidget
HTMLWidget wrapper of LineUp for Visual Analysis of Multi-Attribute Rankings
Stars: ✭ 51 (-84.06%)
Mutual labels:  shiny, htmlwidgets
Scatterd3
R scatter plot htmlwidget based on D3.js
Stars: ✭ 135 (-57.81%)
Mutual labels:  shiny, htmlwidgets
d3Tree
htmlwidget that binds d3js collapsible trees to R and Shiny to make an interactive search tool
Stars: ✭ 79 (-75.31%)
Mutual labels:  shiny, htmlwidgets
grillade
Grid sytem for shiny apps or rmarkdown and to create htmlwidgets matrix
Stars: ✭ 16 (-95%)
Mutual labels:  shiny, htmlwidgets
vueR
vue.js for R
Stars: ✭ 131 (-59.06%)
Mutual labels:  shiny, htmlwidgets
rfrappe
htmlwidget for frappe charts js library
Stars: ✭ 24 (-92.5%)
Mutual labels:  shiny, htmlwidgets
workshops-setup cloud analytics machine
Tips and Tricks to setup a cloud machine for Analytics and Data Science with R, RStudio and Shiny Servers, Python and JupyterLab
Stars: ✭ 12 (-96.25%)
Mutual labels:  shiny
Rinno
How to install local shiny apps
Stars: ✭ 255 (-20.31%)
Mutual labels:  shiny
topicApp
A simple Shiny App for Topic Modeling in R
Stars: ✭ 40 (-87.5%)
Mutual labels:  shiny
quickglobe
🌎 View Country Data via a 3D, D3, Globe 🌍
Stars: ✭ 22 (-93.12%)
Mutual labels:  htmlwidgets
Code
Compilation of R and Python programming codes on the Data Professor YouTube channel.
Stars: ✭ 287 (-10.31%)
Mutual labels:  shiny

Build Status AppVeyor Build Status CRAN_Status_Badge CRAN_Download_Badge

See the project website for more details and live examples, and see below for important details on use in shiny apps.

An htmlwidgets implementation of Handsontable.js. Per the website:

Handsontable is a minimalist Excel-like data grid editor for HTML & JavaScript

This library was inspired by the shinyTable package. Most of the original functionality was preserved, and the htmlwidgets framework made it possible to leverage even more of the Handsontable.js functionality.

Note: With v7, handsontable went to a more restrictive license for commercial use. To avoid license violations for existing users, rhandsontable will not update handsontable beyond v6.2.2. This may change in the future if a way is found to manage multiple handsontable versions.

See the vignette for detailed examples and links to shiny apps.

To install from CRAN use

install.packages("rhandsontable")

For the latest development version use

devtools::install_github("jrowen/rhandsontable")

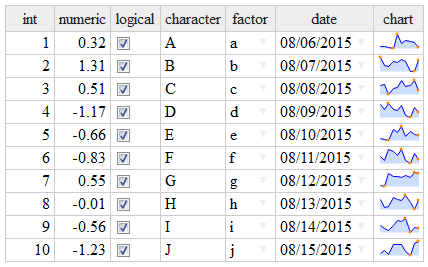
A simple example

library(rhandsontable)

DF = data.frame(int = 1:10,
                numeric = rnorm(10),
                logical = TRUE,
                character = LETTERS[1:10],
                fact = factor(letters[1:10]),
                date = seq(from = Sys.Date(), by = "days", length.out = 10),
                stringsAsFactors = FALSE)

# add a sparkline chart
DF$chart = sapply(1:10, function(x) jsonlite::toJSON(list(values=rnorm(10))))
                                                    
rhandsontable(DF, rowHeaders = NULL) %>%
  hot_col("chart", renderer = htmlwidgets::JS("renderSparkline"))

alt tag

A more involved shiny example

shiny::runGitHub("rhandsontable", "jrowen", subdir = "inst/examples/rhandsontable_corr")

Important note on shiny use: The htmlwidgets package creates widgets as shiny output bindings. The rhandsontable package also attempts to expose the table as a pseudo shiny input binding using handsontable change events (see here for the supported events). This means the table (e.g. hot) can be accessed in shiny using either input$hot or output$hot, but these values may not be in-sync. The timing of updates will depend on the particular reactive path followed by your shiny application.

Since the widget is not currently able to use the standard shiny input binding functionality, you will need to explicitly call the hot_to_r function to convert the handsontable data to an R object.

Two additional inputs are also enabled, input$hot_select and input$hot_comment, which will fire when a cell selection or a comment changes, respectively (if you would like to see more options, please post an issue or create a PR).

This functionality is still evolving, so please don't hesitate to share suggestions and PRs.

Note that the project description data, including the texts, logos, images, and/or trademarks, for each open source project belongs to its rightful owner. If you wish to add or remove any projects, please contact us at [email protected].