GuangchuangYu / Ncov2019
Programming Languages
Labels
Projects that are alternatives of or similar to Ncov2019
nCov2019: An R package with real-time data, historical data and Shiny app
Please visit https://github.com/YuLab-SMU/nCov2019 for an up-to-date version.
🏠 Data Sources
Real-time data
Historical data (three public data sources):
-
Wuhan-2019-nCoV GitHub repository.
- This data source contains detailed city level data in China, and country level data in worldwide.
-
National Health Commission of the People’s Republic of China
- This data source contains province level data in China.
-
- We collect historical city level data in China from this source.
-
-
We collect historical province level data for oversea countries form this source. (Start from 2020-03-15)
The user can obtain the historical provincial data in
China,South Korea,United States,Japan,Iran,Italy,GermanyandUnited Kingdomnow.For example, the below will return the historical data for Italy.
library(nCov2019)
nCov2019_set_country(country = 'Italy')
x['province'] # this will return Italy data only.
-
For more details see our vignette, Preprint, and Shiny app.
✍️ Authors
- Guangchuang YU (package creator and maintainer)
- School of Basic Medical Sciences, Southern Medical University
- https://guangchuangyu.github.io
- Xijin Ge (Shiny app)
- Department of Mathematics and Statistics, South Dakota State University
- https://www.sdstate.edu/directory/xijin-ge
- Tianzhi Wu, Erqiang Hu and Patrick Tung (contributors)
If you use nCov2019, please cite the following preprint:
Tianzhi Wu, Erqiang Hu, Xijin Ge*, Guangchuang Yu*. Open-source analytics tools for studying the COVID-19 coronavirus outbreak. medRxiv, 2020.02.25.20027433. doi: https://doi.org/10.1101/2020.02.25.20027433
⏬ Installation
Get the development version from github:
## install.packages("remotes")
remotes::install_github("GuangchuangYu/nCov2019")
-
get_nCov2019()to query online latest information -
load_nCov2019()to get historical data -
nCov2019_set_country()to set country options -
summaryand[to access data -
plotto present data on map -
dashboard()to open Shiny app dashboard
🎨 Example
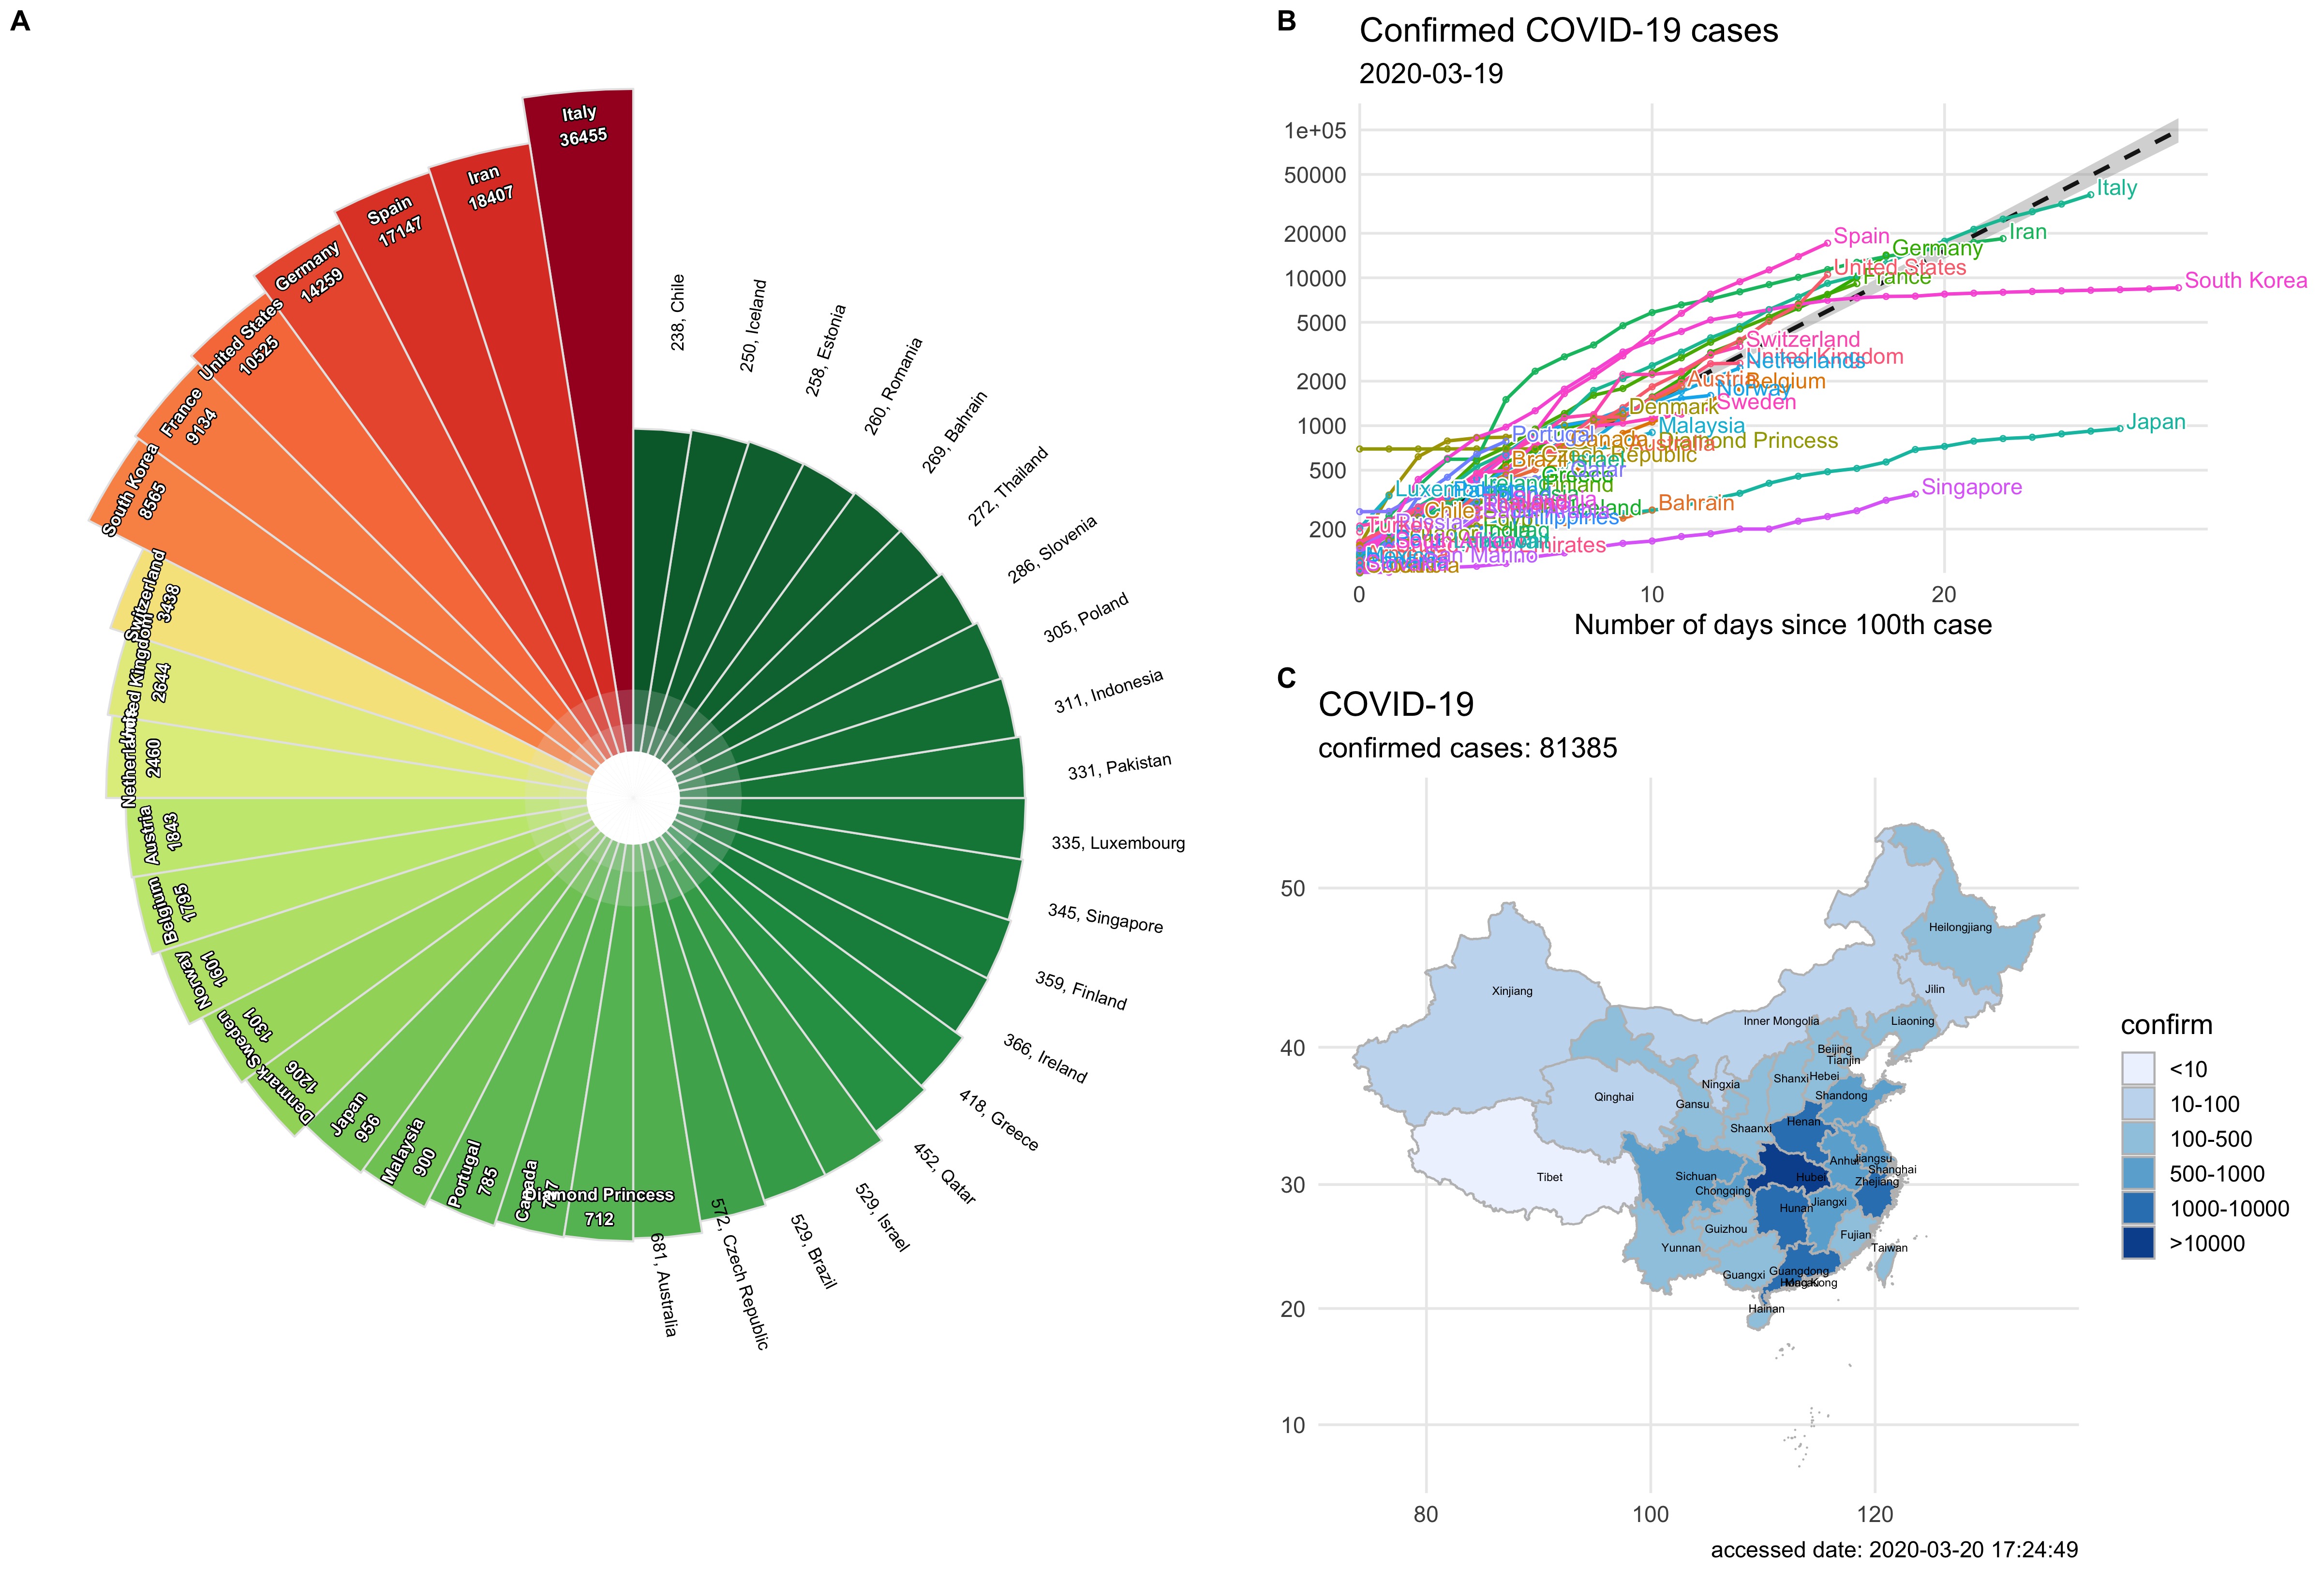
Run the script example.R in R using source("example.R"), will produce the following figure:
📖 Documents
- online vignette: nCov2019 for studying COVID-19 coronavirus outbreak
- An R Package to Explore the Novel Coronavirus
- 检索疫情数据的R包来了
- 各省市的疫情历史数据来了!
- 一次搞定所有的疫情地图
- nCov2019:历史数据实现自动更新
- nCov2019英文版,歪果仁也能用这次武汉疫情的数据了
- 新冠全球历史数据来了
- 当病毒R包nCov-2019遇上动图gganimate
- 爆款风玫瑰图:新冠肺炎全球疫情形势
- 螺旋的疫情图
- 欧洲很方,一不小心都要「意大利」了
📈 Shiny Apps that use nCov2019
- Coronavirus Tracking dashboard
- Novel Coronavirus Pneumonia (NCP-2019) Dashboard
- Coronavirus COVID-19 outbreak statistics and forecast
- 新冠状病毒统计和预测
- 新冠肺炎疫情分析平台


