eisman / Neo4jd3
Licence: mit
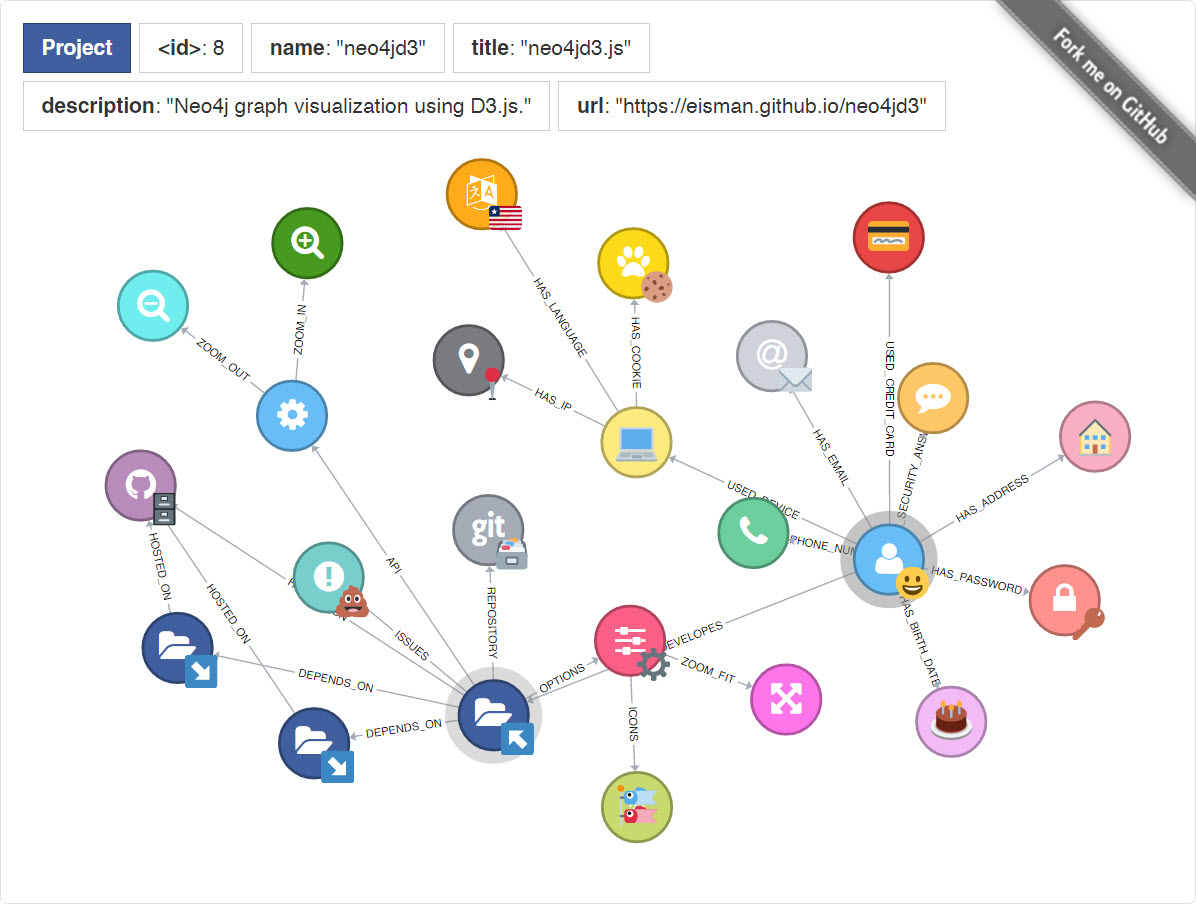
Neo4j graph visualization using D3.js
Stars: ✭ 843
Programming Languages
javascript
184084 projects - #8 most used programming language
Projects that are alternatives of or similar to Neo4jd3
turkeyvisited
Mark the cities you have visited in Turkey and share the map!
Stars: ✭ 82 (-90.27%)
Mutual labels: d3, d3js
emerge
emerge is a source code analysis tool and dependency visualizer that can be used to gather insights about source code structure, metrics, dependencies and complexity of software projects. After scanning the source code of a project it provides you an interactive web interface to explore and analyze your project by using graph structures.
Stars: ✭ 120 (-85.77%)
Mutual labels: graph-visualization, d3js
billboard
🎤 Lyrics/associated NLP data for Billboard's Top 100, 1950-2015.
Stars: ✭ 53 (-93.71%)
Mutual labels: d3, d3js
align covid
Coronavirus time series aligned by number of cases, not date.
Stars: ✭ 22 (-97.39%)
Mutual labels: d3, d3js
D3 Dot Graph
This module provides D3js compatible library to parse and load files in graphviz DOT (.dot) (graph description language) format.
Stars: ✭ 23 (-97.27%)
Mutual labels: d3, d3js
d3.geometer
[NOT MAINTAINED] A D3js library for drawing polytopes, angles, coordinates, geometries and more.
Stars: ✭ 18 (-97.86%)
Mutual labels: d3, d3js
Neovis.js
Neo4j + vis.js = neovis.js. Graph visualizations in the browser with data from Neo4j.
Stars: ✭ 748 (-11.27%)
Mutual labels: neo4j, graph-visualization
Carbon Charts
📊 📈⠀Robust dataviz framework implemented using D3 & typescript
Stars: ✭ 287 (-65.95%)
Mutual labels: d3, d3js
Doctor
基于知识图谱的医学诊断系统。Medical Diagnosis System Based on Knowledge Map.
Stars: ✭ 286 (-66.07%)
Mutual labels: neo4j, d3
Party Mode
An experimental music visualizer using d3.js and the web audio api.
Stars: ✭ 690 (-18.15%)
Mutual labels: d3, d3js
real-time-data-viz-d3-crossfilter-websocket-tutorial
Tutorial on real-time data visualization. Python websocket server & d3.js + crossfilter.js frontend
Stars: ✭ 32 (-96.2%)
Mutual labels: d3, d3js
leaflet heatmap
简单的可视化湖州通话数据 假设数据量很大,没法用浏览器直接绘制热力图,把绘制热力图这一步骤放到线下计算分析。使用Apache Spark并行计算数据之后,再使用Apache Spark绘制热力图,然后用leafletjs加载OpenStreetMap图层和热力图图层,以达到良好的交互效果。现在使用Apache Spark实现绘制,可能是Apache Spark不擅长这方面的计算或者是我没有设计好算法,并行计算的速度比不上单机计算。Apache Spark绘制热力图和计算代码在这 https://github.com/yuanzhaokang/ParallelizeHeatmap.git .
Stars: ✭ 13 (-98.46%)
Mutual labels: d3, d3js
game of life-elixir
An implementation of Conway's Game of Life in Elixir
Stars: ✭ 22 (-97.39%)
Mutual labels: d3, d3js
D3 Extended
Extends D3 with some common jQuery functions and more
Stars: ✭ 269 (-68.09%)
Mutual labels: d3, d3js
Ngx Charts
📊 Declarative Charting Framework for Angular
Stars: ✭ 4,057 (+381.26%)
Mutual labels: d3, d3js
neo4jd3.js
Neo4j graph visualization using D3.js.
Features
- Compaptible with the Neo4j data format and the D3.js data format.
- Force simulation.
- Info panel that shows nodes and relationships information on hover.
- Double click callbacks.
- Custom node colors by node type.
- Text nodes + Font Awesome icon nodes + SVG image nodes (e.g. using Twitter Emoji)).
- Sticky nodes (drag to stick, single click to unstick).
- Dynamic graph update (e.g. double click a node to expand it).
- Highlight nodes on init.
- Relationship auto-orientation.
- Zoom, pan, auto fit.
- Compatible with D3.js v4.
Running
First of all, make sure you have ruby and sass gem installed. Then, clone the repository, install all dependencies, build and serve the project.
> gem install sass
> git clone https://github.com/eisman/neo4jd3.git
> npm install
> gulp
Open http://localhost:8080 in your favorite browser.
Documentation
var neo4jd3 = new Neo4jd3('.selector', options);
Options
| Parameter | Type | Description |
|---|---|---|
| highlight | array | Highlight several nodes of the graph. Example: [{class: 'Project',property: 'name',value: 'neo4jd3'}]
|
| icons | object | Map node labels to Font Awesome icons. Example: {'BirthDate': 'birthday-cake','Password': 'lock','Phone': 'phone','User': 'user'}. |
| images | object | Map node labels to SVG images (e.g. using Twitter Emoji). Example: {'Address': 'img/twemoji/1f3e0.svg','BirthDate': 'img/twemoji/1f382.svg','Password': 'img/twemoji/1f511.svg','Project': 'img/twemoji/2198.svg','Project|name|neo4jd3': 'img/twemoji/2196.svg','User': 'img/twemoji/1f600.svg'}. |
| infoPanel | boolean | Show the information panel: true, false. Default: true. |
| minCollision | int | Minimum distance between nodes. Default: 2 * nodeRadius. |
| neo4jData | object | Graph data in Neo4j data format. |
| neo4jDataUrl | string | URL of the endpoint that serves the graph data in Neo4j data format. |
| nodeRadius | int | Radius of nodes. Default: 25. |
| onNodeClick | function | Callback function to be executed when the user clicks a node. |
| onNodeDoubleClick | function | Callback function to be executed when the user double clicks a node. |
| onNodeDragEnd | function | Callback function to be executed when the user finishes dragging a node. |
| onNodeDragStart | function | Callback function to be executed when the user starts dragging a node. |
| onNodeMouseEnter | function | Callback function to be executed when the mouse enters a node. |
| onNodeMouseLeave | function | Callback function to be executed when the mouse leaves a node. |
| onRelationshipDoubleClick | function | Callback function to be executed when the user double clicks a relationship. |
| zoomFit | boolean | Adjust the graph to the container once it has been loaded: true, false. Default: false. |
JavaScript API
| Function | Description |
|---|---|
| appendRandomDataToNode(d, maxNodesToGenerate) | Generates between 1 and maxNodesToGenerate random nodes connected to node d and updates the graph data. |
| neo4jDataToD3Data(data) | Converts data from Neo4j data format to D3.js data format. |
| randomD3Data(d, maxNodesToGenerate) | Generates between 1 and maxNodesToGenerate random nodes connected to node d. |
| size() | Returns the number of nodes and relationships. Example: {nodes: 25,relationships: 50}
|
| updateWithD3Data(d3Data) | Updates the graph data using the D3.js data format. |
| updateWithNeo4jData(neo4jData) | Updates the graph data using the Neo4j data format. |
| version() | Returns the version of neo4jd3.js. Example: '0.0.1'
|
Documentation
D3.js data format
{
    "nodes": [
        {
            "id": "1",
            "labels": ["User"],
            "properties": {
                "userId": "eisman"
            }
        },
        {
            "id": "8",
            "labels": ["Project"],
            "properties": {
                "name": "neo4jd3",
                "title": "neo4jd3.js",
                "description": "Neo4j graph visualization using D3.js.",
                "url": "https://eisman.github.io/neo4jd3"
            }
        }
    ],
    "relationships": [
        {
            "id": "7",
            "type": "DEVELOPES",
            "startNode": "1",
            "endNode": "8",
            "properties": {
                "from": 1470002400000
            },
            "source": "1",
            "target": "8",
            "linknum": 1
        }
    ]
}
Neo4j data format
{
    "results": [
        {
            "columns": ["user", "entity"],
            "data": [
                {
                    "graph": {
                        "nodes": [
                            {
                                "id": "1",
                                "labels": ["User"],
                                "properties": {
                                    "userId": "eisman"
                                }
                            },
                            {
                                "id": "8",
                                "labels": ["Project"],
                                "properties": {
                                    "name": "neo4jd3",
                                    "title": "neo4jd3.js",
                                    "description": "Neo4j graph visualization using D3.js.",
                                    "url": "https://eisman.github.io/neo4jd3"
                                }
                            }
                        ],
                        "relationships": [
                            {
                                "id": "7",
                                "type": "DEVELOPES",
                                "startNode": "1",
                                "endNode": "8",
                                "properties": {
                                    "from": 1470002400000
                                }
                            }
                        ]
                    }
                }
            ]
        }
    ],
    "errors": []
}
Example
Live example @ https://eisman.github.io/neo4jd3/
var neo4jd3 = new Neo4jd3('#neo4jd3', {
    highlight: [
        {
            class: 'Project',
            property: 'name',
            value: 'neo4jd3'
        }, {
            class: 'User',
            property: 'userId',
            value: 'eisman'
        }
    ],
    icons: {
        'Api': 'gear',
        'BirthDate': 'birthday-cake',
        'Cookie': 'paw',
        'Email': 'at',
        'Git': 'git',
        'Github': 'github',
        'Ip': 'map-marker',
        'Issues': 'exclamation-circle',
        'Language': 'language',
        'Options': 'sliders',
        'Password': 'asterisk',
        'Phone': 'phone',
        'Project': 'folder-open',
        'SecurityChallengeAnswer': 'commenting',
        'User': 'user',
        'zoomFit': 'arrows-alt',
        'zoomIn': 'search-plus',
        'zoomOut': 'search-minus'
    },
    images: {
        'Address': 'img/twemoji/1f3e0.svg',
        'BirthDate': 'img/twemoji/1f5d3.svg',
        'Cookie': 'img/twemoji/1f36a.svg',
        'CreditCard': 'img/twemoji/1f4b3.svg',
        'Device': 'img/twemoji/1f4bb.svg',
        'Email': 'img/twemoji/2709.svg',
        'Git': 'img/twemoji/1f5c3.svg',
        'Github': 'img/twemoji/1f5c4.svg',
        'icons': 'img/twemoji/1f38f.svg',
        'Ip': 'img/twemoji/1f4cd.svg',
        'Issues': 'img/twemoji/1f4a9.svg',
        'Language': 'img/twemoji/1f1f1-1f1f7.svg',
        'Options': 'img/twemoji/2699.svg',
        'Password': 'img/twemoji/1f511.svg',
        'Project|name|d3': 'img/twemoji/32-20e3.svg',
        'Project|name|neo4j': 'img/twemoji/33-20e3.svg',
        'Project|name|neo4jd3': 'img/twemoji/31-20e3.svg',
        'User': 'img/twemoji/1f600.svg'
    },
    minCollision: 60,
    neo4jDataUrl: 'json/neo4jData.json',
    nodeRadius: 25,
    onNodeDoubleClick: function(node) {
        switch(node.id) {
            case '25':
                // Google
                window.open(node.properties.url, '_blank');
                break;
            default:
                var maxNodes = 5,
                    data = neo4jd3.randomD3Data(node, maxNodes);
                neo4jd3.updateWithD3Data(data);
                break;
        }
    },
    zoomFit: true
});
What's coming?
- Toolbar.
- More than one relationship between two nodes.
- Markers.
- Performance optimization.
- Testing.
Copyright and license
Code and documentation copyright 2016 the author. Code released under the MIT license. Docs released under Creative Commons.
Note that the project description data, including the texts, logos, images, and/or trademarks,
for each open source project belongs to its rightful owner.
If you wish to add or remove any projects, please contact us at [email protected].