All Projects → imdada → Overwatch

imdada / Overwatch

Licence: bsd-3-clause
Overwatch is a general RPC monitoring system.

Programming Languages

typescript
32286 projects

Projects that are alternatives of or similar to Overwatch

Perspective
A data visualization and analytics component, especially well-suited for large and/or streaming datasets.
Stars: ✭ 3,989 (+969.44%)
Mutual labels:  data-visualization
Dashboard
falcon-plus frontend
Stars: ✭ 344 (-7.77%)
Mutual labels:  data-visualization
Articles
A repository for the source code, notebooks, data, files, and other assets used in the data science and machine learning articles on LearnDataSci
Stars: ✭ 350 (-6.17%)
Mutual labels:  data-visualization
Corner.py
Make some beautiful corner plots
Stars: ✭ 327 (-12.33%)
Mutual labels:  data-visualization
Dash Docs
📖 The Official Dash Userguide & Documentation
Stars: ✭ 338 (-9.38%)
Mutual labels:  data-visualization
Honeypot
Low interaction honeypot that displays real time attacks
Stars: ✭ 348 (-6.7%)
Mutual labels:  data-visualization
Swiftplot
Swift library for Data Visualization 📊
Stars: ✭ 319 (-14.48%)
Mutual labels:  data-visualization
React Vis Force
d3-force graphs as React Components.
Stars: ✭ 372 (-0.27%)
Mutual labels:  data-visualization
Kbn network
Network Plugin for Kibana
Stars: ✭ 339 (-9.12%)
Mutual labels:  data-visualization
Animatplot
A python package for animating plots build on matplotlib.
Stars: ✭ 359 (-3.75%)
Mutual labels:  data-visualization
React Jsx Highcharts
Highcharts built with proper React components
Stars: ✭ 336 (-9.92%)
Mutual labels:  data-visualization
Nyc Buildings
An interactive 3D visualization of the all the buildings in Manhattan.
Stars: ✭ 338 (-9.38%)
Mutual labels:  data-visualization
Dataviz
Build and Visualize data structures in Golang
Stars: ✭ 348 (-6.7%)
Mutual labels:  data-visualization
Davinci
Davinci is a DVsaaS (Data Visualization as a Service) Platform
Stars: ✭ 3,997 (+971.58%)
Mutual labels:  data-visualization
Treeverse
A browser extension for navigating burgeoning Twitter conversations
Stars: ✭ 365 (-2.14%)
Mutual labels:  data-visualization
Joypy
Joyplots in Python with matplotlib & pandas 📈
Stars: ✭ 322 (-13.67%)
Mutual labels:  data-visualization
Chronos
📊 📊 📊 Monitors the health and web traffic of servers, microservices, and containers with real-time data monitoring and receive automated notifications over Slack or email.
Stars: ✭ 347 (-6.97%)
Mutual labels:  monitoring-tool
Data Science
Collection of useful data science topics along with code and articles
Stars: ✭ 315 (-15.55%)
Mutual labels:  data-visualization
Troika
A JavaScript framework for interactive 3D and 2D visualizations
Stars: ✭ 342 (-8.31%)
Mutual labels:  data-visualization
Csharp Data Visualization
Code examples and notes for displaying data with C#
Stars: ✭ 355 (-4.83%)
Mutual labels:  data-visualization

Overwatch

See demo here | or here

Overwatch is a general RPC monitoring system for distributed systems, utilizing D3 force layout as main diagram.

Overwatch provides an overview of the current state of the entire system, making it super easy for system administrators to understand the ongoing RPC events and pinpoint the source of failure in the system.

Unlike common monitoring systems, a well-designed graph (with D3 force layout) is used to visualize data.

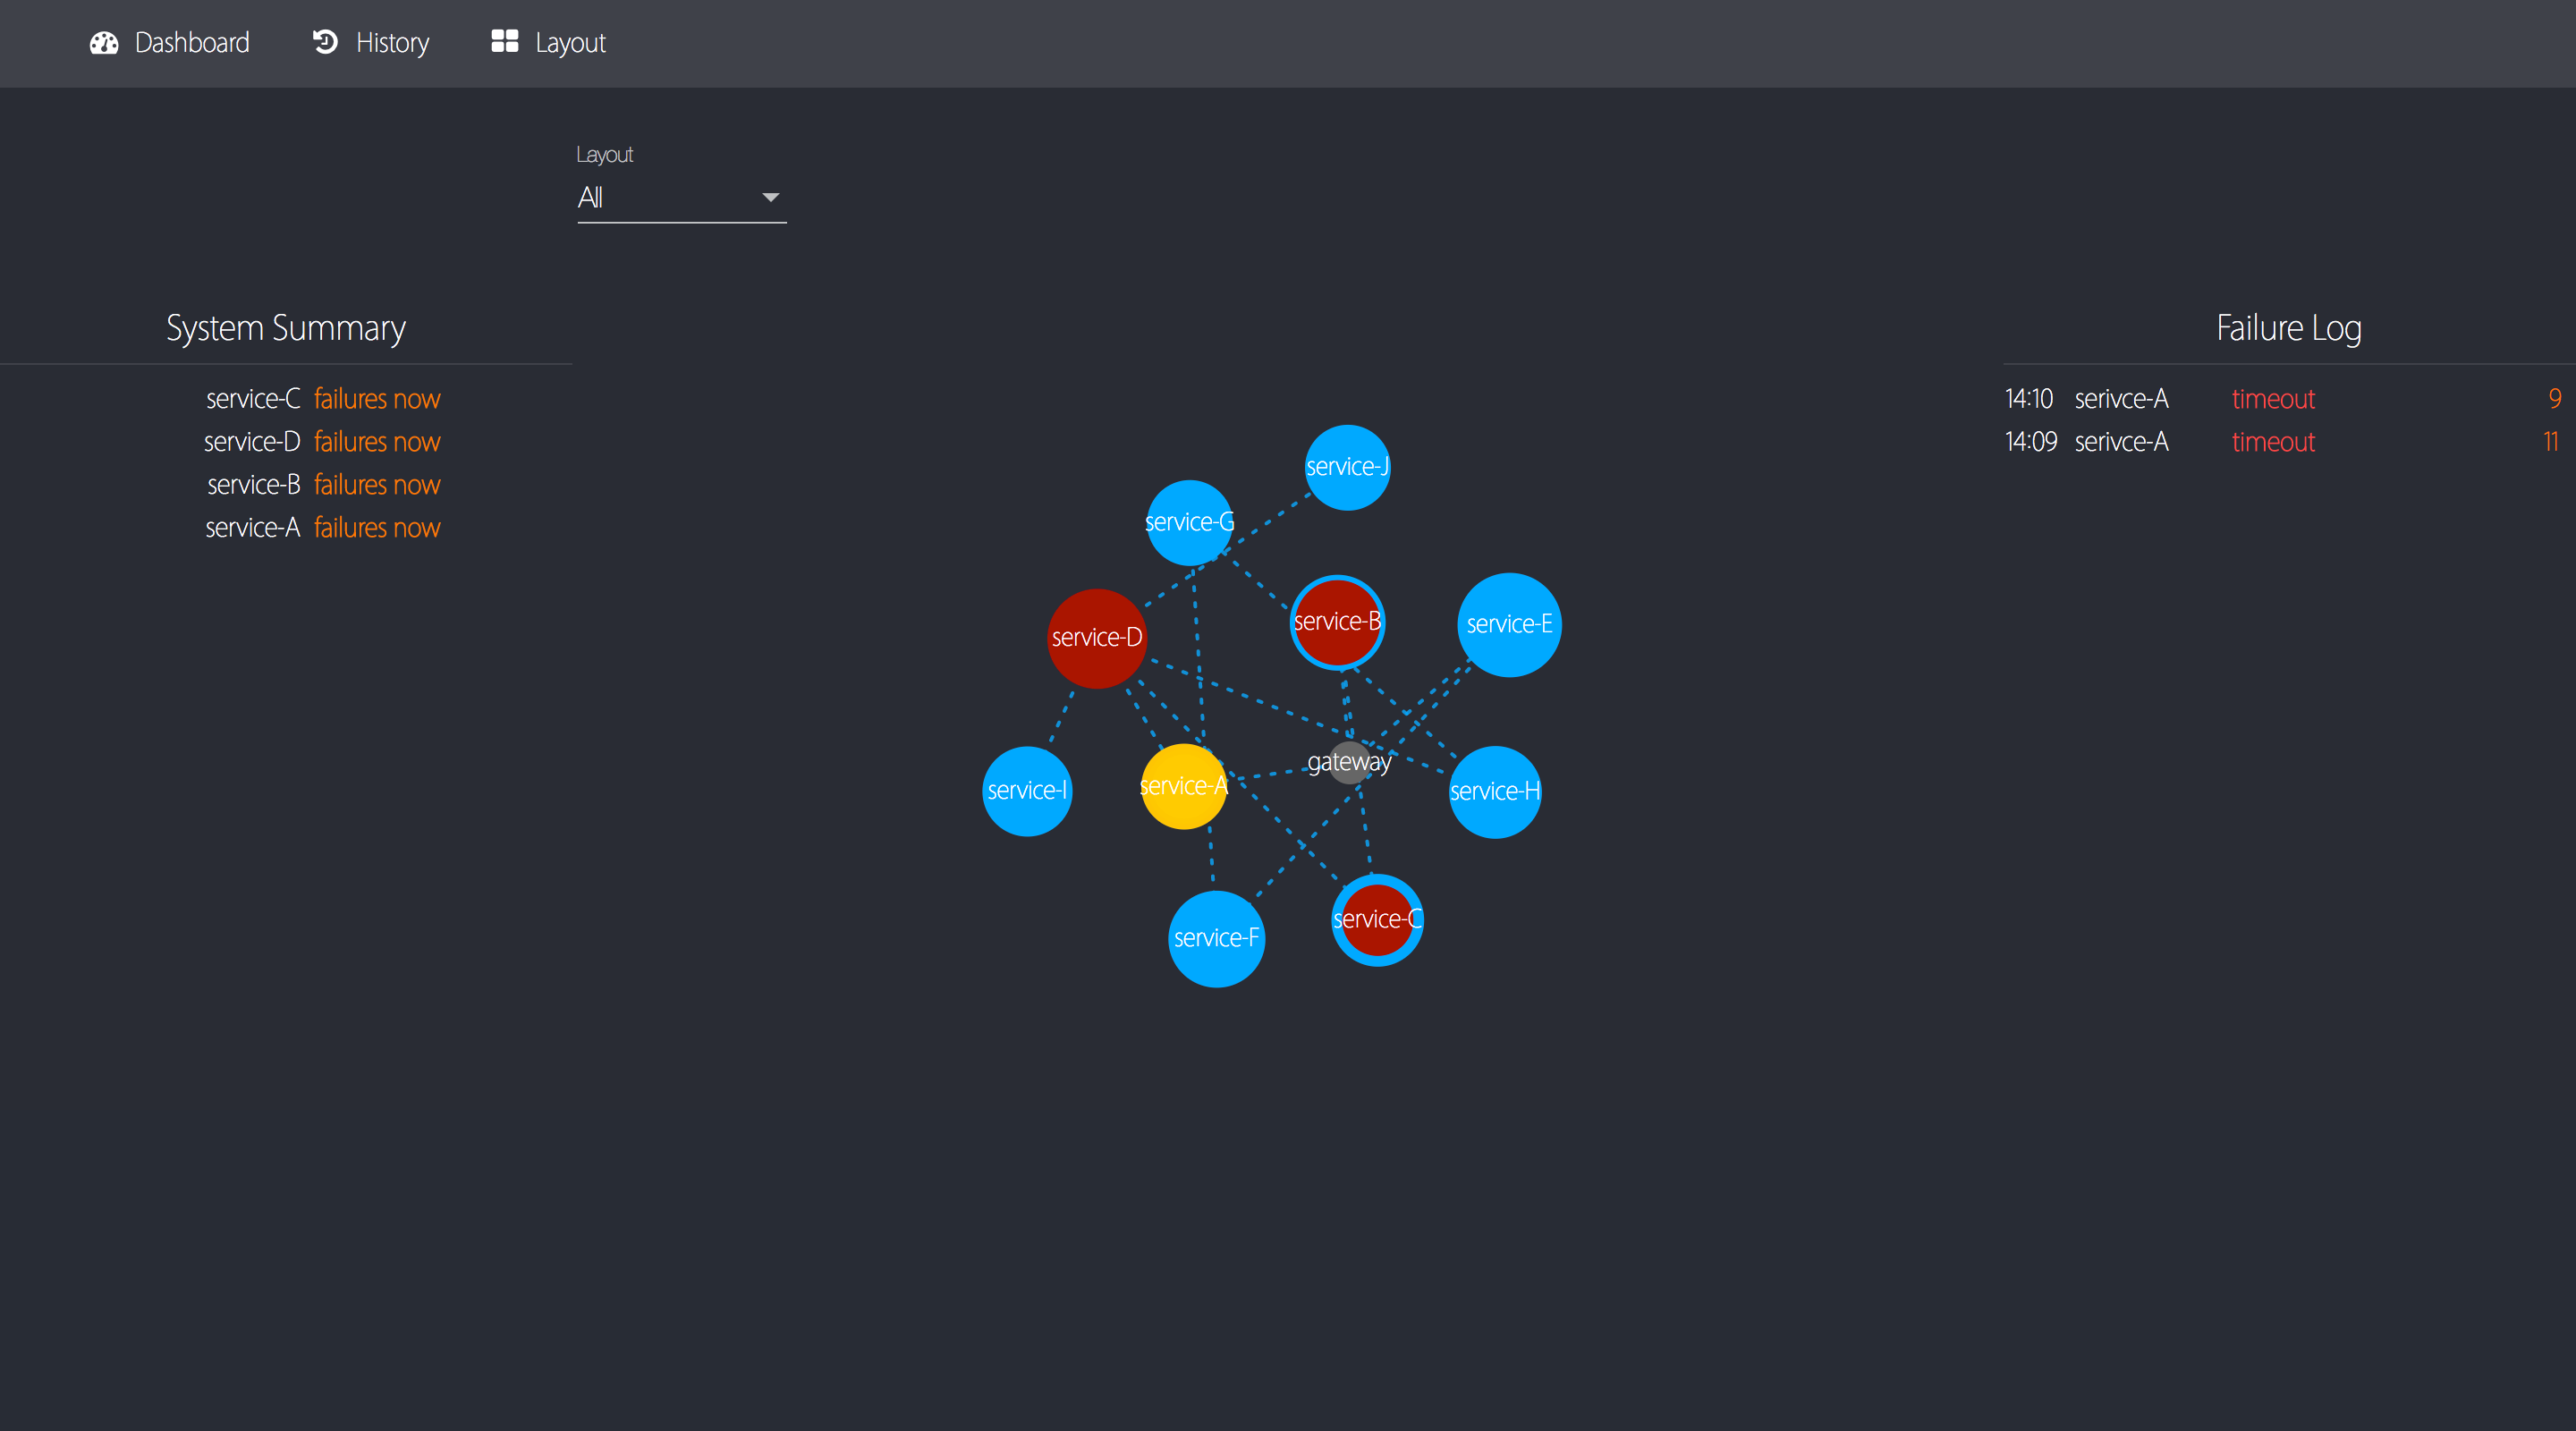
  • every circle represents a system
  • every line represents a dependency between two systems
  • rpm = requests per minute, fpm = failure per minute
  • circle size indicates rpm of the system
  • line dash density indicates rpm between two systems
  • circle color indicates the health of the system in the last 1 minute
  • two additional ring outside the circle inicates the health of the system in the past 5 minutes and 15 minutes

Installation

Download release version (not available yet...)

Or use install.sh to build from source

Dependencies

  • NodeJS / NPM
  • RDBMS (MySQL is recommended)
  • Redis (Optional)

Getting Started

After proper installation, you have to

  1. modify config files server/app/config.json & web/src/environments/environment.ts

  2. start server: under server run

$ npm start
  1. build & serve web content: under web run

for testing:

$ npm start

then visit localhost:4200

for production:

$ npm run build

then serve static directory web/dist with Nginx (or whatever)


Submiting Statistics

Send individual server stats via Socket.IO client

This is recommended for testing.

Demo: SocketIODemo.java

Send individual server stats via Redis pub/sub

This is recommended for small-scale systems to publish stats.

Demo: RedisDemo.java

Send aggregated server stats via REST

This is the recommended method for large & complex systems to publish aggregated stats.

Demo: rest-demo.sh

Licensing

Please see LICENSE for more info.

Contributing

Please see CONTRIBUTING for more info.

Note that the project description data, including the texts, logos, images, and/or trademarks, for each open source project belongs to its rightful owner. If you wish to add or remove any projects, please contact us at [email protected].