sergiitk / Pagerbeauty
Programming Languages
Projects that are alternatives of or similar to Pagerbeauty
Pager Beauty 

Add concise PagerDuty on-call widget to your monitoring dashboard. Live Demo!
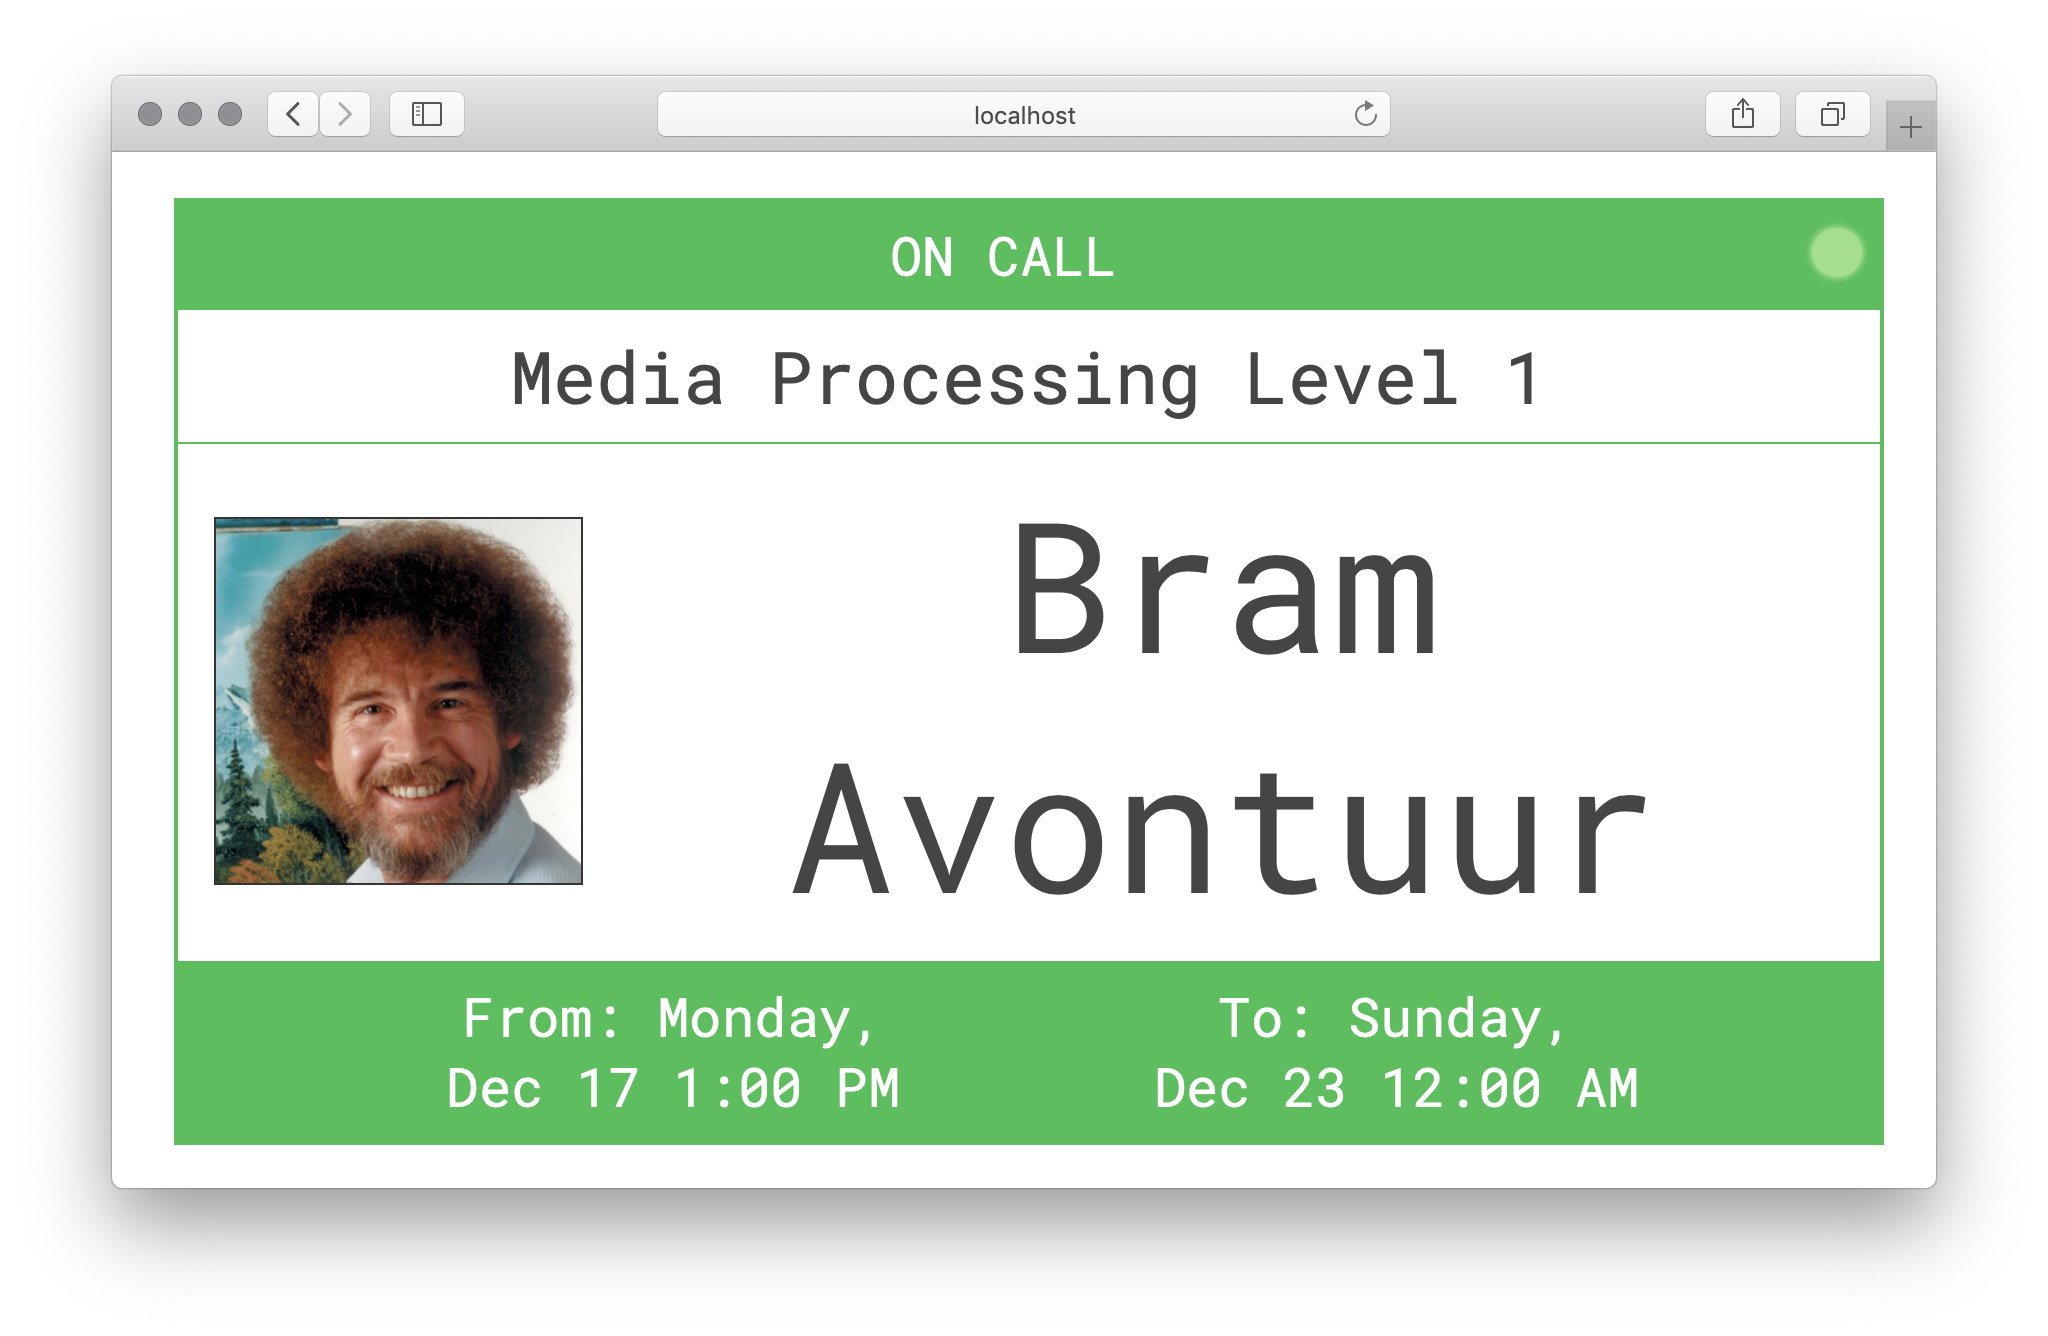
Who's on-call?
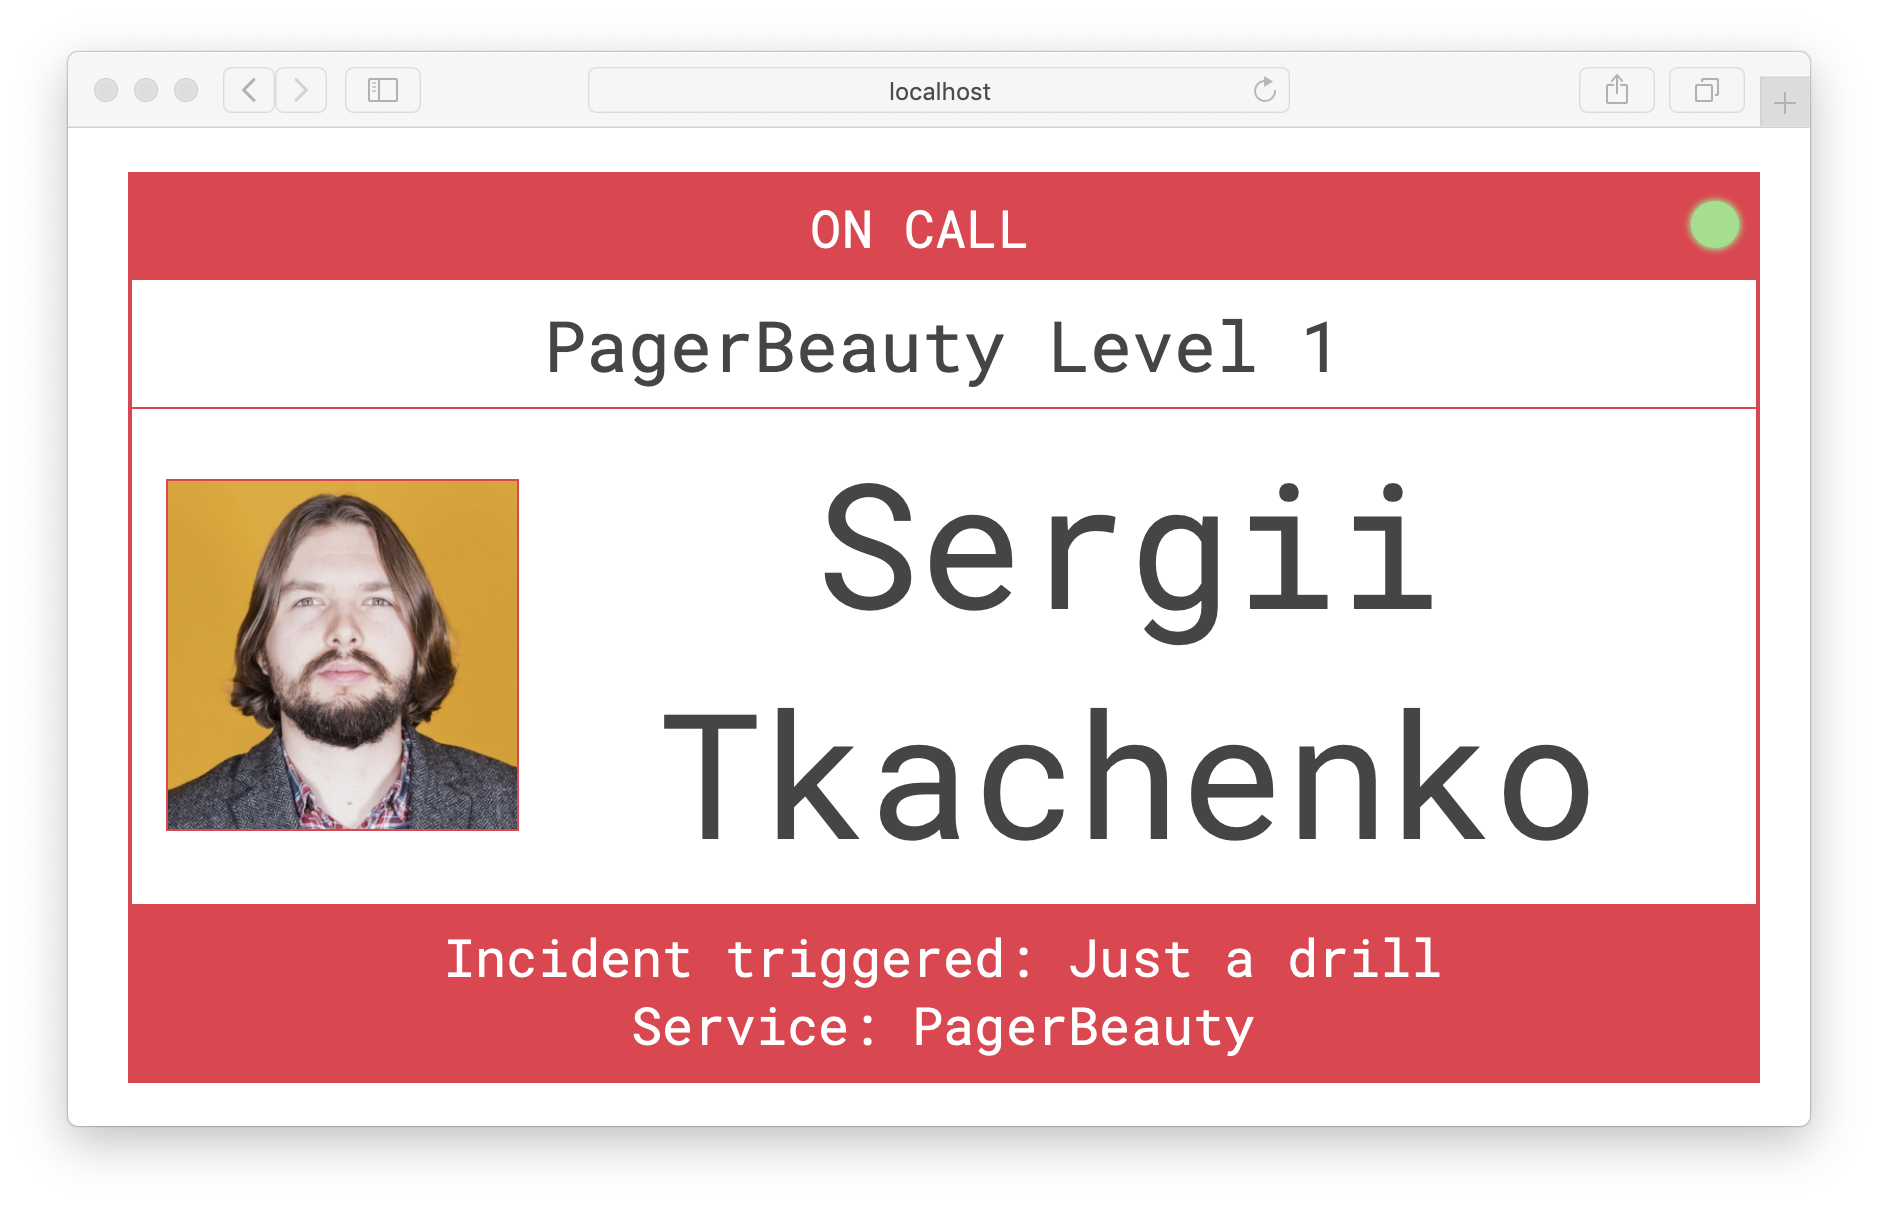
Active PagerDuty Incident
PagerBeauty on Real Datadog Dashboard

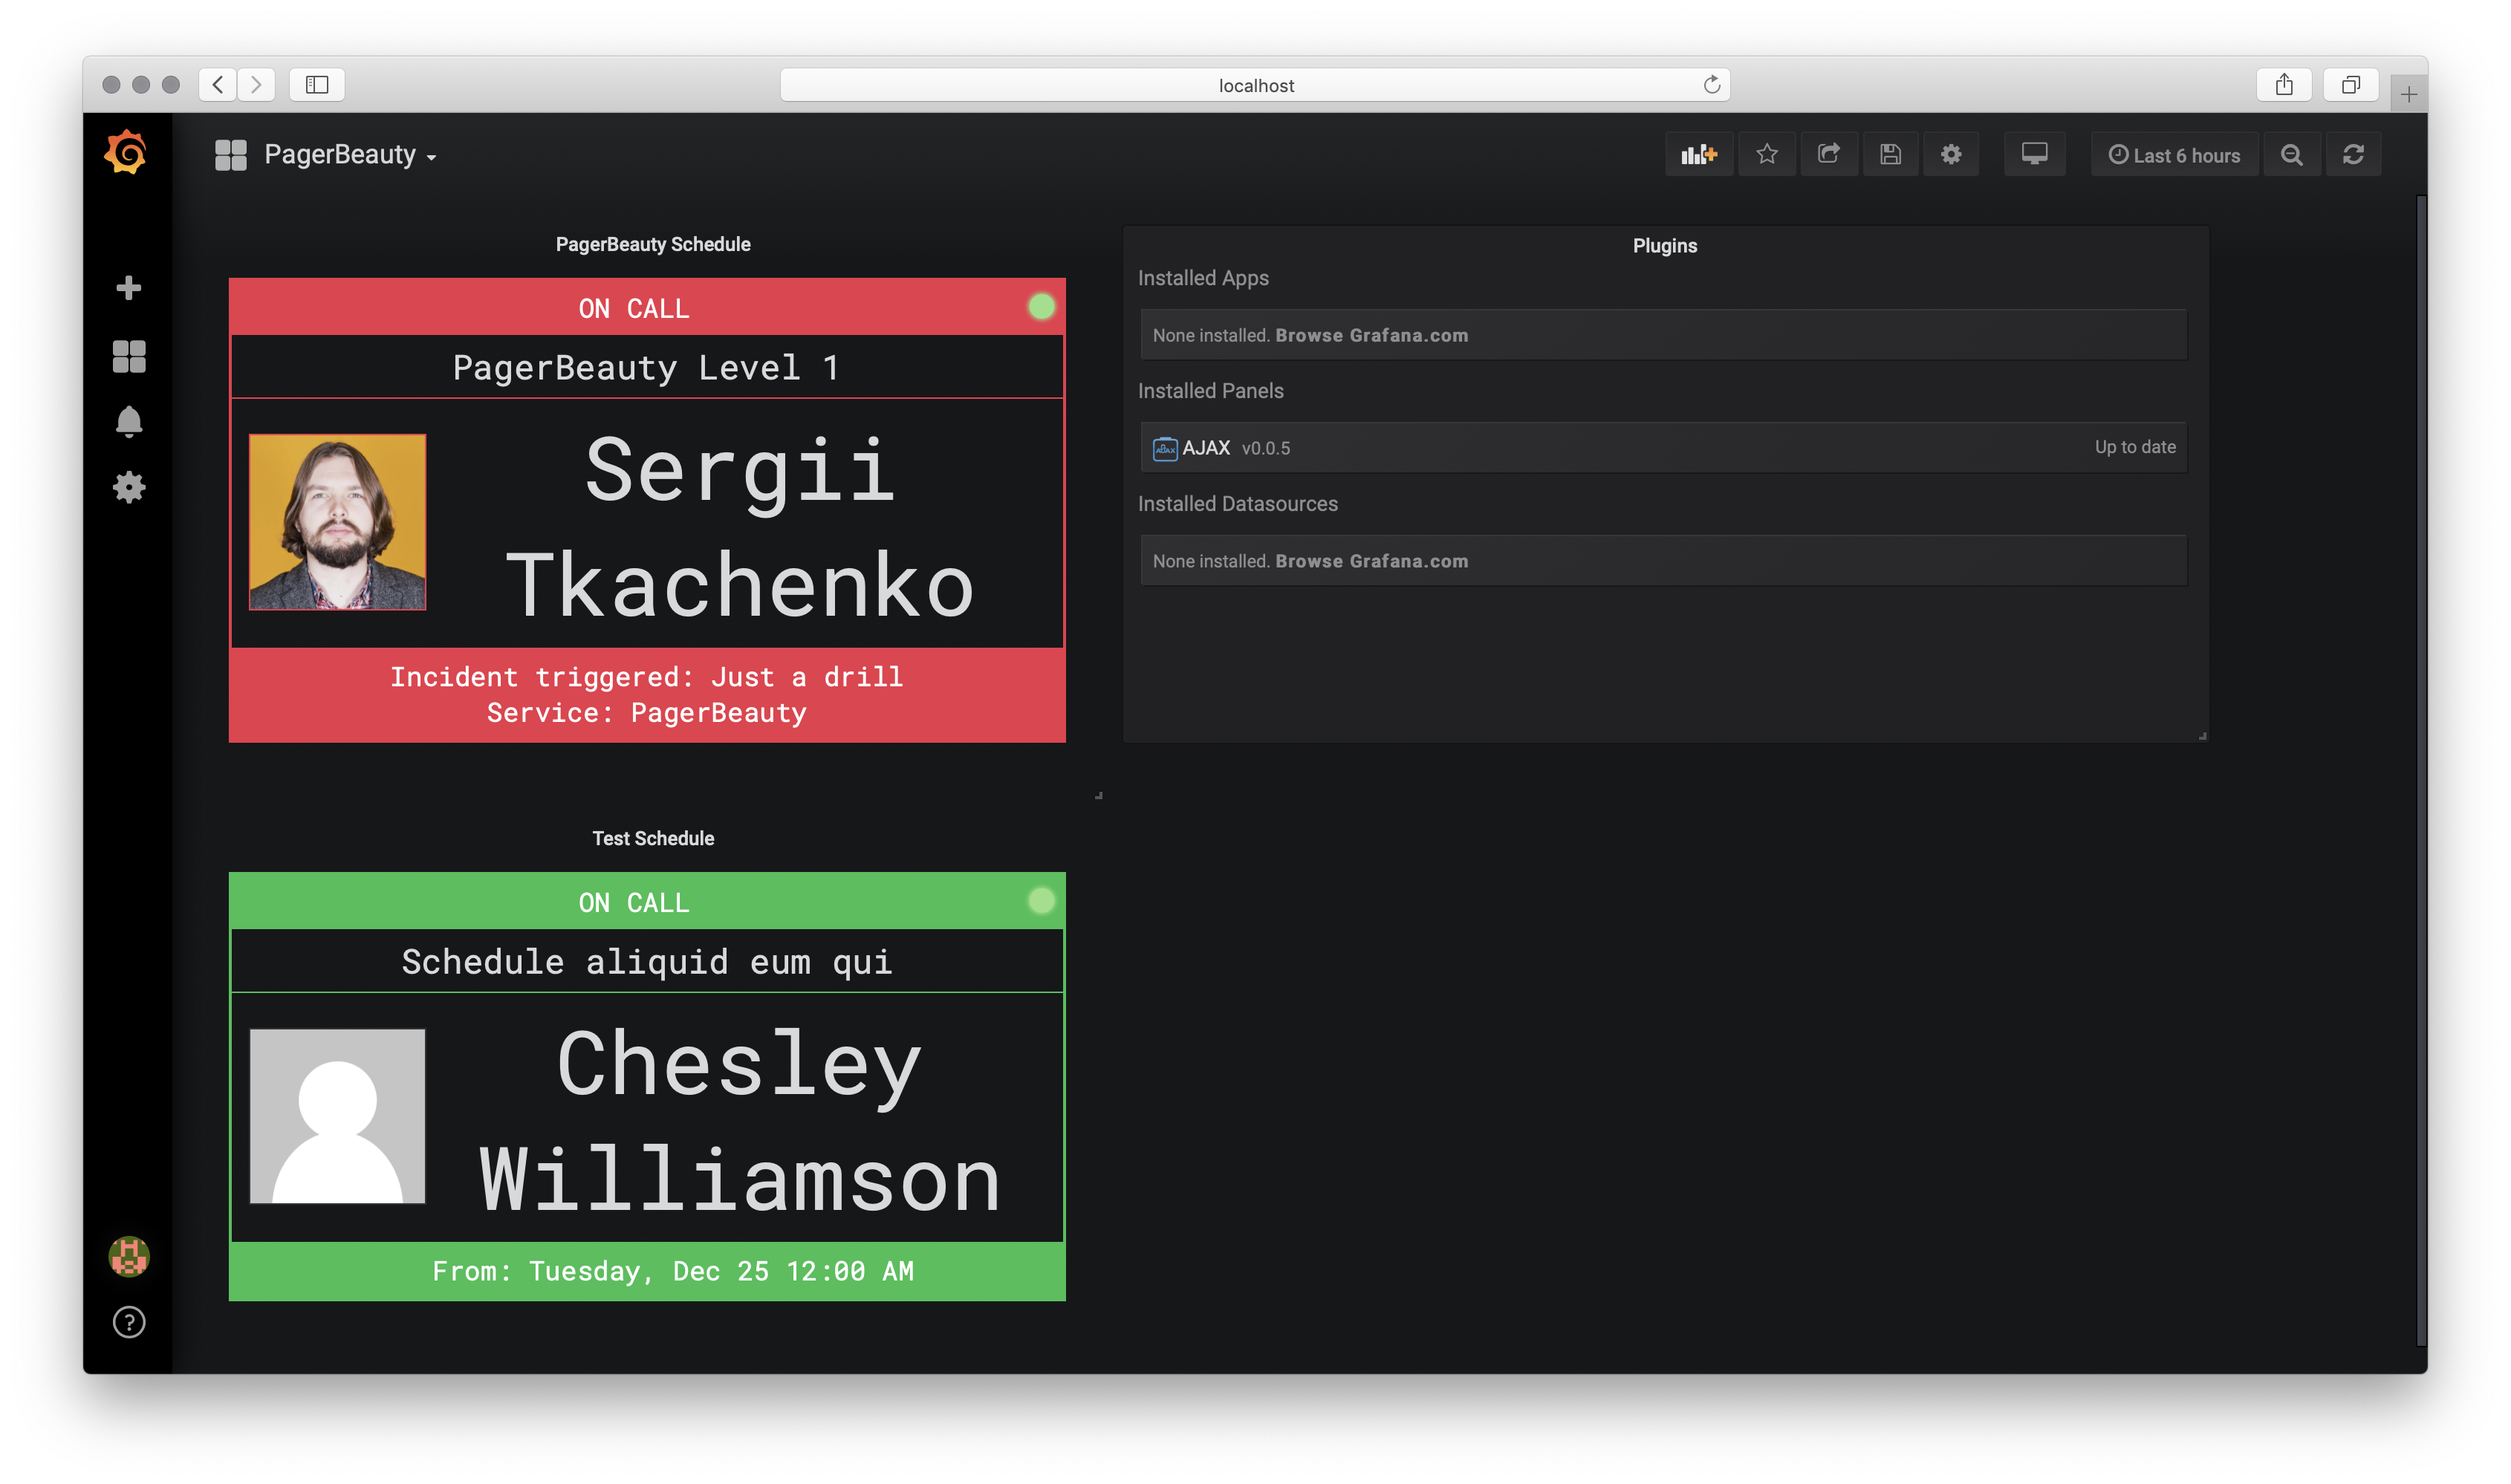
PagerBeauty on Grafana Dashboard
Running on Heroku

The easiest way give PagerBeauty a run is one-click deployment using Heroku Button.
Refer to advanced PagerBeauty on Heroku documentation
for manual deployments using Heroku CLI and keeping PagerBeauty up-to-date.
Running on AWS
PagerBeauty is available as a CloudFourmation template. Refer to advanced PagerBeauty on AWS manual.
Running with Docker
Docker repo: sergiitk/pagerbeauty
You can run PagerBeauty locally on your infrastructure using Docker.
Create .env file as instructed in configuration and run:
docker run --rm -p 8080:8080 --env-file=.env -it sergiitk/pagerbeauty:latest
Or set individual environment variables as needed:
docker run --rm -p 8080:8080 -e PAGERBEAUTY_PD_API_KEY=yourkey -e PAGERBEAUTY_PD_SCHEDULES=SCHEDL1,SCHEDL2 -it sergiitk/pagerbeauty:latest
Example running PagerBeauty using test key:
docker run --rm -p 8080:8080 -e PAGERBEAUTY_PD_API_KEY=y_NbAkKc66ryYTWUXYEu -e PAGERBEAUTY_PD_SCHEDULES=PJ1P5JQ,P538IZH -it sergiitk/pagerbeauty:latest
Running with Node
NPM repo: pagerbeauty
Setup PagerBeauty by following configuration section and run:
yarn add pagerbeauty
node -r esm node_modules/pagerbeauty/src/pagerbeauty.js
Configuration
Configure PagerBeauty with .env file or by exporting environment variables:
# For Docker compatibility, do not placed quotation marks around the values.
# https://docs.docker.com/compose/env-file/

# PagerDuty REST API v2 Access Key (Read-only)
# Docs: https://support.pagerduty.com/docs/using-the-api
PAGERBEAUTY_PD_API_KEY=yourkey

# Comma-separated list of PagerDuty schedule ids
# You can find schedule id in the URL of the schedule on PagerDuty website after symbol #
# For example, schedule https://example.pagerduty.com/schedules#PJ1P5JQ has id PJ1P5JQ
PAGERBEAUTY_PD_SCHEDULES=SCHEDL1,SCHEDL2

# (Optional) How often to refresh the schedules, in minutes.
# Default: 10.
# PAGERBEAUTY_REFRESH_RATE_MINUTES=10

# (Optional) Disable polling for active incidents.
# Default: false
# PAGERBEAUTY_INCIDENTS_DISABLE=true

# (Optional) How often to refresh active incidents, in minutes.
# Default: 1
# PAGERBEAUTY_INCIDENTS_REFRESH_RATE_MINUTES=5

# (Optional) Enable user phone fetching on schedule loading
# Default: false
# PAGERBEAUTY_LOAD_USER_CONTACT_METHODS=true

# (Optional) Highest logging level to include into application logs.
# One of: error, warn, info, verbose, debug, silly
# Default: info
# PAGERBEAUTY_LOG_LEVEL=verbose

# (Optional) Log format. One of:
# machine - Machine-readable JSON format
# human   - Human-readable colorized format
# Default: resolved to `human` for development and `machine` for production.
# PAGERBEAUTY_LOG_FORMAT=machine

# (Optional) The port for HTTP server to listen on.
# Default: 8080
# PAGERBEAUTY_HTTP_PORT=80

# (Optional) Enable basic HTTP authentication
# Default: disabled
# PAGERBEAUTY_HTTP_USER=basic_username
# PAGERBEAUTY_HTTP_PASSWORD=basic_password

# (Optional) Enable authentication access token (RFC6750)
# Note: embedding iframes that link to a page with basic HTTP name/password
# authentication is not supported by most modern browsers. To bypass it, you
# can set random access_token and append it to schedule URL. For example, if you can't embed schedule
# https://pb.example.com/v1/schedules/P538IZH.html, you can append your access token like so:
# https://pb.example.com/v1/schedules/P538IZH.html?acccess_token=your_token
# This link is embeddable now. Please use HTTPS.
# Default: disabled
# PAGERBEAUTY_HTTP_ACCESS_TOKEN=your_token
Adding to Datadog dashboard
- Open the schedules list in PagerBeauty. Make sure the app is running behind HTTPS
- Find the schedule you want to embed, copy its URL
- Open your Datadog dashboard, click
Edit Board. - Drag
IFramewidget to the board - Paste copied PagerBeauty schedule URL to
IFrame URLon Datadog board - Resize and save!
Add to Grafana dashboard

- Install AJAX plugin:
grafana-cli plugins install ryantxu-ajax-panel - Restart Grafana Server
- Open the schedules list in PagerBeauty
- Find the schedule you want to embed, open it, copy its URL
- Open your Grafana dashboard, click "Add Panel"
- Select
AJAXpanel - Click
Panel title->Edit - On
Requesttab, fill out:
URL: paste copied PagerBeauty schedule URL
Method:iframe
Parameters:{ theme: "grafana" } - On
Generaltab, set your panel title and checkTransparent - Close panel edit, resize and save!
FAQ
How it works?
PagerBeauty acts as a local cache server for PagerDuty schedules. It fetches and refreshes PagerDuty schedules in the background using secret PagerDuty API key and makes them available through web interface. This is done to protect your secret API key from public exposure. This means you'll need to run PagerBeauty as a service.
How to add my userpic?
PagerDuty uses Gravatar to manage profile photos. If you already have a Gravatar account, you can attach your PagerDuty login email to this account.
How can I set a custom timezone?
By default From and To fields are displayed in the timezone of the schedule.
You can override this by adding ?timezone=value to schedule URL. Use any timezone value supported by luxon. Examples:
- Local to the client browser:
?timezone=local - UTC:
?timezone=UTC - Any UTC offset:
?timezone=UTC+5 - Any IANA Timezone:
?timezone=Europe/Kiev
Contributing
Contribution guide and step-by-step local development instructions.
The source code of Pager Beauty is maintained by @sergiitk.
It's an Open Source project under MIT License. Contributions are welcomed. Follow the usual GitHub Pull Request process. Be nice.
Roadmap
-
2019-04-01 – 2019-10-01: Maintentnce mode: security and depdendency updates. -
2020-10-01 — 2021-03-01: Major features, see Version 2.0.
Version 1.0
- [x] Load and process on-calls
- [x] JSON response
- [x] HTML response
- [x] HTML responsive layout
- [x] Basic autorefresh
- [x] MVP: Embed in Datadog dashboard as an iframe
- [x] Show dates in local time
- [x] Configurable refresh period
- [x] HTTP Basic Authentication
- [x] On-call TimeZone is loaded from the PagerDuty schedule settings
- [x] Application logging
- [x] Ajax refresh
- [x] Automated Testing
- [x] Automated Builds
- [x] No limit on the total number of schedules supported
- [x] Make on-call view red during an active incident
- [x] HTTP authentication bypass support for embeds
Version 2.0
- [ ] Built-in SSL Support
- [ ] Next on duty
Version 3.0
- [ ] Websocket refresh
Documentation and examples
- [x] Live demo on Heroku
- [x] Example: Heroku
- [ ] Example: Custom SSL certificate using Docker
- [ ] Example: Digital Ocean
Sponsors and Supporters
| JW Player |
Questions?
Ask me on Twitter: @sergiitk
License
Pager Beauty is released under the MIT License.