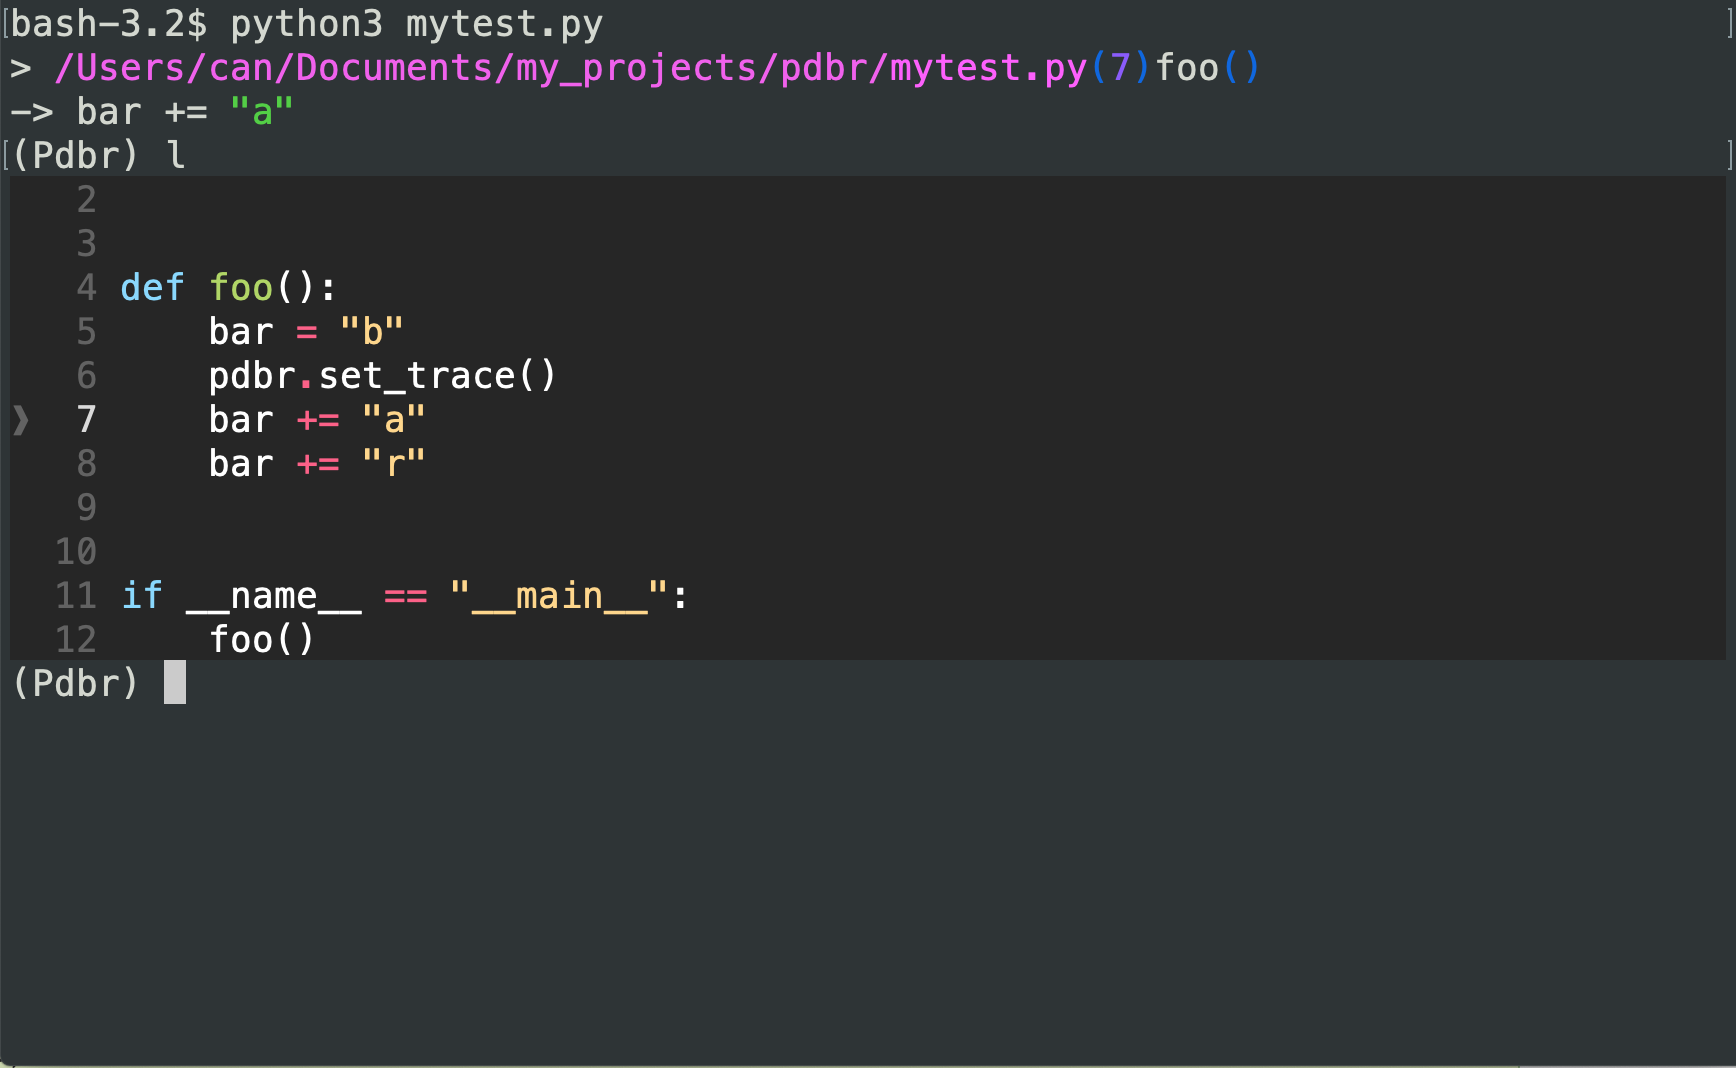
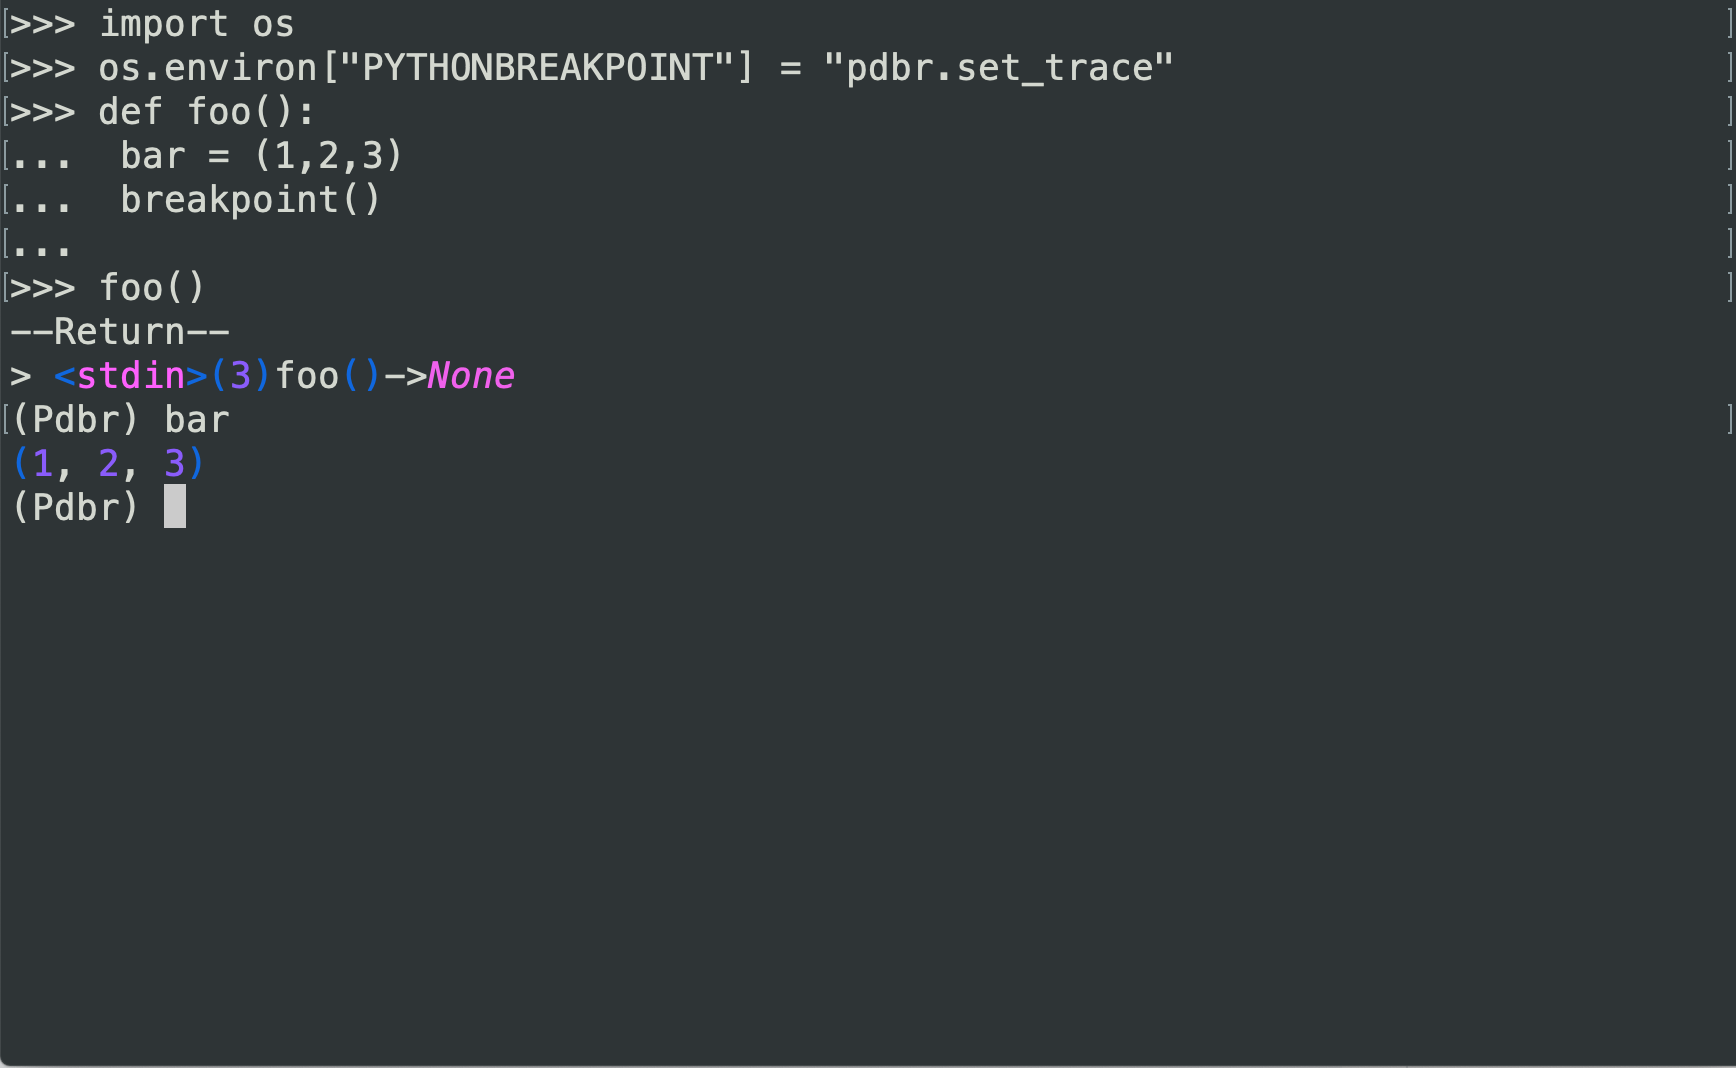
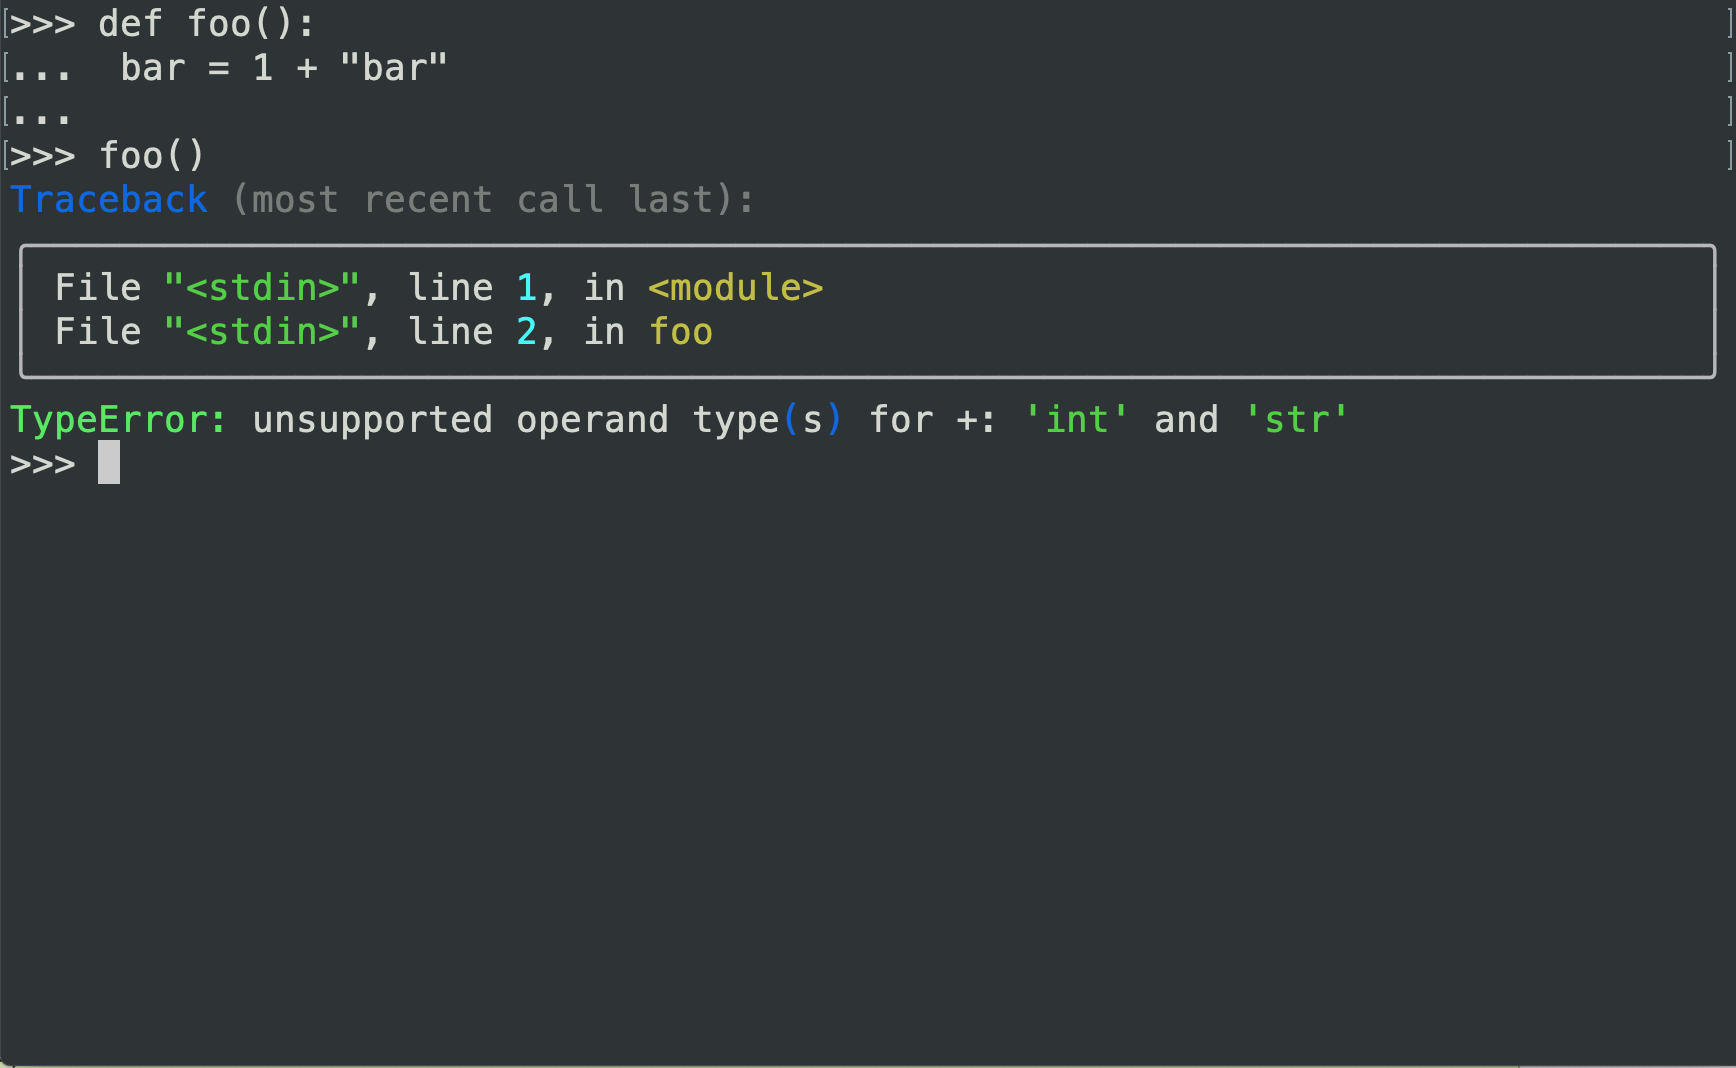
All Projects → cansarigol → Pdbr

cansarigol / Pdbr

Licence: mit
pdb + Rich library

Programming Languages

python
139335 projects - #7 most used programming language

Projects that are alternatives of or similar to Pdbr

Pudb
Full-screen console debugger for Python
Stars: ✭ 2,267 (+2261.46%)
Mutual labels:  ipython, debugger, pdb
Ipdb
Integration of IPython pdb
Stars: ✭ 1,373 (+1330.21%)
Mutual labels:  ipython, debugger
nopdb
NoPdb: Non-interactive Python Debugger
Stars: ✭ 67 (-30.21%)
Mutual labels:  debugger, pdb
hilda
LLDB wrapped and empowered by iPython's features
Stars: ✭ 99 (+3.13%)
Mutual labels:  debugger, ipython
Pytest Pudb
Pytest PuDB debugger integration
Stars: ✭ 45 (-53.12%)
Mutual labels:  debugger, pdb
ircpdb
Remotely and collaboratively debug your Python application via an IRC channel.
Stars: ✭ 59 (-38.54%)
Mutual labels:  debugger, pdb
docker-pudb
Debug Python code within a Docker container remotely from your terminal using pudb
Stars: ✭ 18 (-81.25%)
Mutual labels:  debugger, pdb
Pdbpp
pdb++, a drop-in replacement for pdb (the Python debugger)
Stars: ✭ 693 (+621.88%)
Mutual labels:  debugger, pdb
Pdb Tutorial
A simple tutorial about effectively using pdb
Stars: ✭ 720 (+650%)
Mutual labels:  debugger, pdb
Web develop
《Python Web开发实战》书中源码
Stars: ✭ 1,146 (+1093.75%)
Mutual labels:  ipython, celery
Pragmaticai
[Book-2019] Pragmatic AI: An Introduction to Cloud-based Machine Learning
Stars: ✭ 79 (-17.71%)
Mutual labels:  ipython
Flask Log Request Id
Flask extension to track and log Request-ID headers produced by PaaS like Heroku and load balancers like Amazon ELB
Stars: ✭ 81 (-15.62%)
Mutual labels:  celery
Windows Kernel Explorer
A free but powerful Windows kernel research tool.
Stars: ✭ 1,299 (+1253.13%)
Mutual labels:  debugger
Write A Strace And Gdb
A tiny system call tracer and debugger implementation
Stars: ✭ 93 (-3.12%)
Mutual labels:  debugger
Q
Quick and dirty debugging output for tired Go programmers
Stars: ✭ 1,220 (+1170.83%)
Mutual labels:  debugger
Incepiton Mysql
🍭A web platform designed for mysql inception
Stars: ✭ 90 (-6.25%)
Mutual labels:  celery
Rubyx
RubyX compiles ruby to binary (in ruby), hoping to be that X times faster
Stars: ✭ 78 (-18.75%)
Mutual labels:  debugger
Oauth2 Oidc Debugger
An OAuth2 and OpenID Connect Debugger
Stars: ✭ 78 (-18.75%)
Mutual labels:  debugger
Show ast
An IPython notebook plugin for visualizing ASTs.
Stars: ✭ 76 (-20.83%)
Mutual labels:  ipython
Spark Py Notebooks
Apache Spark & Python (pySpark) tutorials for Big Data Analysis and Machine Learning as IPython / Jupyter notebooks
Stars: ✭ 1,338 (+1293.75%)
Mutual labels:  ipython

pdbr

PyPI version Python Version

pdbr is intended to make the PDB results more colorful. it uses Rich library to carry out that.

Installing

Install with pip or your favorite PyPi package manager.

pip install pdbr

Breakpoint

In order to use breakpoint(), set PYTHONBREAKPOINT with "pdbr.set_trace"

import os

os.environ["PYTHONBREAKPOINT"] = "pdbr.set_trace"

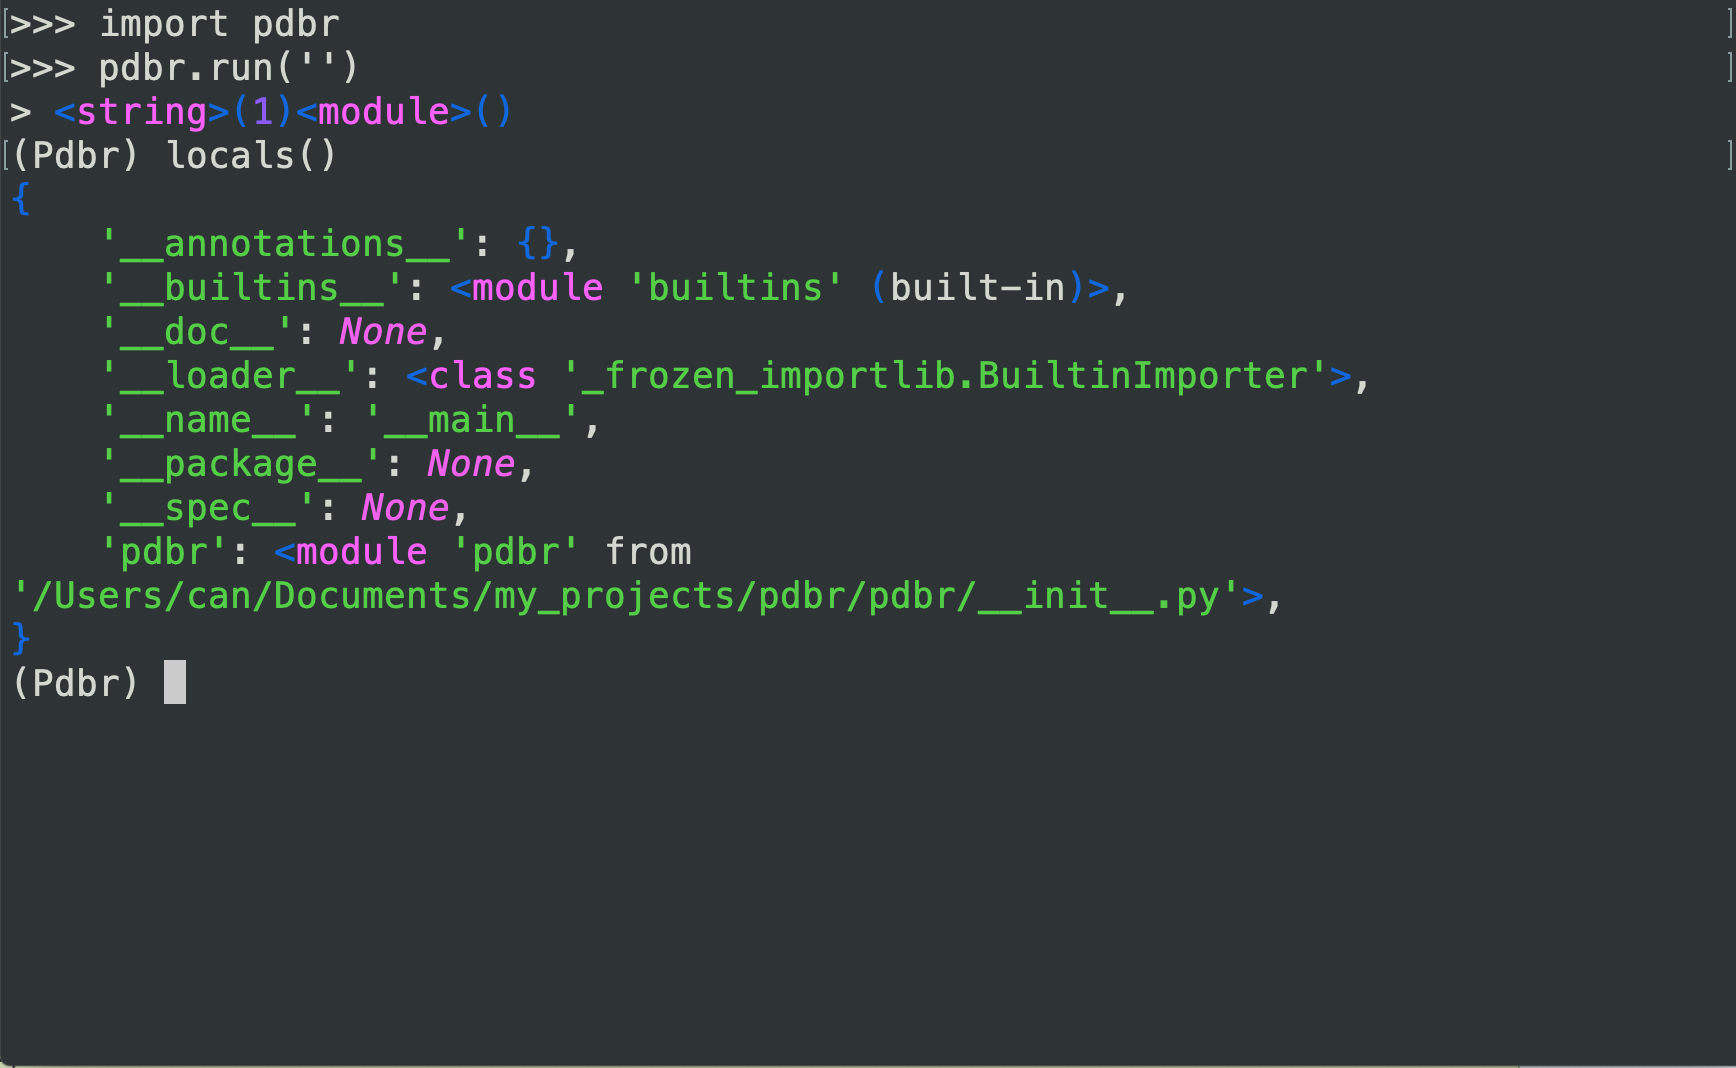
or just import pdbr

import pdbr

New commands

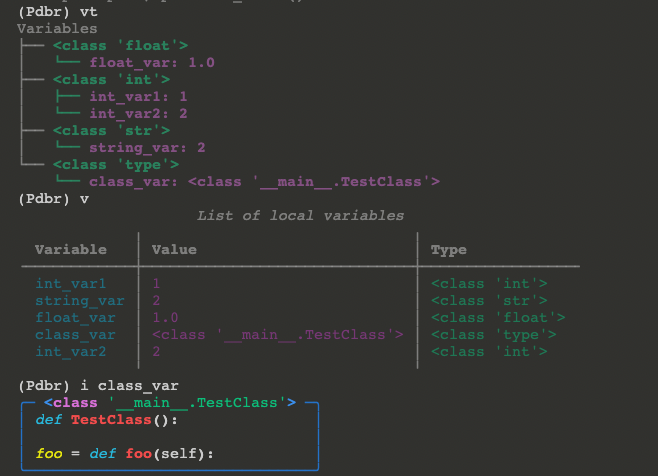
(v)ars

Get the local variables list as table.

varstree | vt

Get the local variables list as tree.

(i)nspect / inspectall | ia

rich.inspect

pp

rich.pretty.pprint

(ic)ecream

🍦 Icecream print.

nn, ss, uu, dd

Same with n(ext), s(tep), u(p), d(own) commands + with local variables.

Config

Style

In order to use Rich's traceback, style, and theme, set setup.cfg.

[pdbr]
style = yellow
use_traceback = True
theme = friendly

History

store_history setting is used to keep and reload history, even the prompt is closed and opened again.

[pdbr]
...
store_history=.pdbr_history

Celery

In order to use Celery remote debugger with pdbr, use celery_set_trace as below sample. For more information see the Celery user guide.

from celery import Celery

app = Celery('tasks', broker='pyamqp://[email protected]//')

@app.task
def add(x, y):
    
    import pdbr; pdbr.celery_set_trace()
    
    return x + y

Telnet

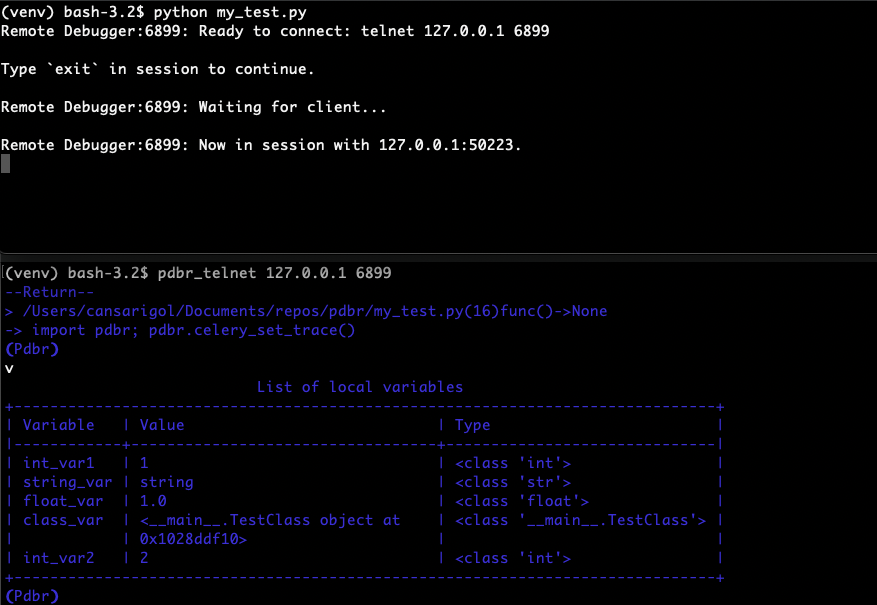
Instead of using telnet or nc, in terms of using pdbr style, pdbr_telnet command can be used.
IPython

Being able to use ipython, install pdbr with it like below or just install your own version.

pip install pdbr[ipython]

Shell

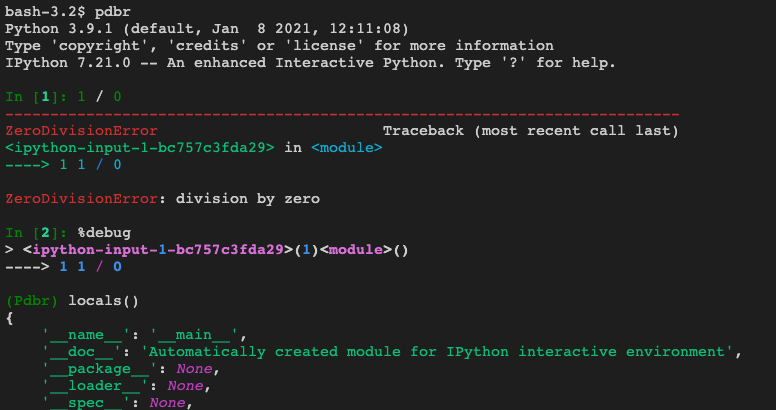
Running pdbr command in terminal starts an IPython terminal app instance. Unlike default TerminalInteractiveShell, the new shell uses pdbr as debugger class instead of ipdb.

%debug magic sample

Terminal

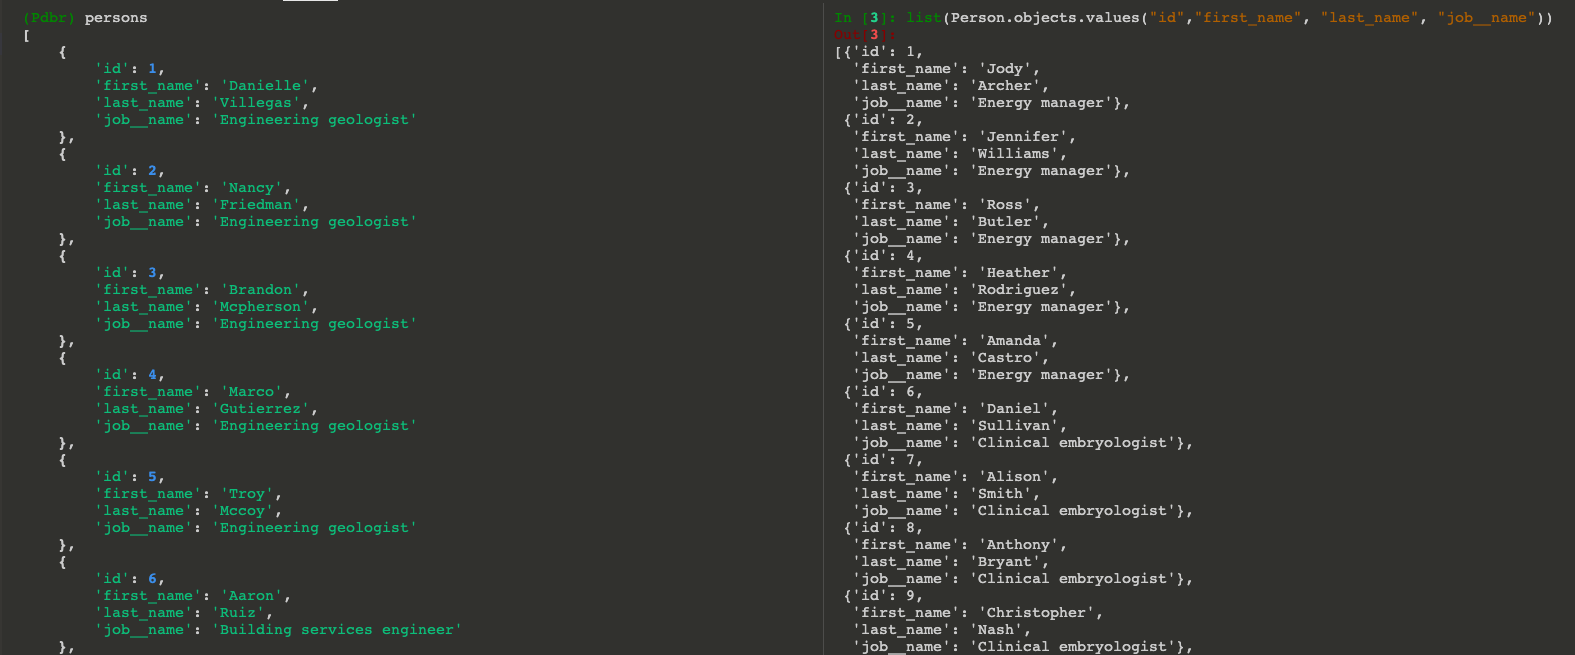
Django shell sample

Vscode user snippet

To create or edit your own snippets, select User Snippets under File > Preferences (Code > Preferences on macOS), and then select python.json.

Place the below snippet in json file for pdbr.

{
  ...
  "pdbr": {
        "prefix": "pdbr",
        "body": "import pdbr; pdbr.set_trace()",
        "description": "Code snippet for pdbr debug"
    },
}

For Celery debug.

{
  ...
  "rdbr": {
        "prefix": "rdbr",
        "body": "import pdbr; pdbr.celery_set_trace()",
        "description": "Code snippet for Celery pdbr debug"
    },
}

Samples

Traceback

Note that the project description data, including the texts, logos, images, and/or trademarks, for each open source project belongs to its rightful owner. If you wish to add or remove any projects, please contact us at [email protected].