All Projects → pyecharts → Pyecharts

pyecharts / Pyecharts

Licence: mit
🎨 Python Echarts Plotting Library

Programming Languages

python
139335 projects - #7 most used programming language
HTML
75241 projects

Labels

Projects that are alternatives of or similar to Pyecharts

Deep Viz
A React component library, providing concise and beautiful diversity charts with Canvas, SVG, E-map, WebGL, Dom, based on data visualization experience and commercial data display practice.
Stars: ✭ 55 (-99.53%)
Mutual labels:  echarts
Funds
自选基金助手是一款Chrome扩展,用来快速获取关注基金的实时数据,查看自选基金的实时估值情况
Stars: ✭ 1,367 (-88.42%)
Mutual labels:  echarts
Patentcrawler
scrapy专利爬虫(停止维护)
Stars: ✭ 114 (-99.03%)
Mutual labels:  echarts
Imap
🌏 Travel map generation tool based on Electron and Vue.js
Stars: ✭ 74 (-99.37%)
Mutual labels:  echarts
Scm Biz Suite
供应链中台系统基础版,集成零售管理, 电子商务, 供应链管理, 财务管理, 车队管理, 仓库管理, 人员管理, 产品管理, 订单管理, 会员管理, 连锁店管理, 加盟管理, 前端React/Ant Design, 后端Java Spring+自有开源框架,全面支持MySQL, PostgreSQL, 全面支持国产数据库南大通用GBase 8s,通过REST接口调用,前后端完全分离。
Stars: ✭ 1,310 (-88.9%)
Mutual labels:  echarts
Echarts Map Tool
Map Tool for Apache ECharts
Stars: ✭ 106 (-99.1%)
Mutual labels:  echarts
React Echarts V3
React.js(v16.x+) component wrap for ECharts.js(v3.x+)
Stars: ✭ 48 (-99.59%)
Mutual labels:  echarts
Hotel Management System
宾馆管理系统。可以订房、续费、退房、订单管理、员工管理以及业务数据统计可视化展示等
Stars: ✭ 126 (-98.93%)
Mutual labels:  echarts
Nutz Onekey
NUTZ一键脚手架
Stars: ✭ 92 (-99.22%)
Mutual labels:  echarts
Krisk
Statistical Interactive Visualization with pandas+Jupyter integration on top of Echarts.
Stars: ✭ 111 (-99.06%)
Mutual labels:  echarts
J2ee Advanced
Java Web进阶学习的一些源码加详细讲解(Java Web advanced learning with some source code and detailed explanation)
Stars: ✭ 81 (-99.31%)
Mutual labels:  echarts
Webclient Javascript
MapGIS Client for JavaScript, is a cloud GIS network client development platform. It makes a perfect fusion of traditional WebGIS and cloud GIS; also integrates four mainstream map open source frameworks and visualization libraries such as Echarts, MapV, and D3, etc.. Therefore, highly-efficient visual expression and analysis of big data and real-time streaming data have been further enhanced.
Stars: ✭ 88 (-99.25%)
Mutual labels:  echarts
Echarts
Apache ECharts is a powerful, interactive charting and data visualization library for browser
Stars: ✭ 49,119 (+316.12%)
Mutual labels:  echarts
Vue Admin
基于Vue2、element ui、vue-cli、vuex、vue-router、axios 、echarts后台管理系统demo. 权限管理,用户管理,菜单管理。无限级菜单,下拉树形选择框
Stars: ✭ 1,135 (-90.38%)
Mutual labels:  echarts
Vue Expenses
A simple expense tracking application
Stars: ✭ 117 (-99.01%)
Mutual labels:  echarts
Vue Data Board
A Data Analysis Board in Vue.
Stars: ✭ 1,046 (-91.14%)
Mutual labels:  echarts
Seppf
普兰能效平台开源版(前端)
Stars: ✭ 104 (-99.12%)
Mutual labels:  echarts
Nebulasolardash
Real - time monitoring of distributed server information
Stars: ✭ 134 (-98.86%)
Mutual labels:  echarts
Datavisualization
😈 by vue2.x with echarts3.3.2
Stars: ✭ 1,641 (-86.1%)
Mutual labels:  echarts
Ng Deerway
鹿途后台管理系统
Stars: ✭ 108 (-99.09%)
Mutual labels:  echarts

pyecharts logo

pyecharts

Python ❤️ ECharts = pyecharts

Github Actions Status Codecov Package version PyPI - Python Version

PyPI - Format Contributions welcome License

English README

📣 简介

Apache ECharts 是一个由百度开源的数据可视化,凭借着良好的交互性,精巧的图表设计,得到了众多开发者的认可。而 Python 是一门富有表达力的语言,很适合用于数据处理。当数据分析遇上数据可视化时,pyecharts 诞生了。

特性

  • 简洁的 API 设计,使用如丝滑般流畅,支持链式调用
  • 囊括了 30+ 种常见图表,应有尽有
  • 支持主流 Notebook 环境,Jupyter Notebook 和 JupyterLab
  • 可轻松集成至 Flask,Sanic,Django 等主流 Web 框架
  • 高度灵活的配置项,可轻松搭配出精美的图表
  • 详细的文档和示例,帮助开发者更快的上手项目
  • 多达 400+ 地图文件,并且支持原生百度地图,为地理数据可视化提供强有力的支持

版本

v0.5.x 和 V1 间不兼容,V1 是一个全新的版本,详见 ISSUE#892ISSUE#1033

V0.5.x

支持 Python2.7,3.4+

经开发团队决定,0.5.x 版本将不再进行维护,0.5.x 版本代码位于 05x 分支,文档位于 05x-docs.pyecharts.org

V1

仅支持 Python3.6+

新版本系列将从 v1.0.0 开始,文档位于 pyecharts.org;示例位于 gallery.pyecharts.org

🔰 安装

pip 安装

# 安装 v1 以上版本
$ pip install pyecharts -U

# 如果需要安装 0.5.11 版本的开发者,可以使用
# pip install pyecharts==0.5.11

源码安装

# 安装 v1 以上版本
$ git clone https://github.com/pyecharts/pyecharts.git
# 如果需要安装 0.5.11 版本,请使用 git clone https://github.com/pyecharts/pyecharts.git -b v05x
$ cd pyecharts
$ pip install -r requirements.txt
$ python setup.py install

📝 使用

本地环境

生成 HTML

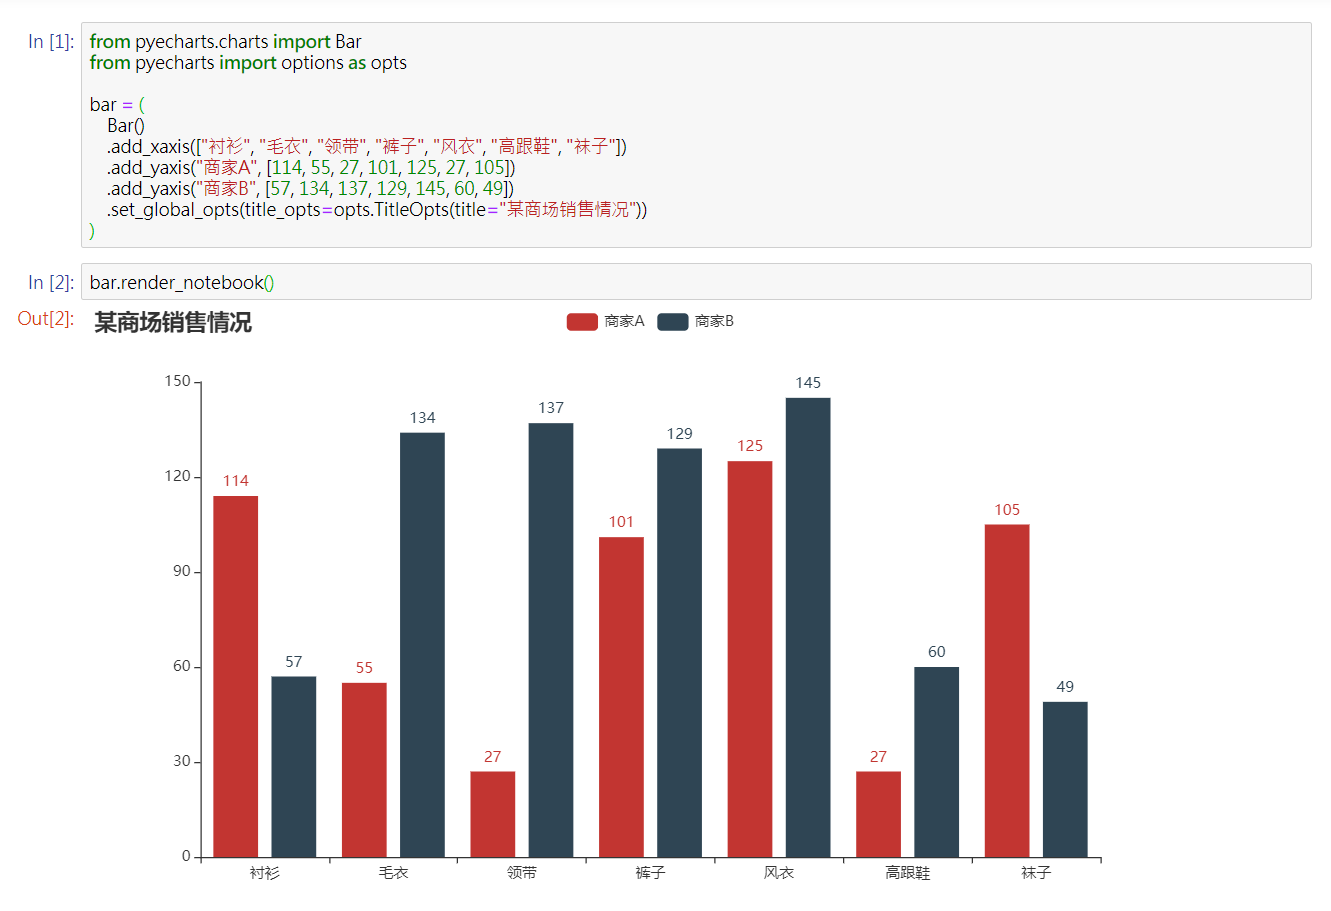
from pyecharts.charts import Bar
from pyecharts import options as opts

# V1 版本开始支持链式调用
bar = (
    Bar()
    .add_xaxis(["衬衫", "毛衣", "领带", "裤子", "风衣", "高跟鞋", "袜子"])
    .add_yaxis("商家A", [114, 55, 27, 101, 125, 27, 105])
    .add_yaxis("商家B", [57, 134, 137, 129, 145, 60, 49])
    .set_global_opts(title_opts=opts.TitleOpts(title="某商场销售情况"))
)
bar.render()

# 不习惯链式调用的开发者依旧可以单独调用方法
bar = Bar()
bar.add_xaxis(["衬衫", "毛衣", "领带", "裤子", "风衣", "高跟鞋", "袜子"])
bar.add_yaxis("商家A", [114, 55, 27, 101, 125, 27, 105])
bar.add_yaxis("商家B", [57, 134, 137, 129, 145, 60, 49])
bar.set_global_opts(title_opts=opts.TitleOpts(title="某商场销售情况"))
bar.render()

生成图片

from snapshot_selenium import snapshot as driver

from pyecharts import options as opts
from pyecharts.charts import Bar
from pyecharts.render import make_snapshot


def bar_chart() -> Bar:
    c = (
        Bar()
        .add_xaxis(["衬衫", "毛衣", "领带", "裤子", "风衣", "高跟鞋", "袜子"])
        .add_yaxis("商家A", [114, 55, 27, 101, 125, 27, 105])
        .add_yaxis("商家B", [57, 134, 137, 129, 145, 60, 49])
        .reversal_axis()
        .set_series_opts(label_opts=opts.LabelOpts(position="right"))
        .set_global_opts(title_opts=opts.TitleOpts(title="Bar-测试渲染图片"))
    )
    return c

# 需要安装 snapshot-selenium 或者 snapshot-phantomjs
make_snapshot(driver, bar_chart().render(), "bar.png")

Notebook 环境

Jupyter Notebook

JupyterLab

Web 框架

🔖 Demo

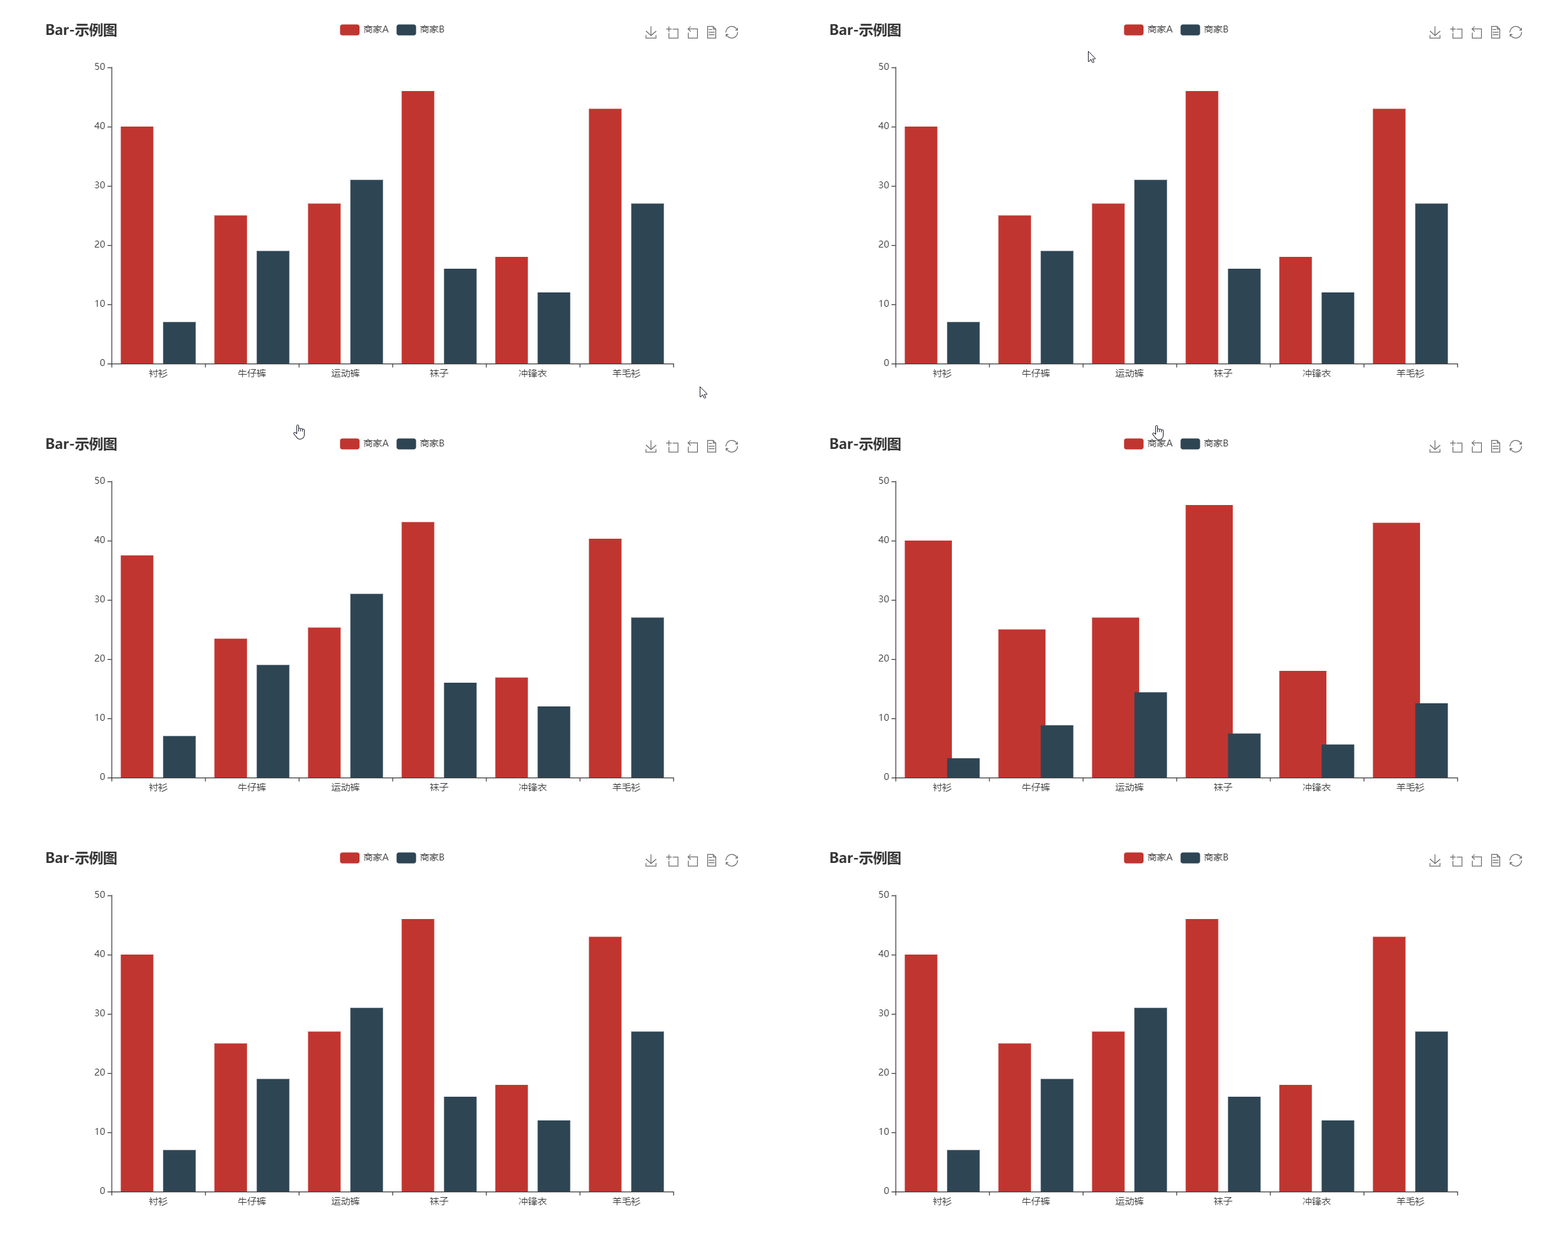
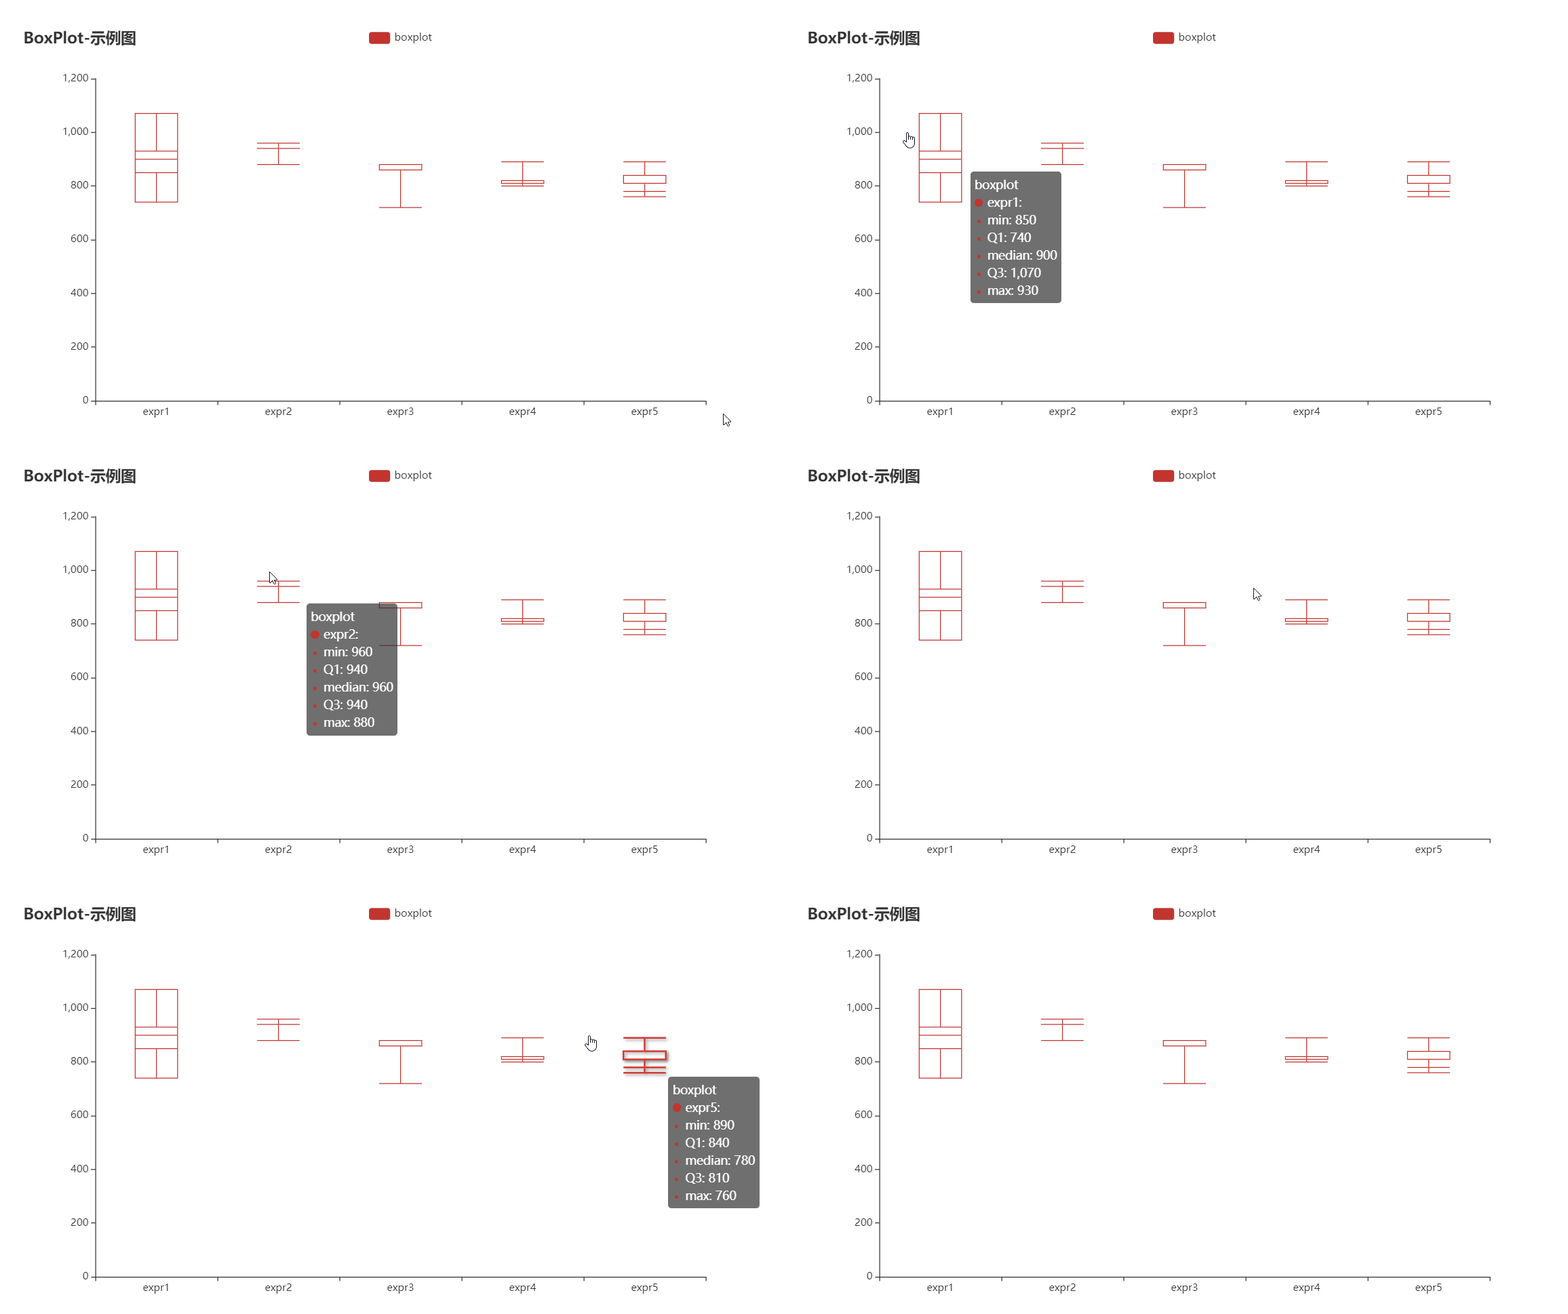
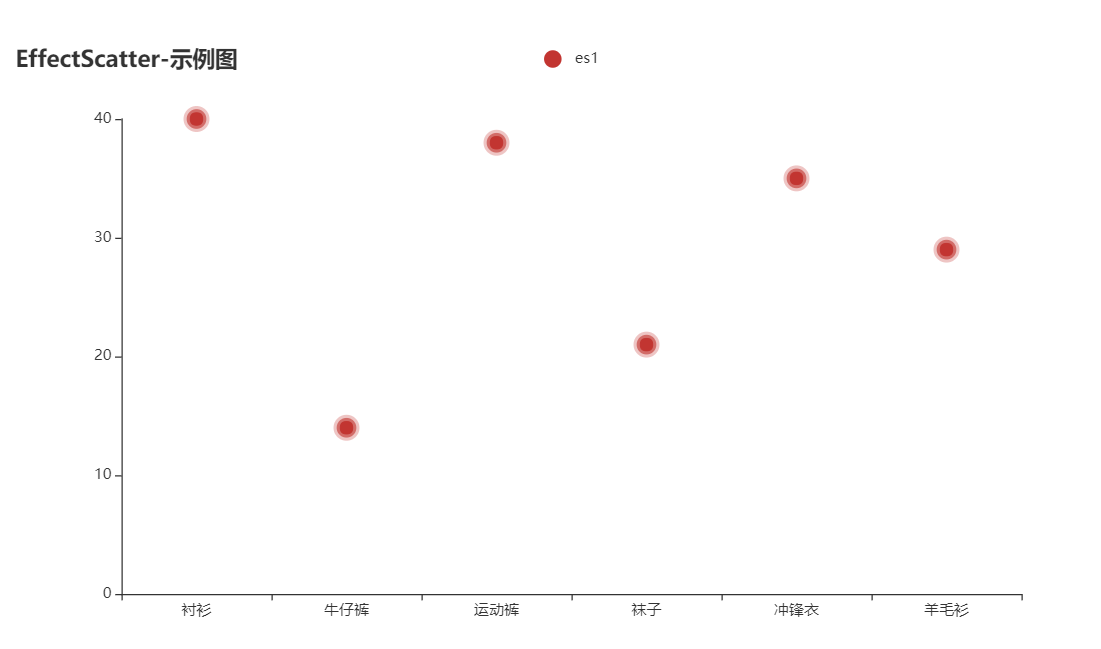
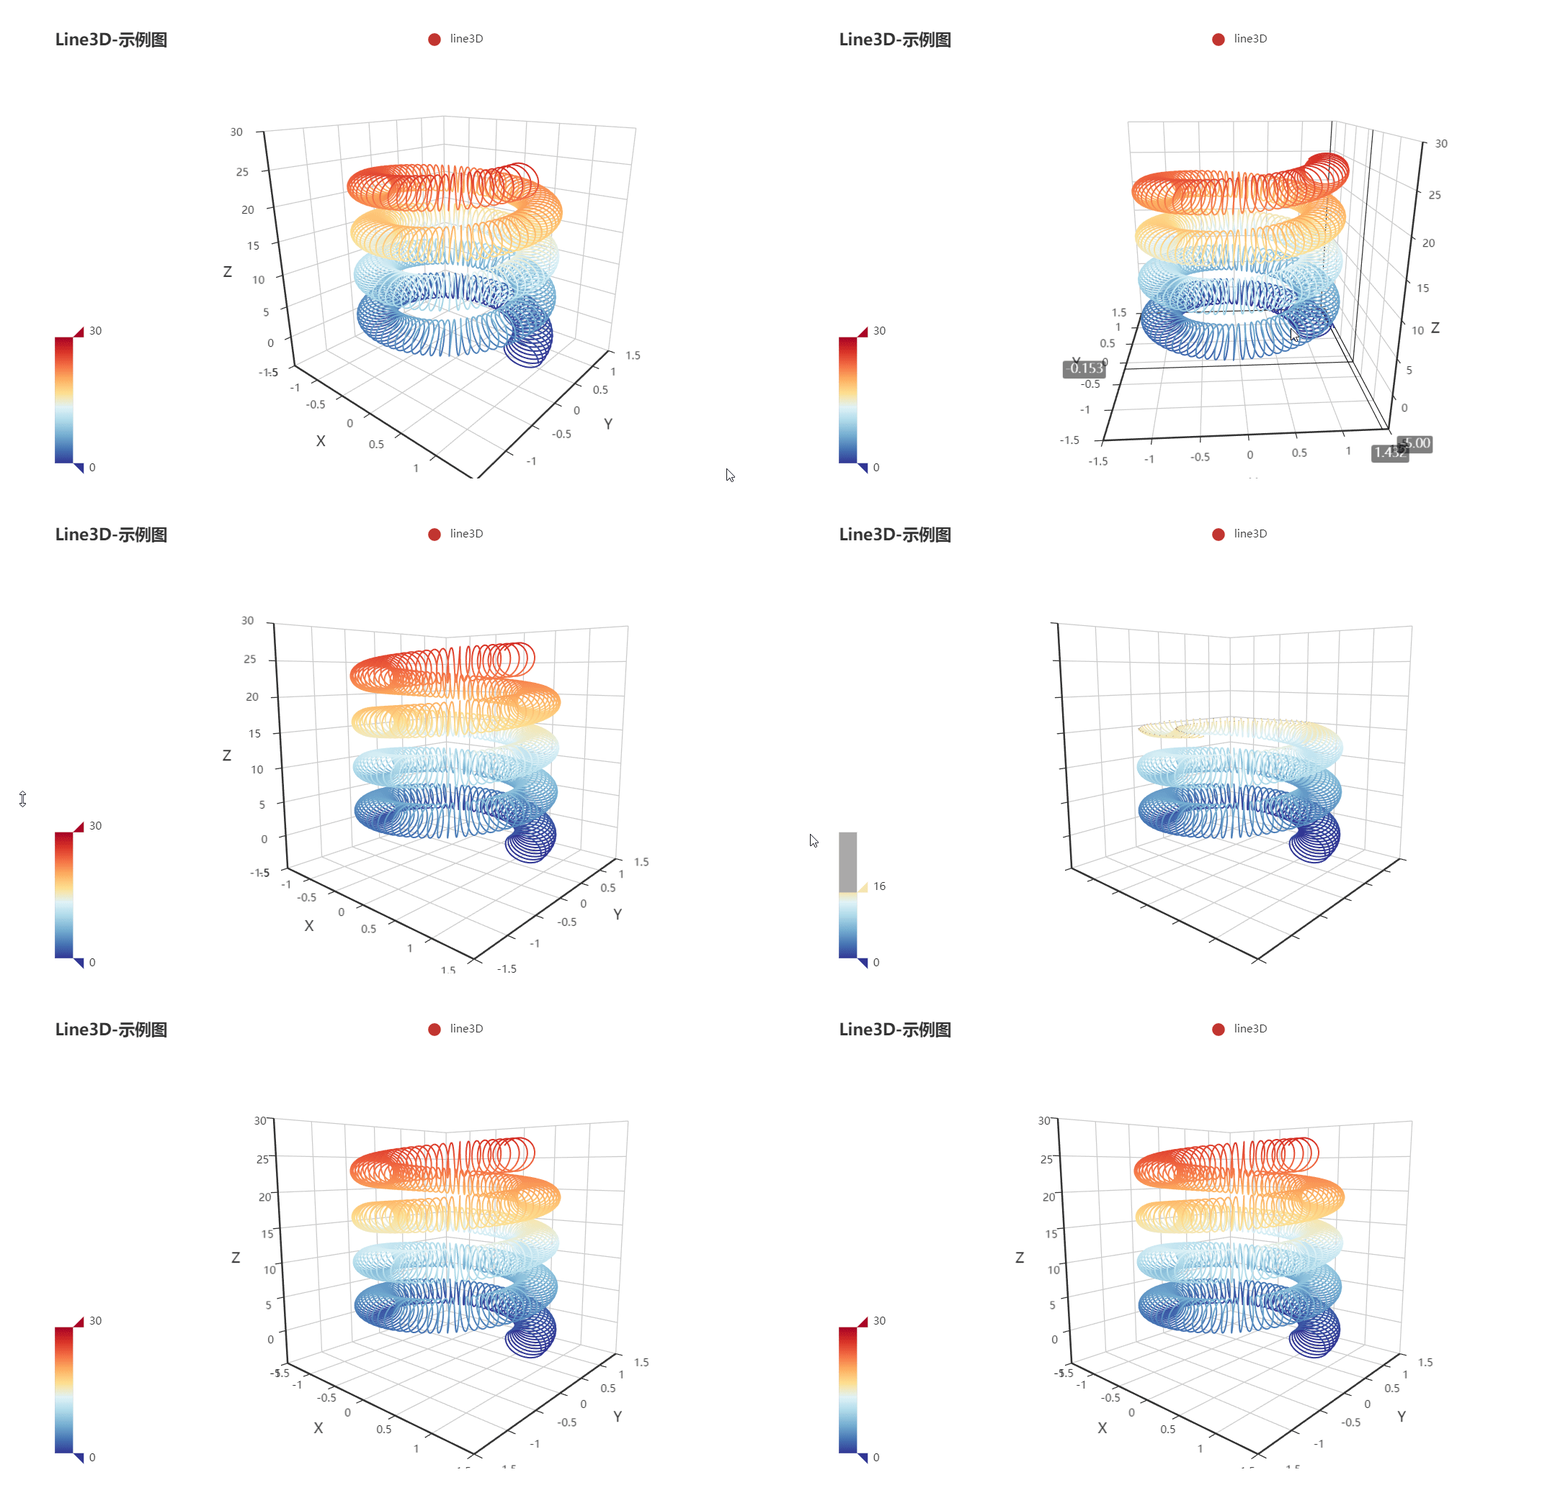
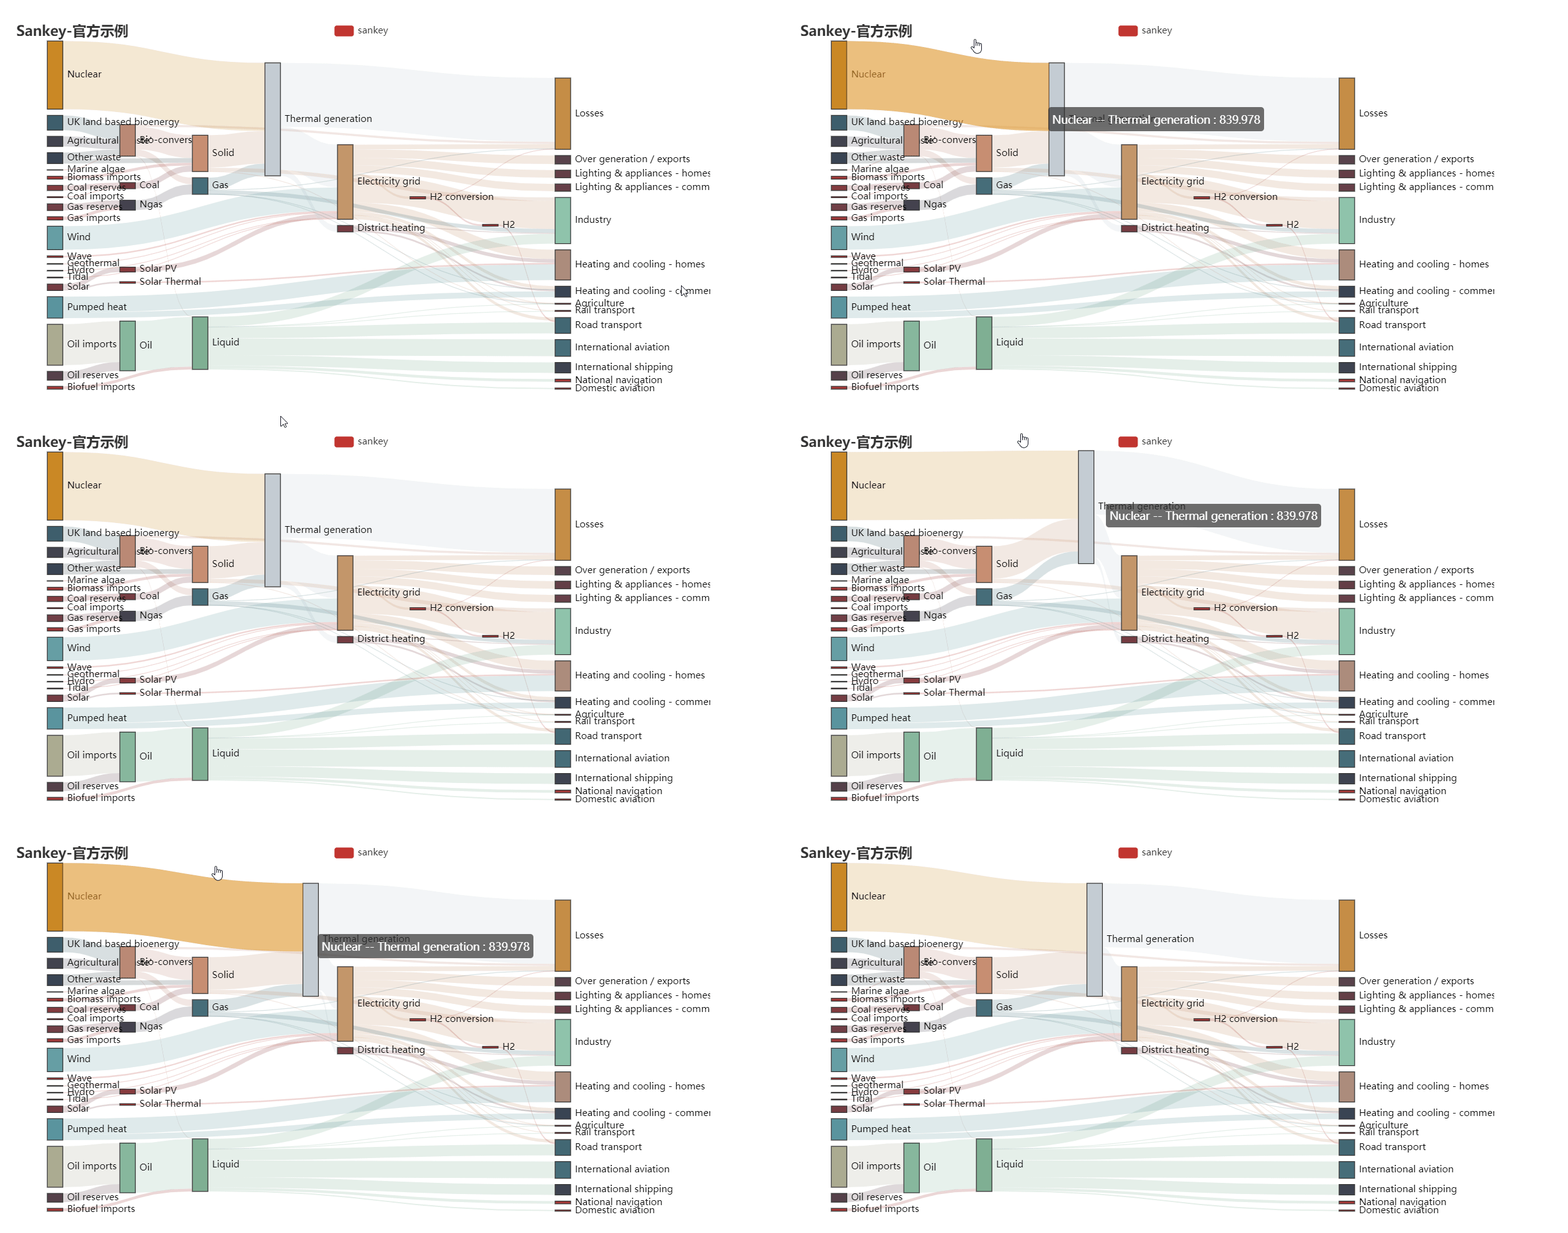
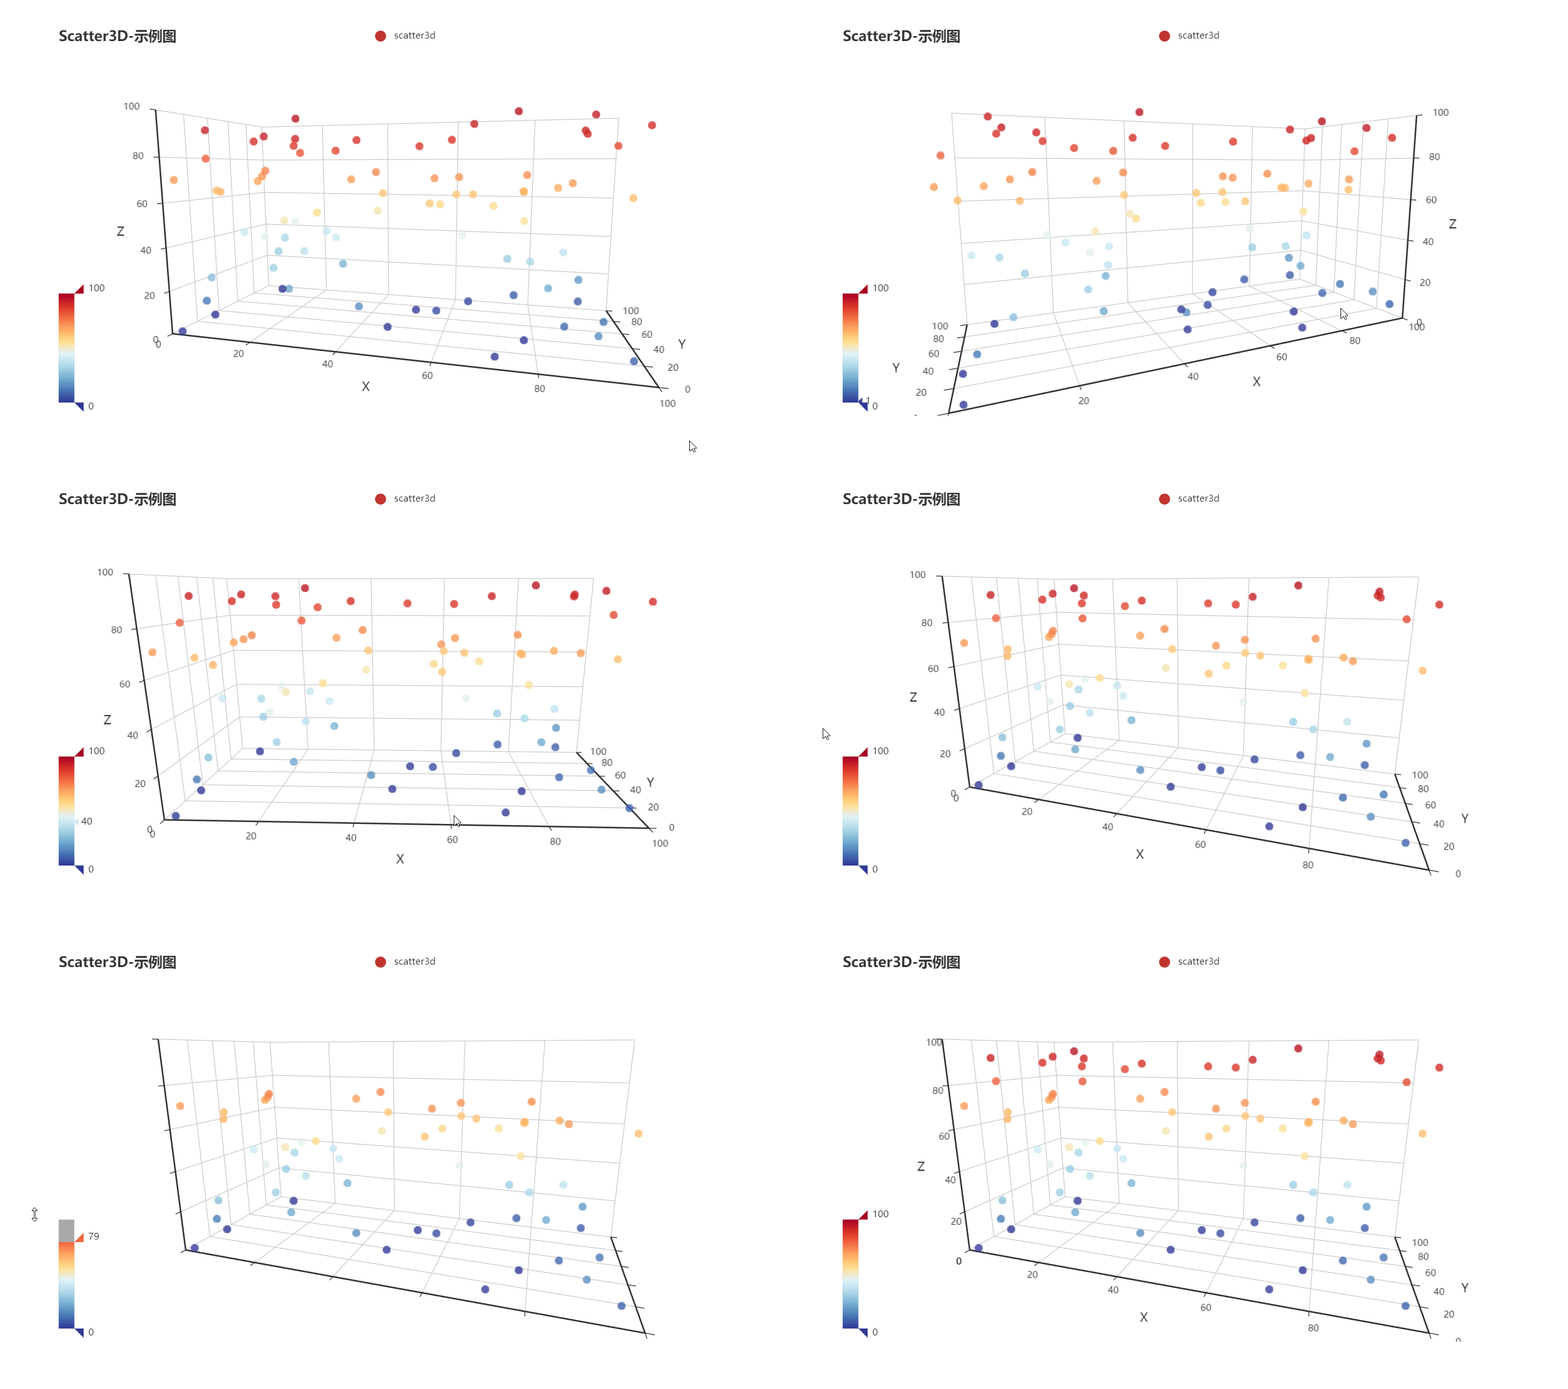
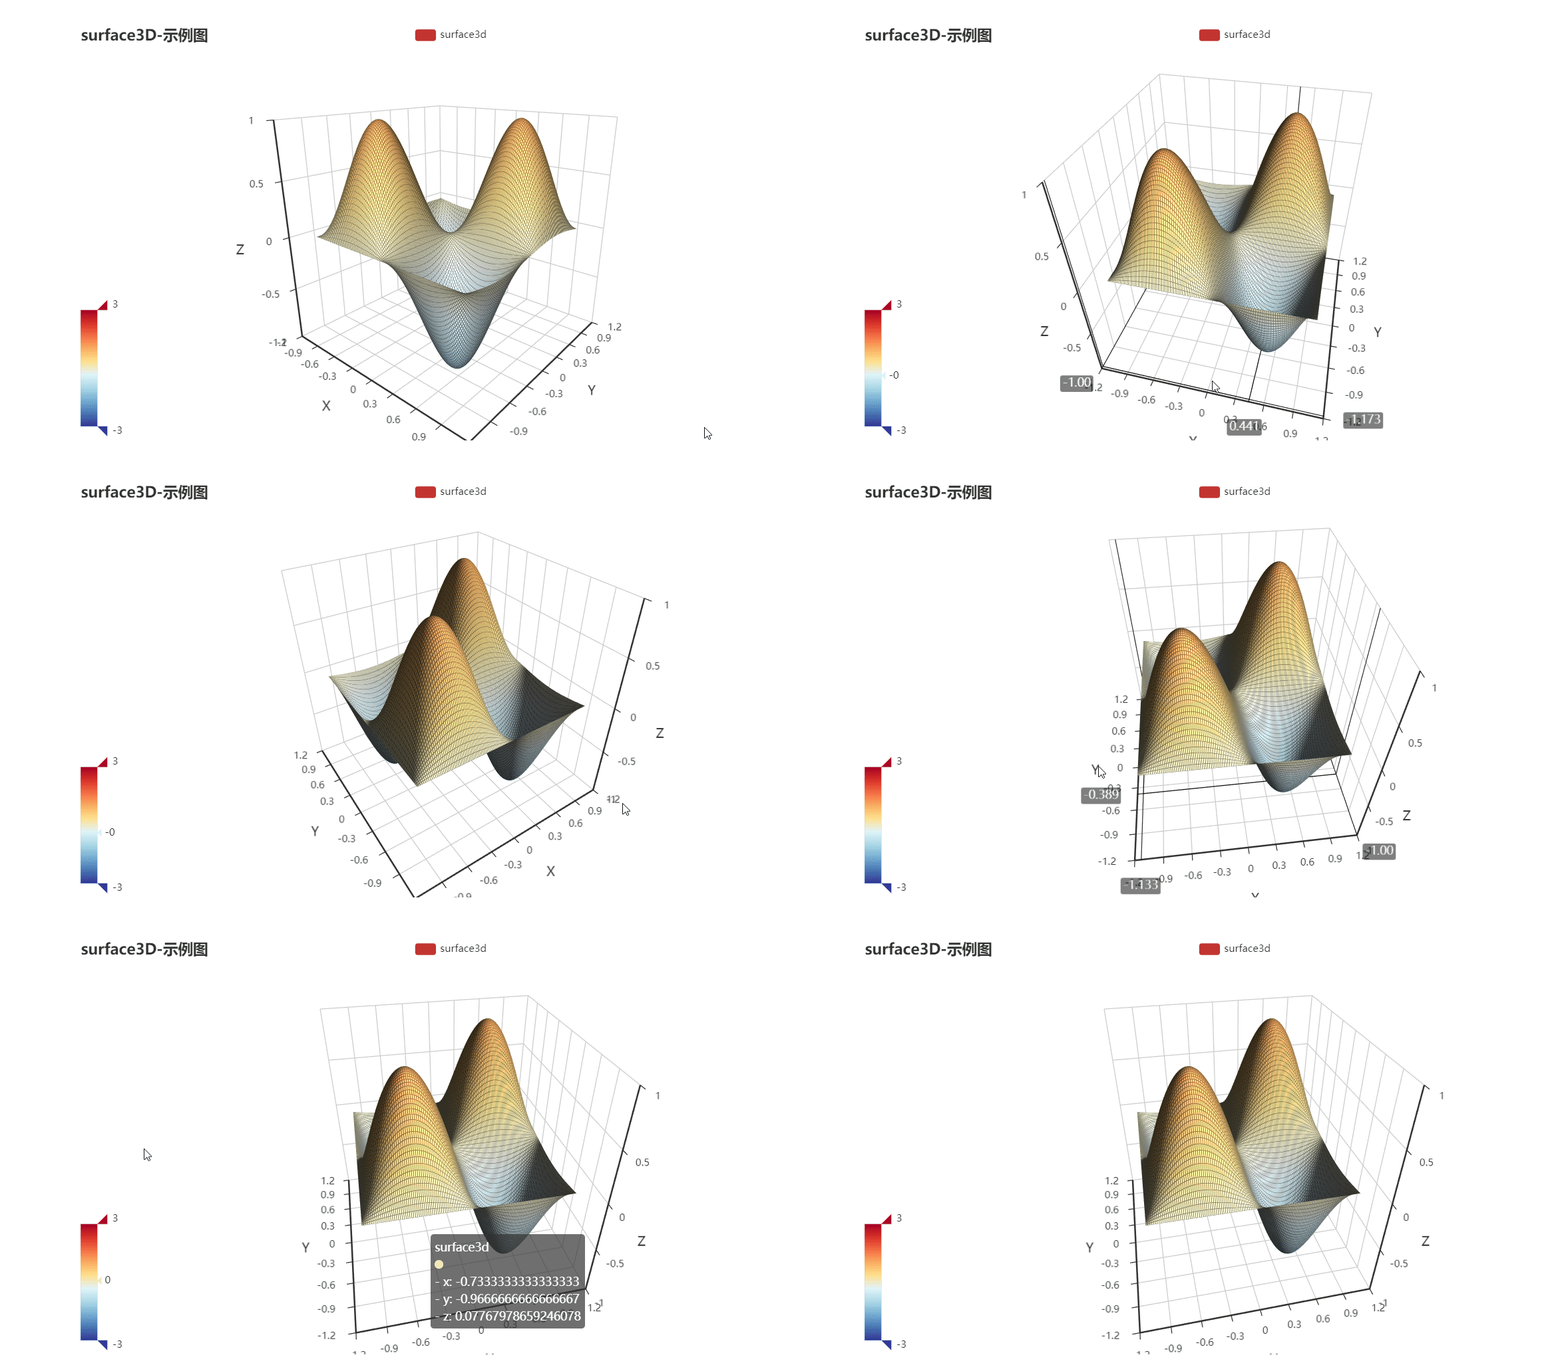
Demo 代码位于 example 文件夹下,欢迎参考 pyecharts 画廊 pyecharts-gallery

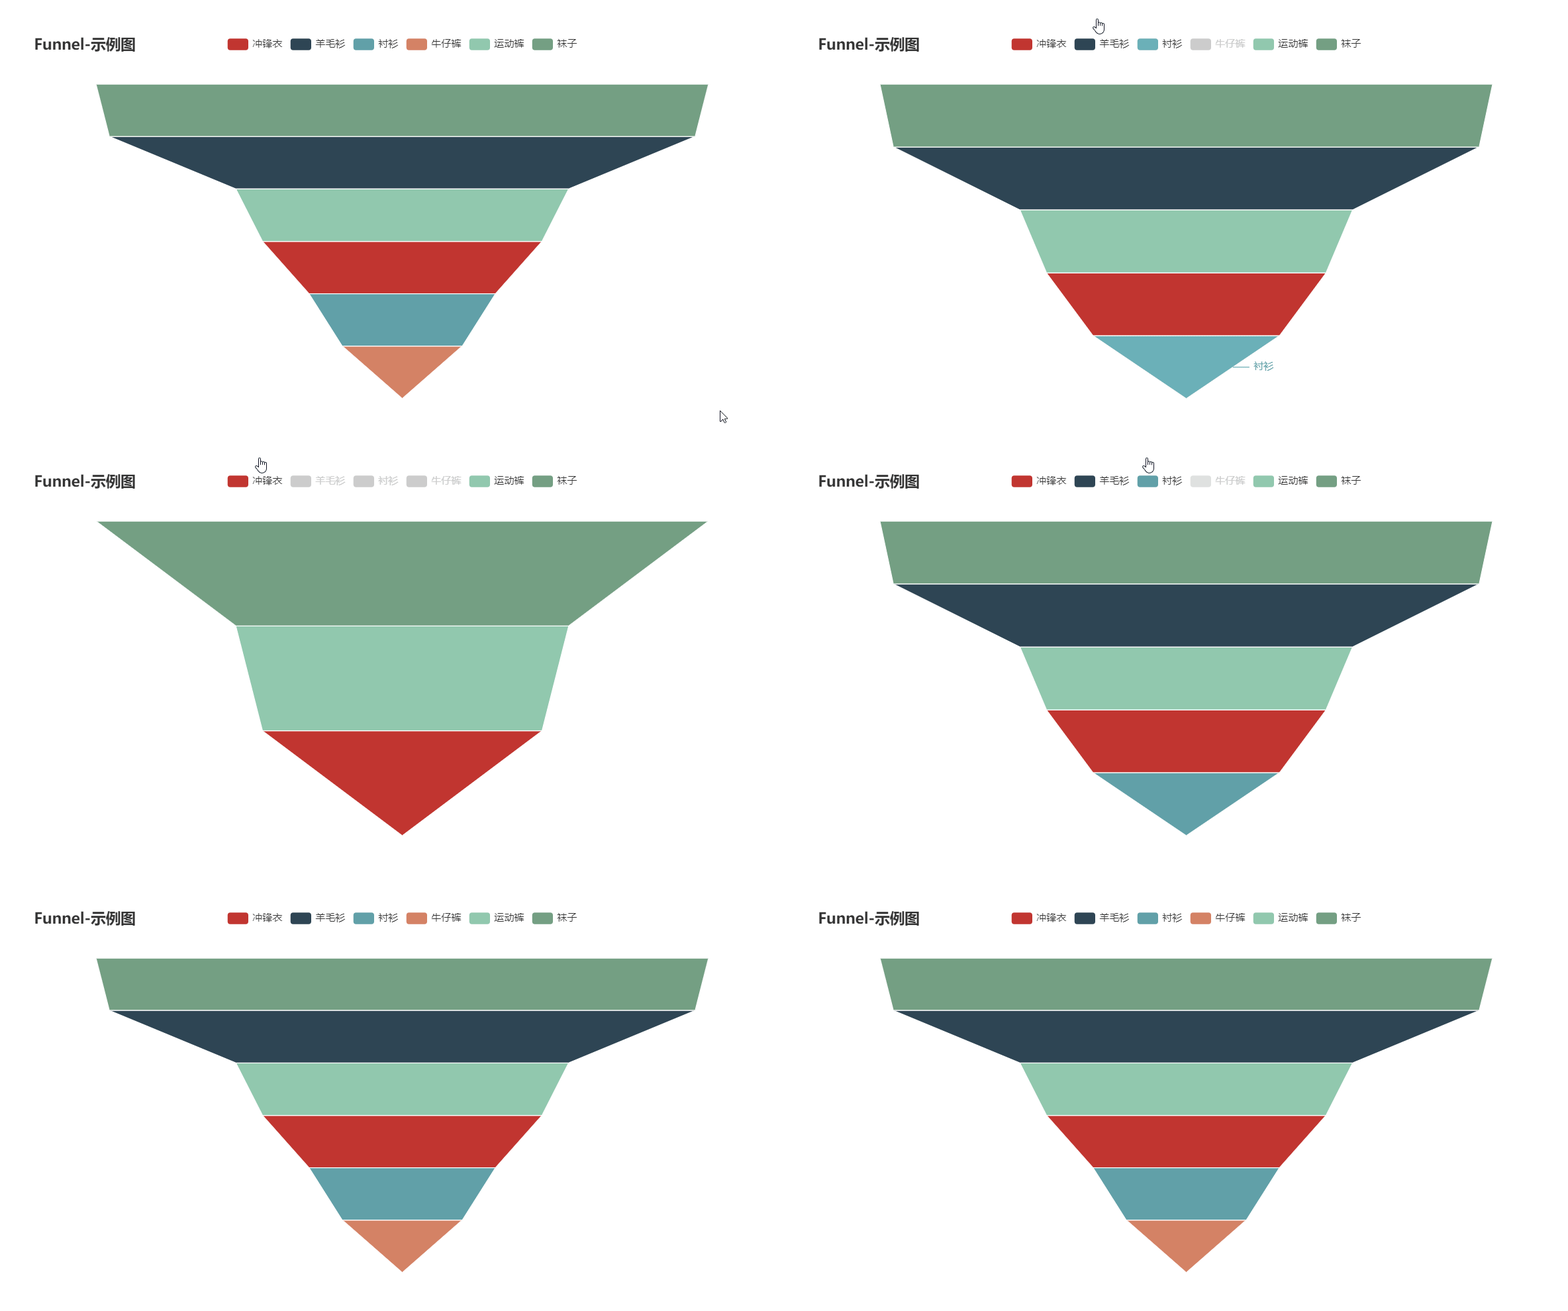
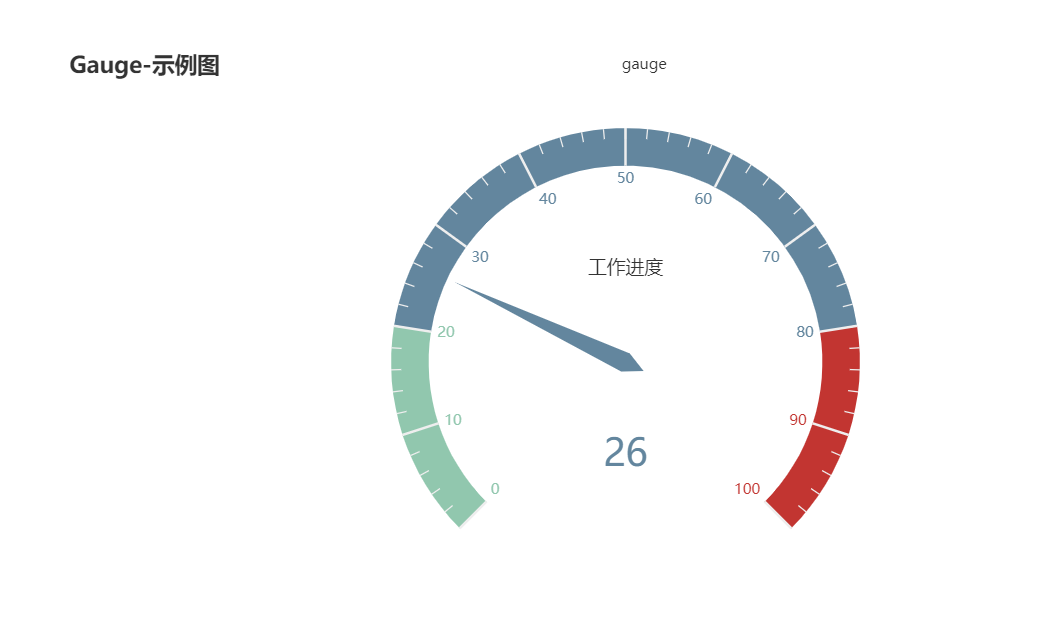
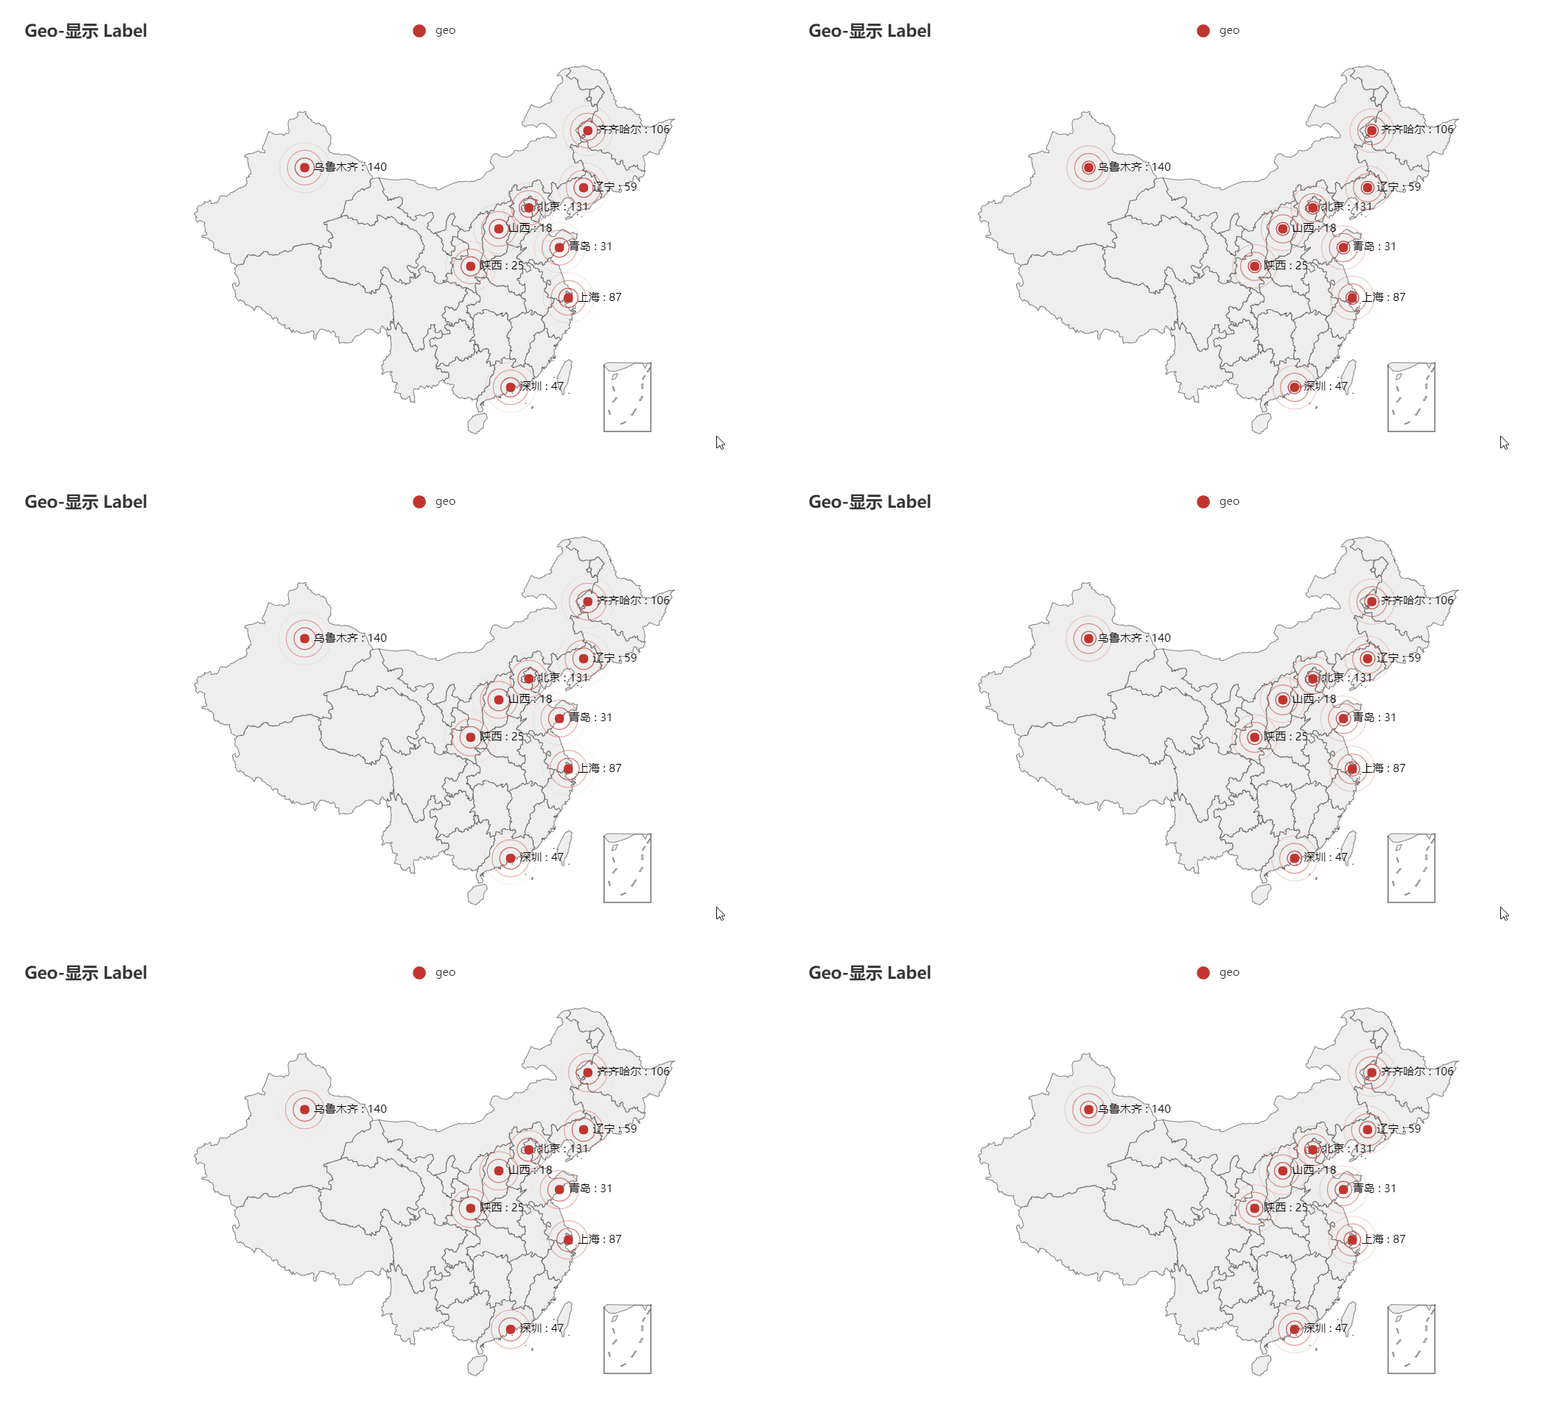
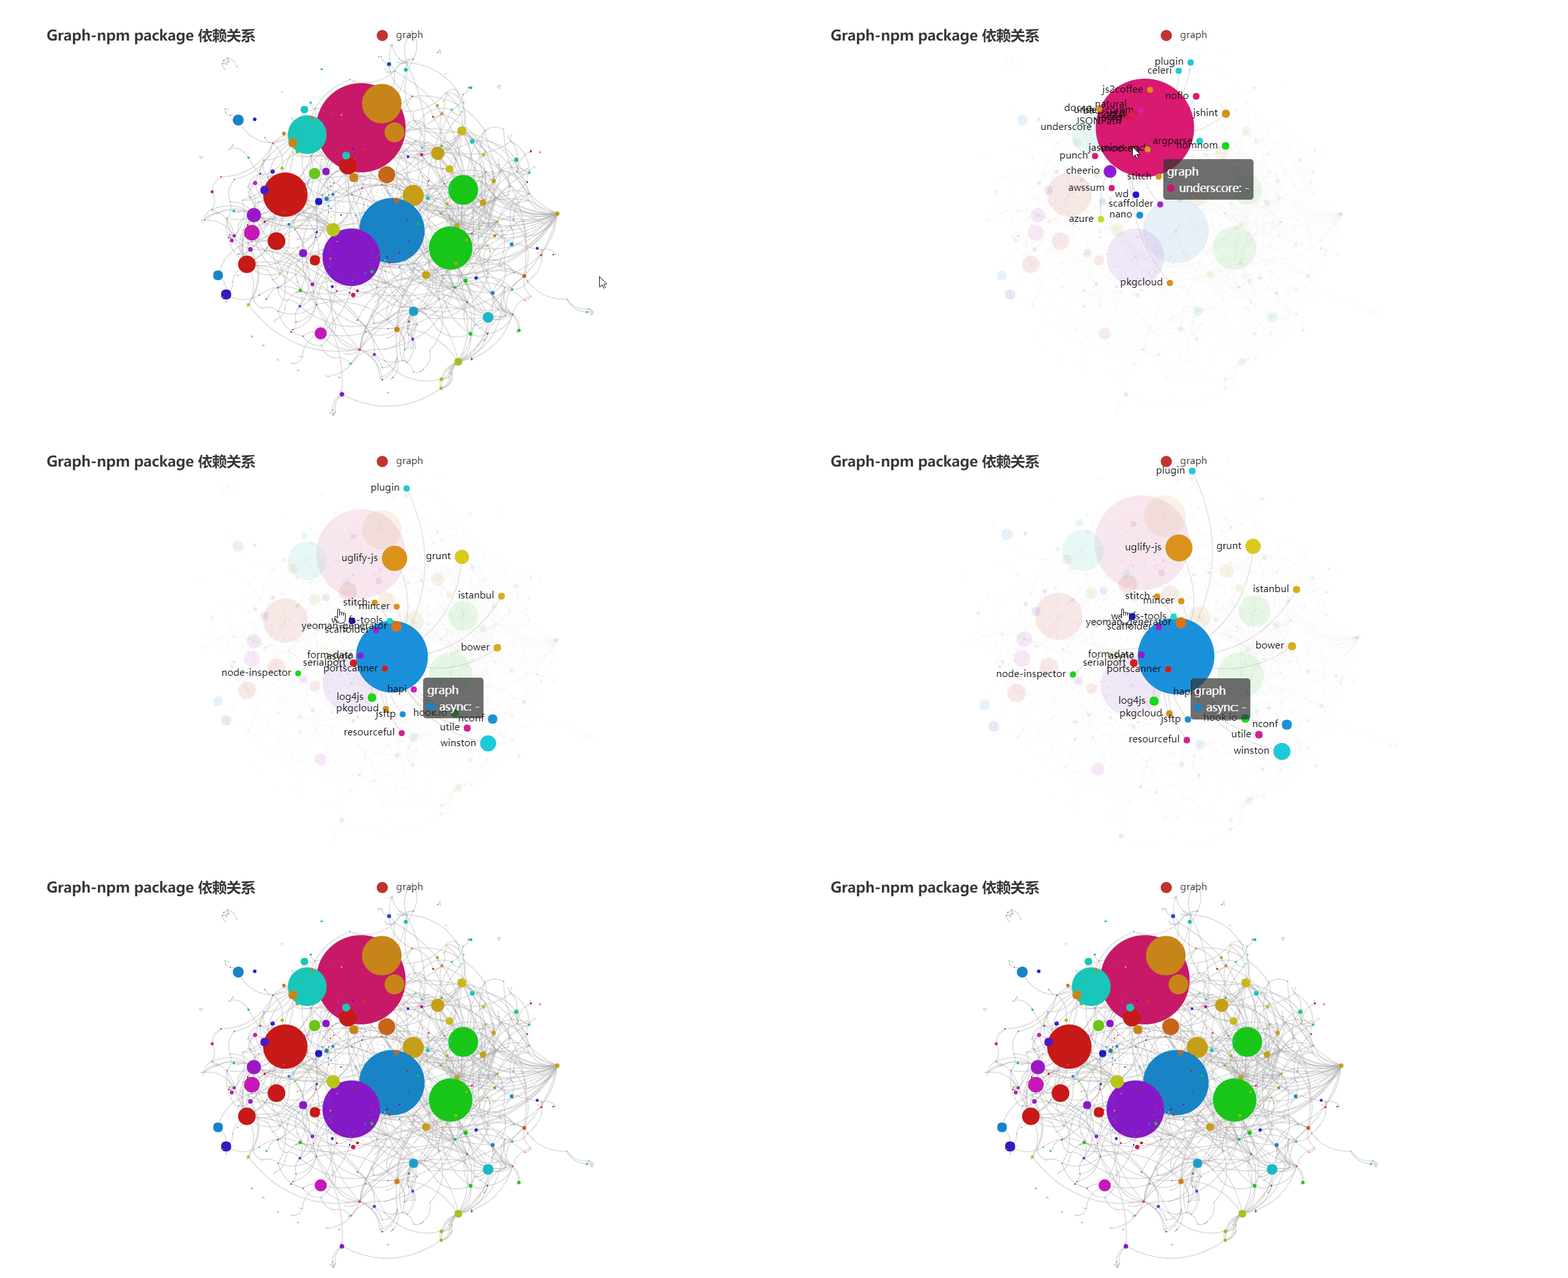
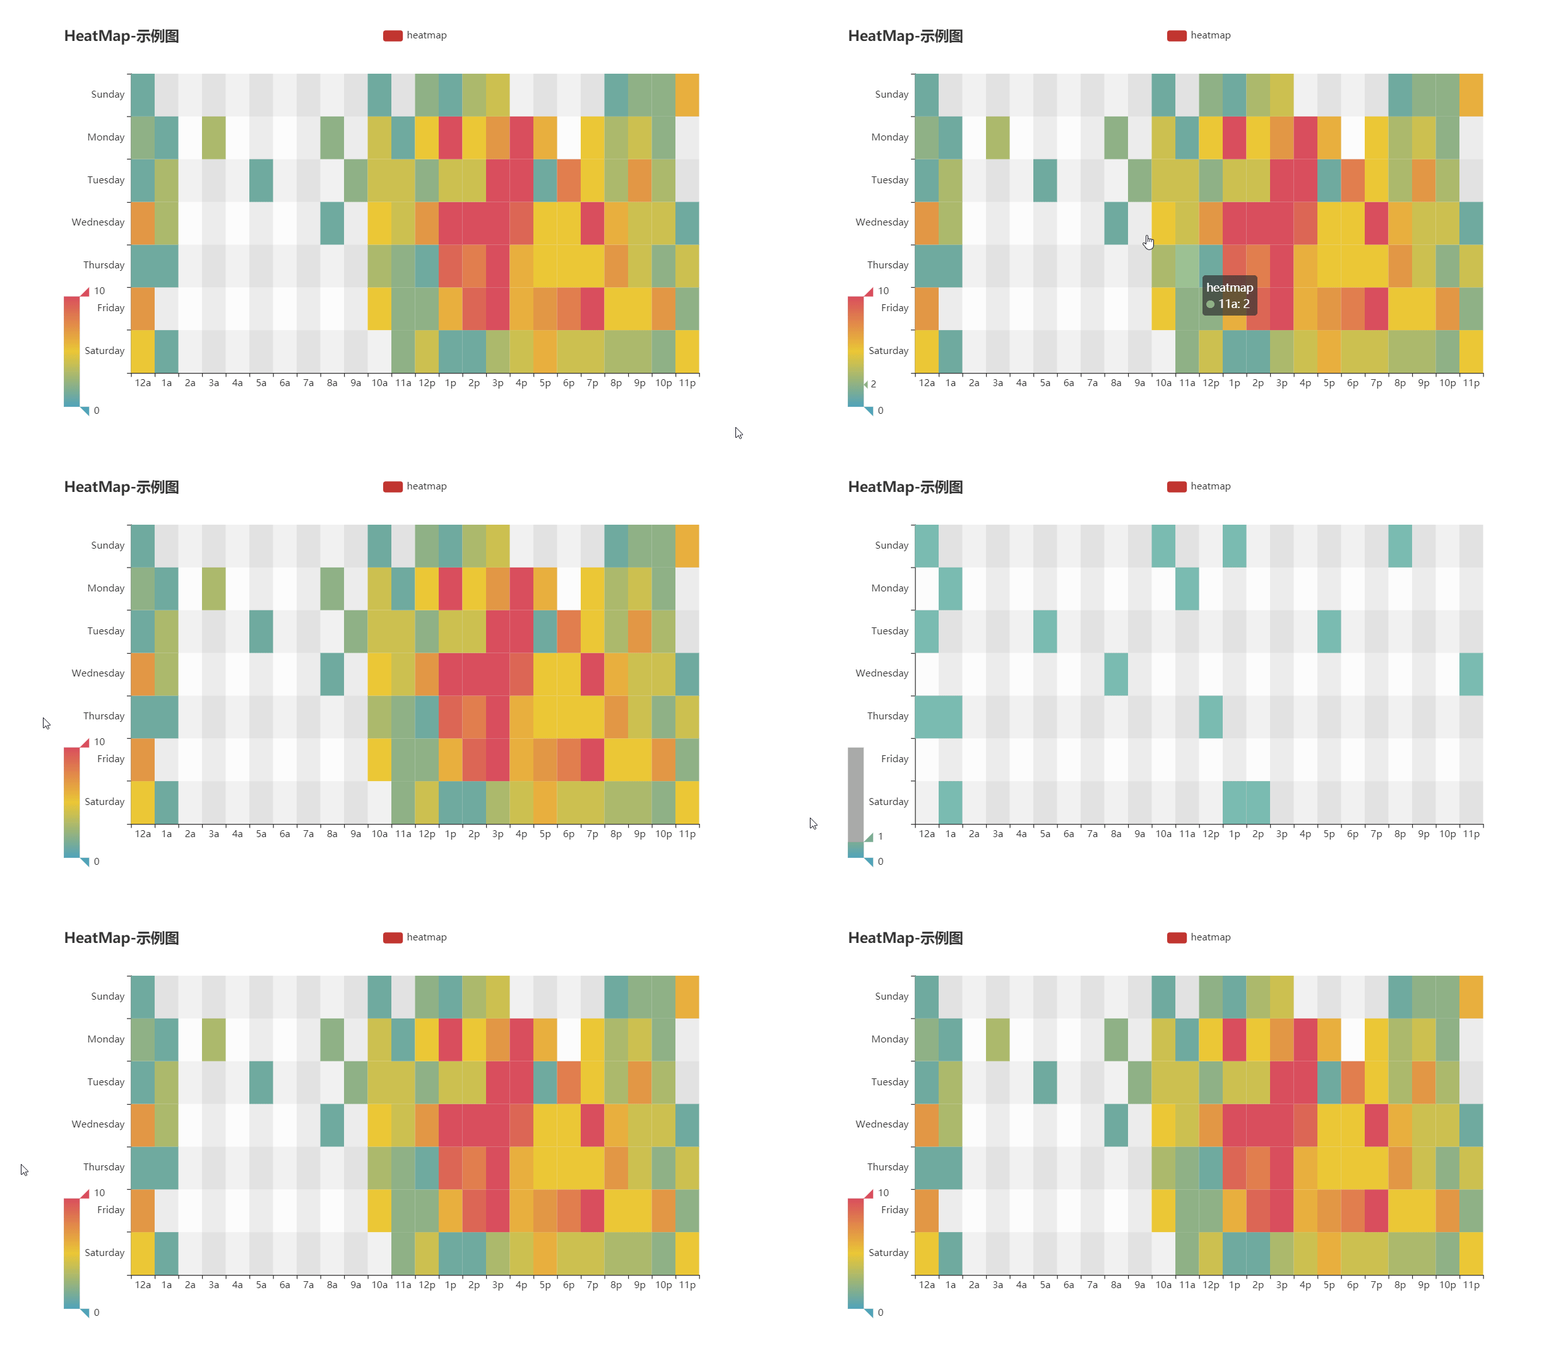
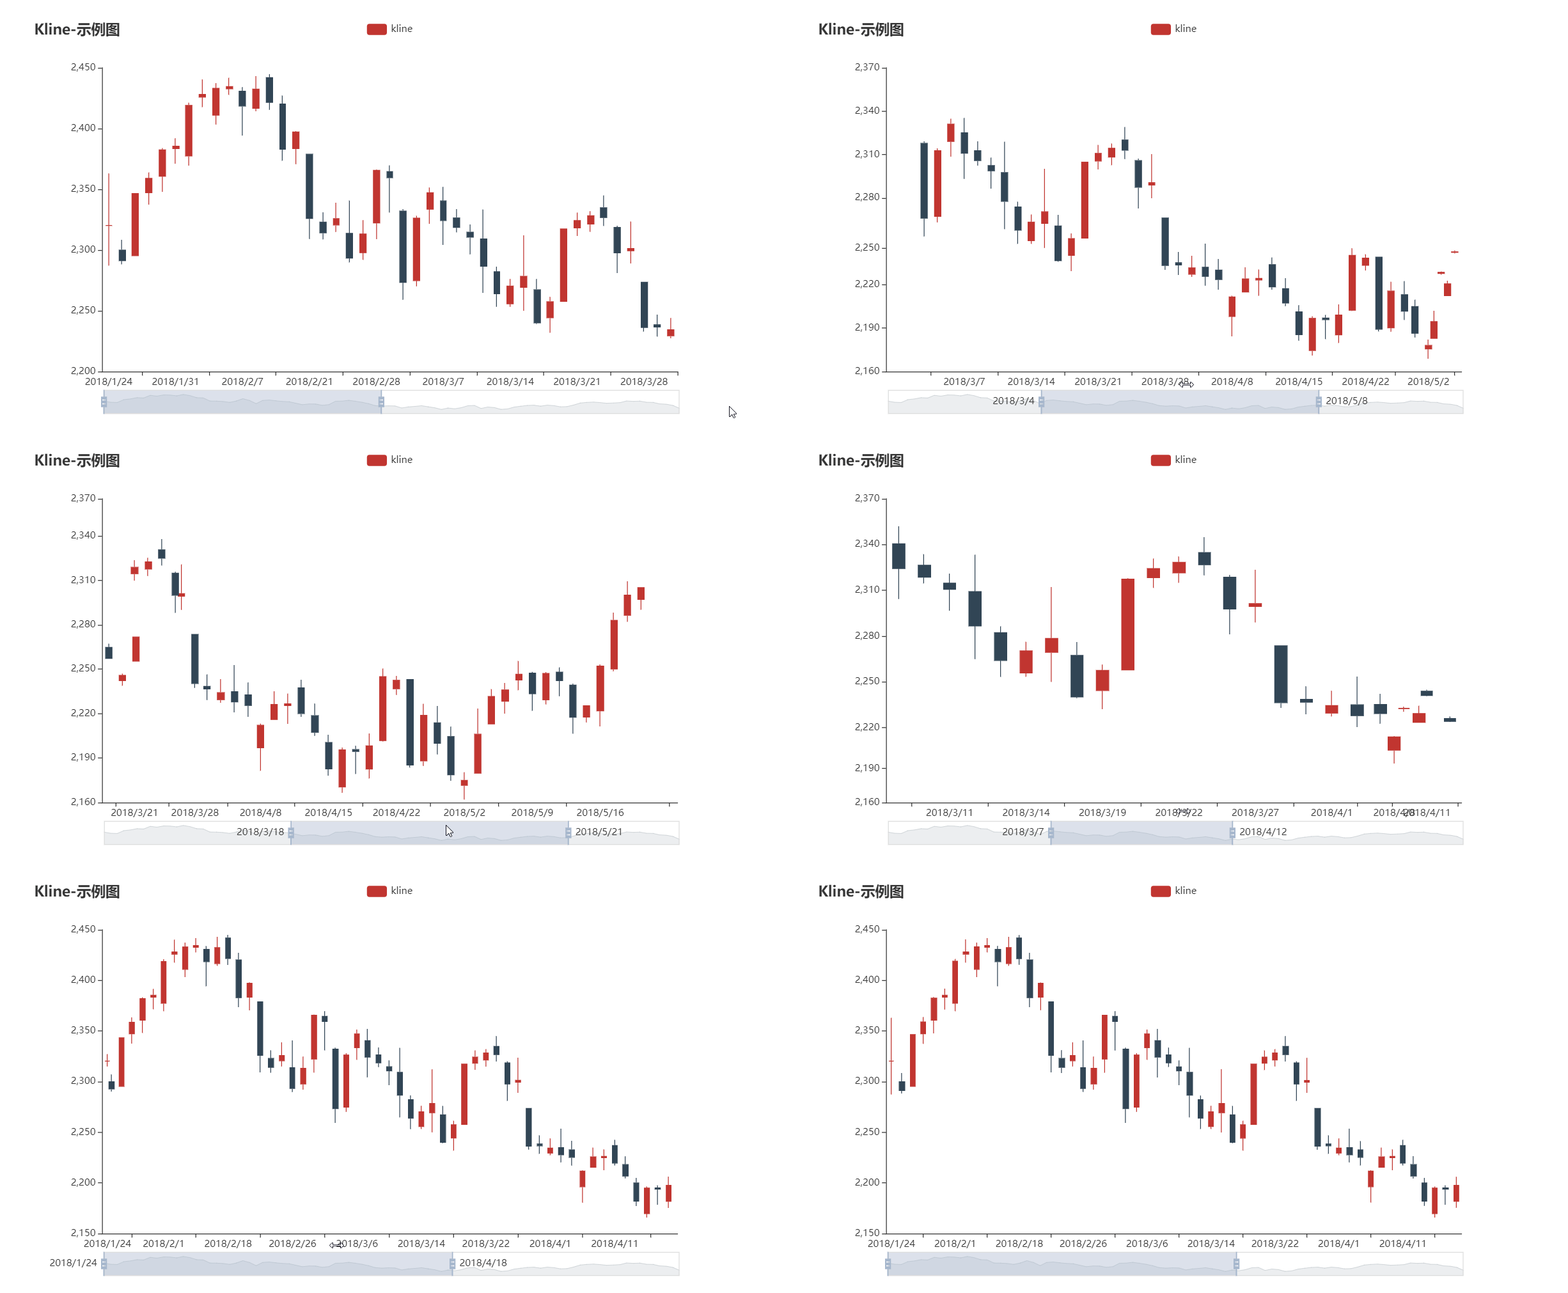
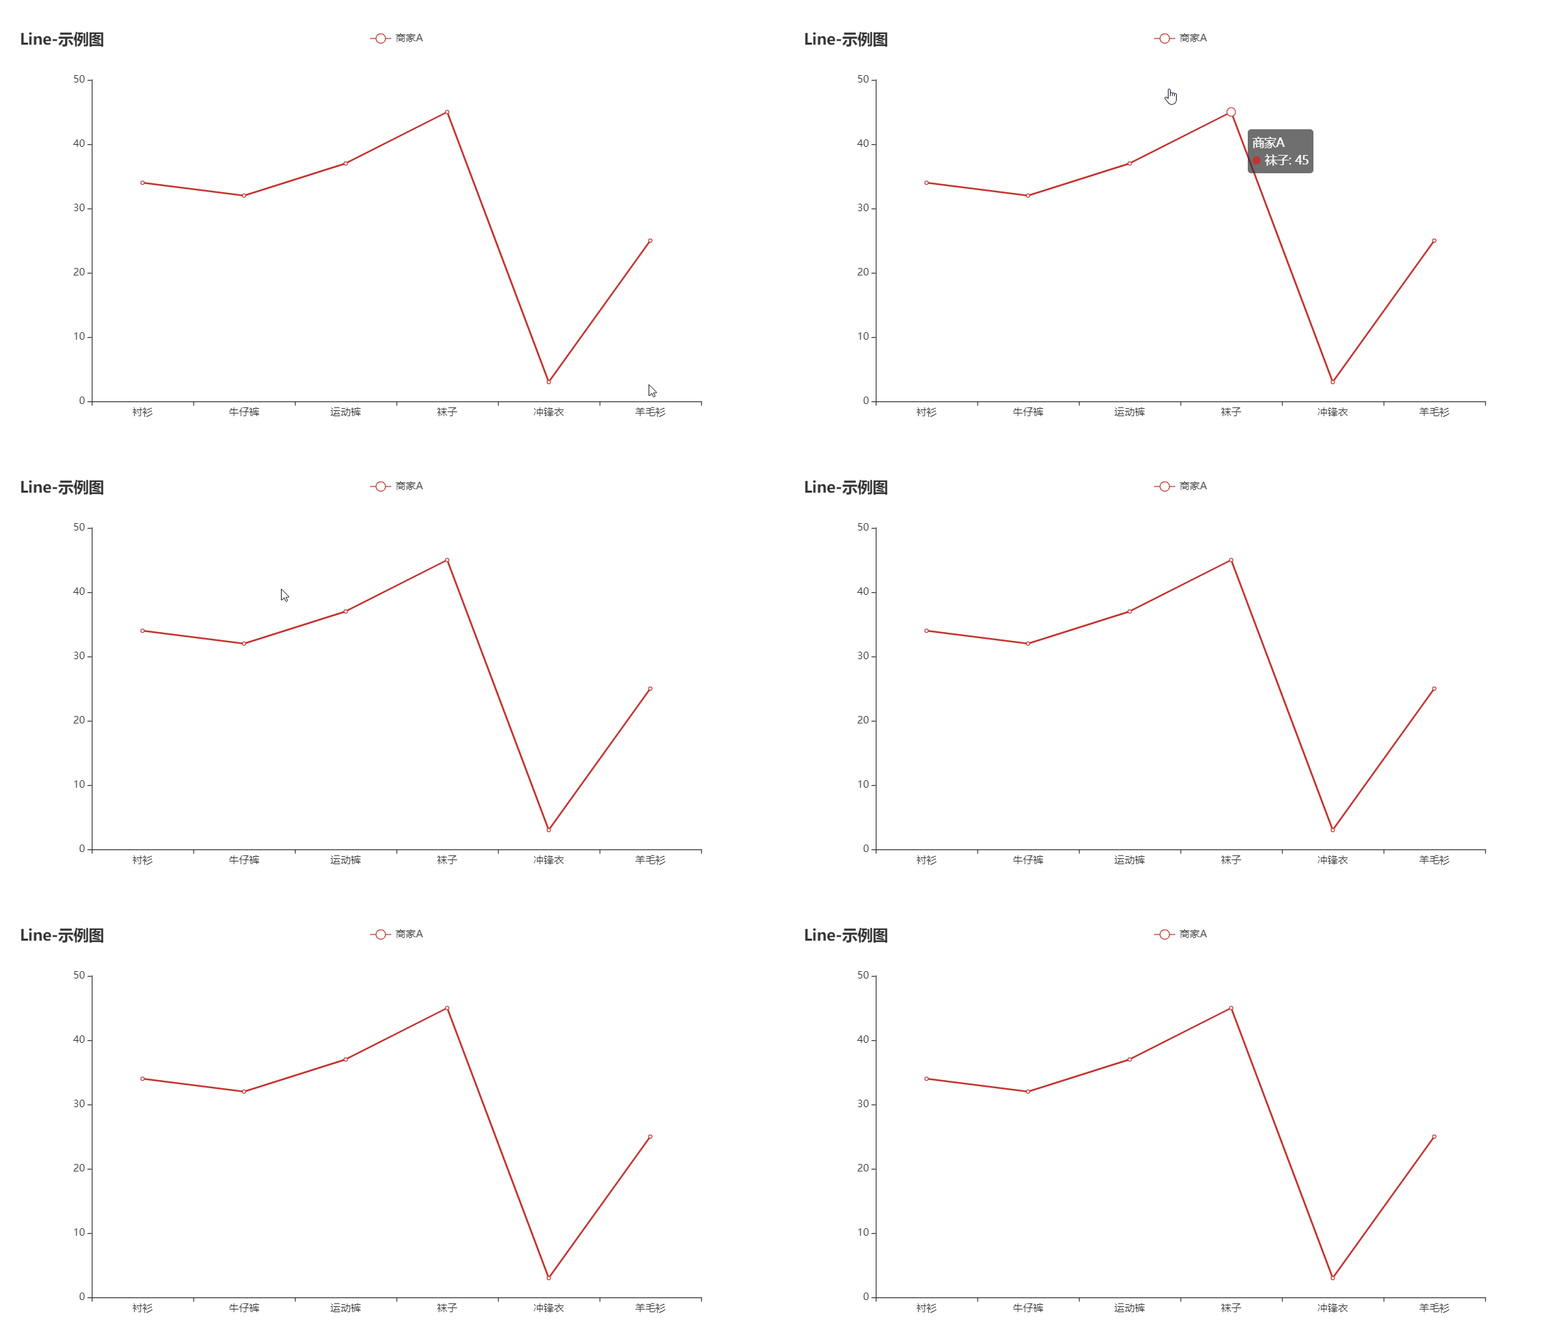
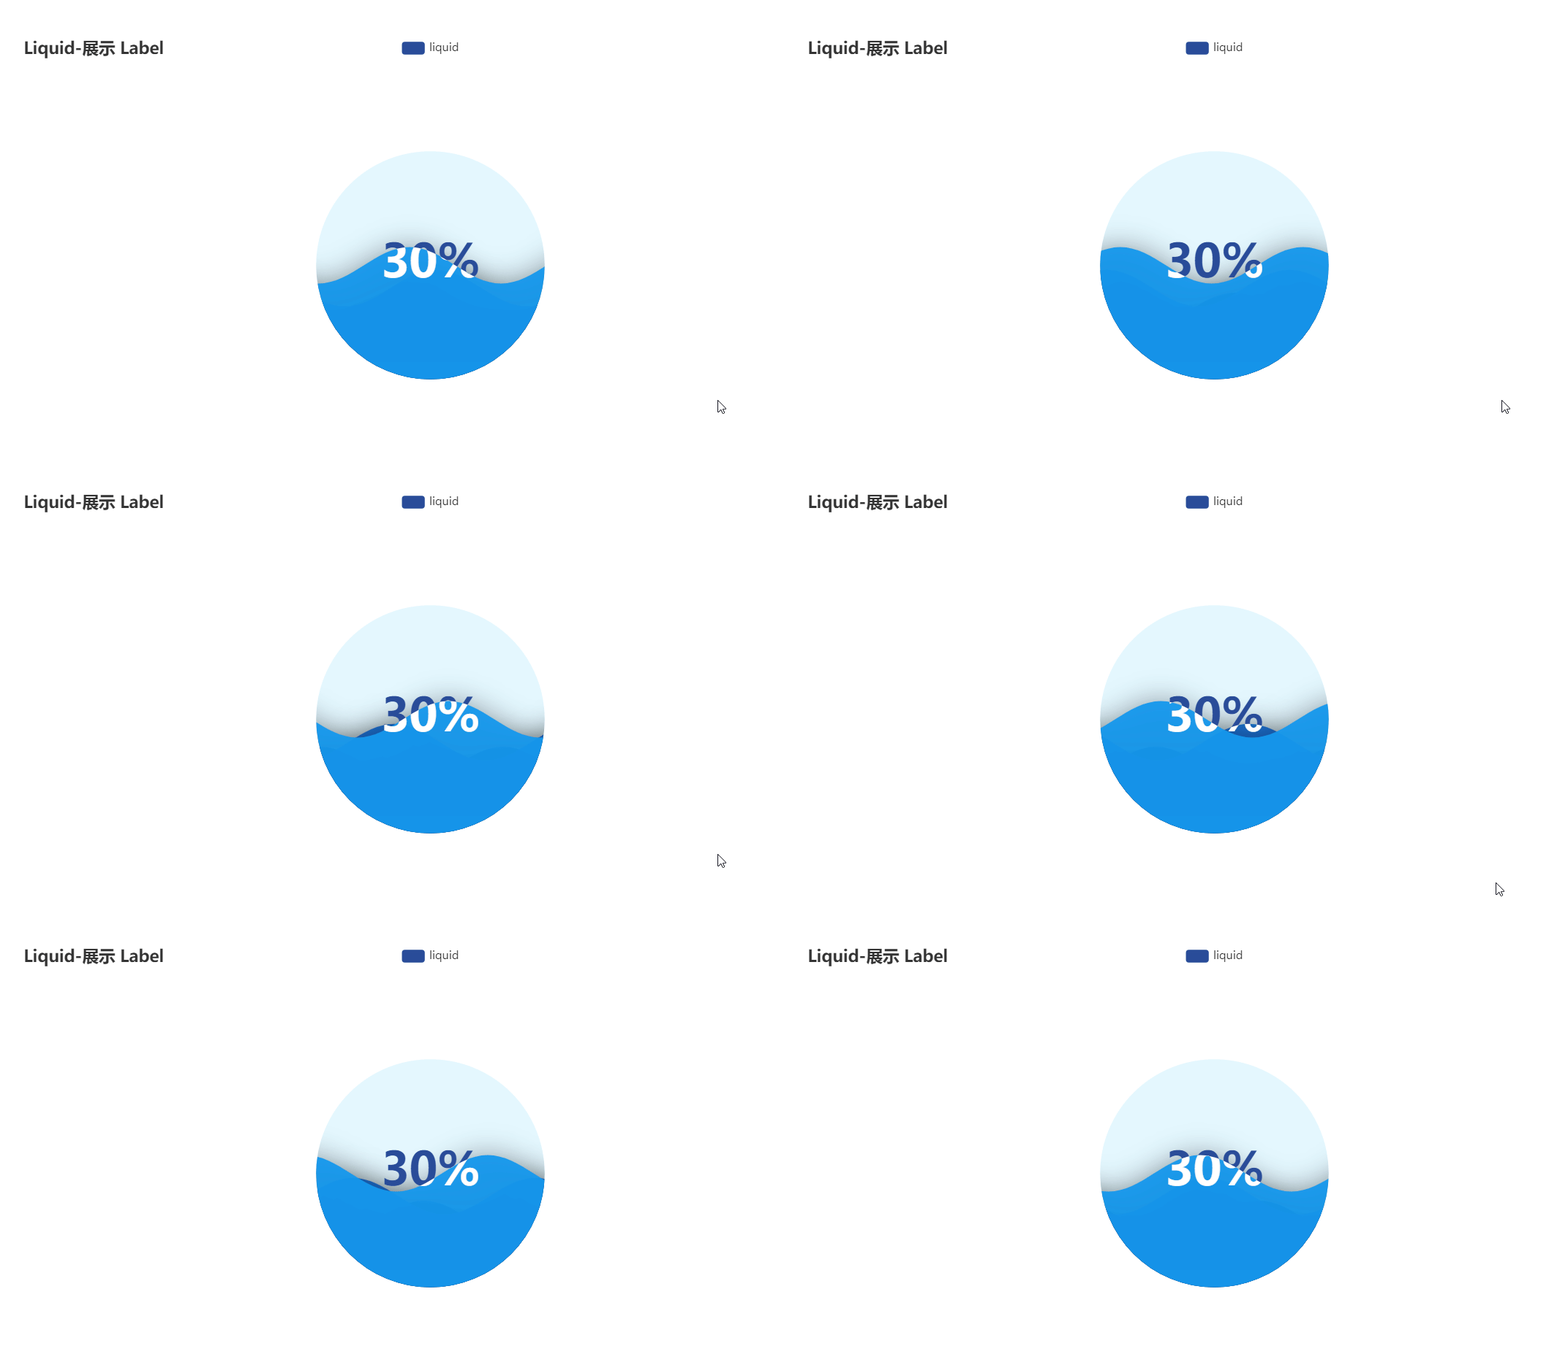
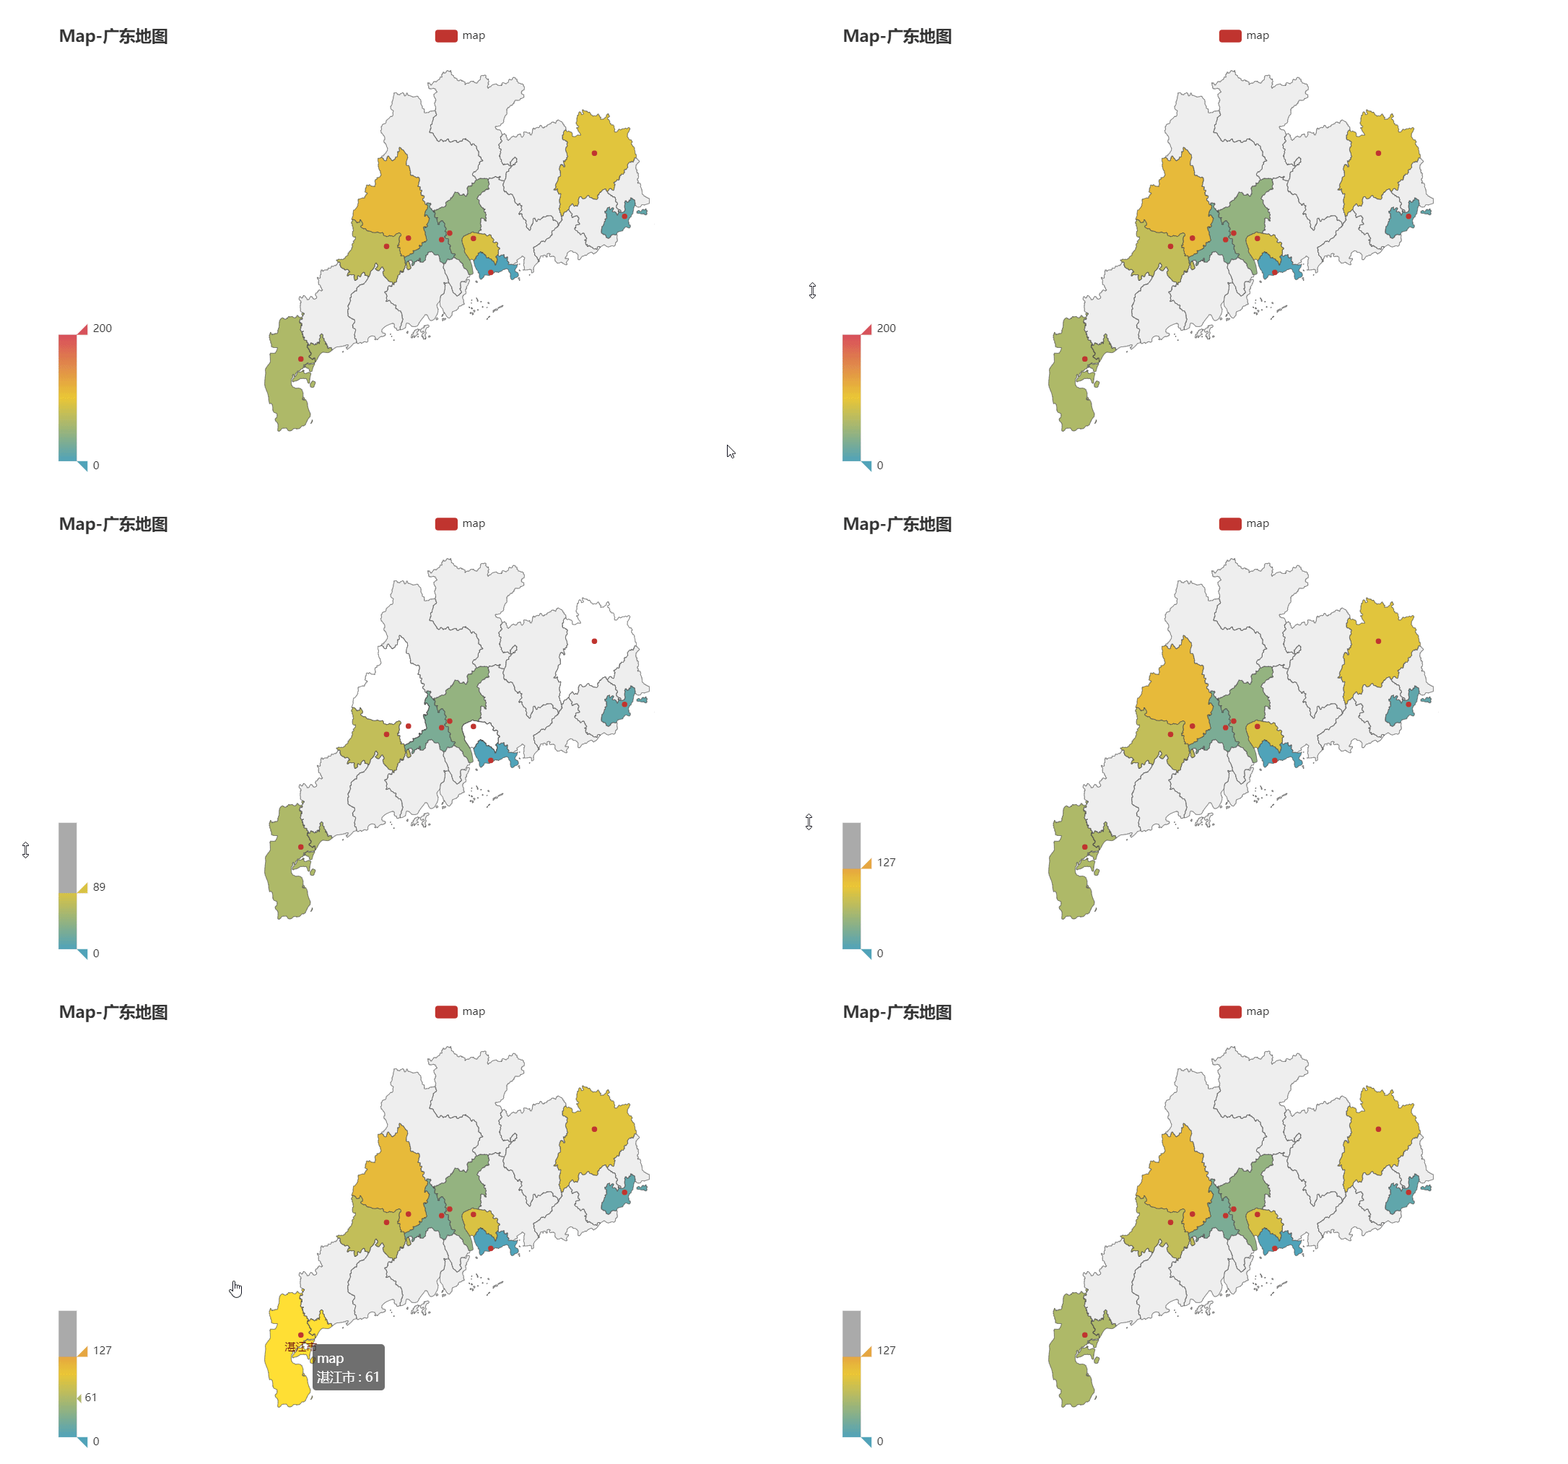
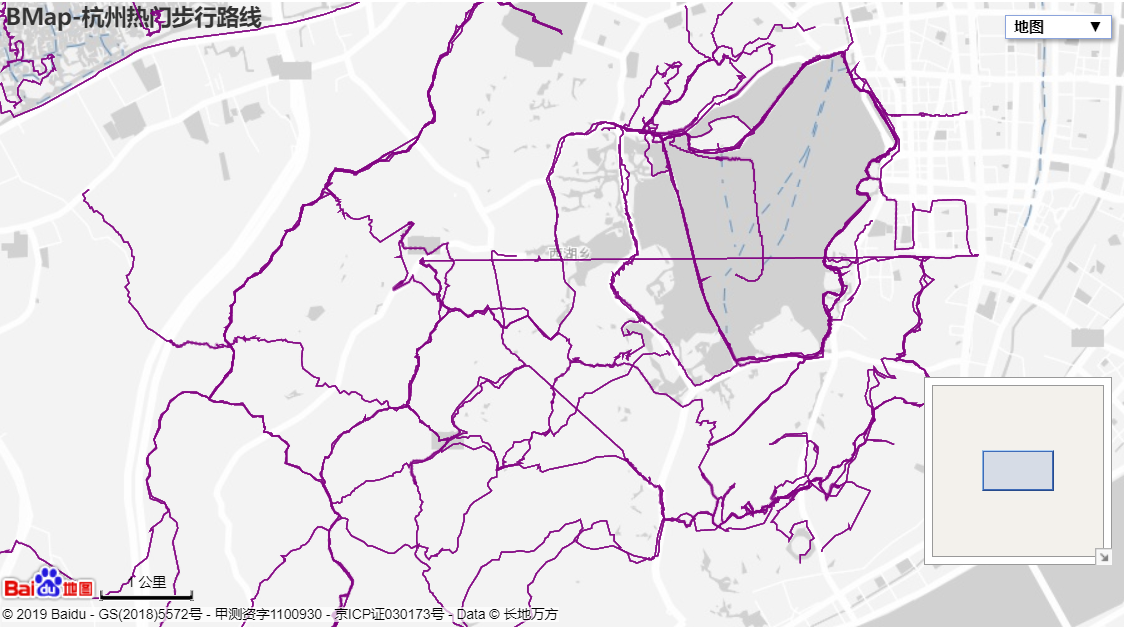
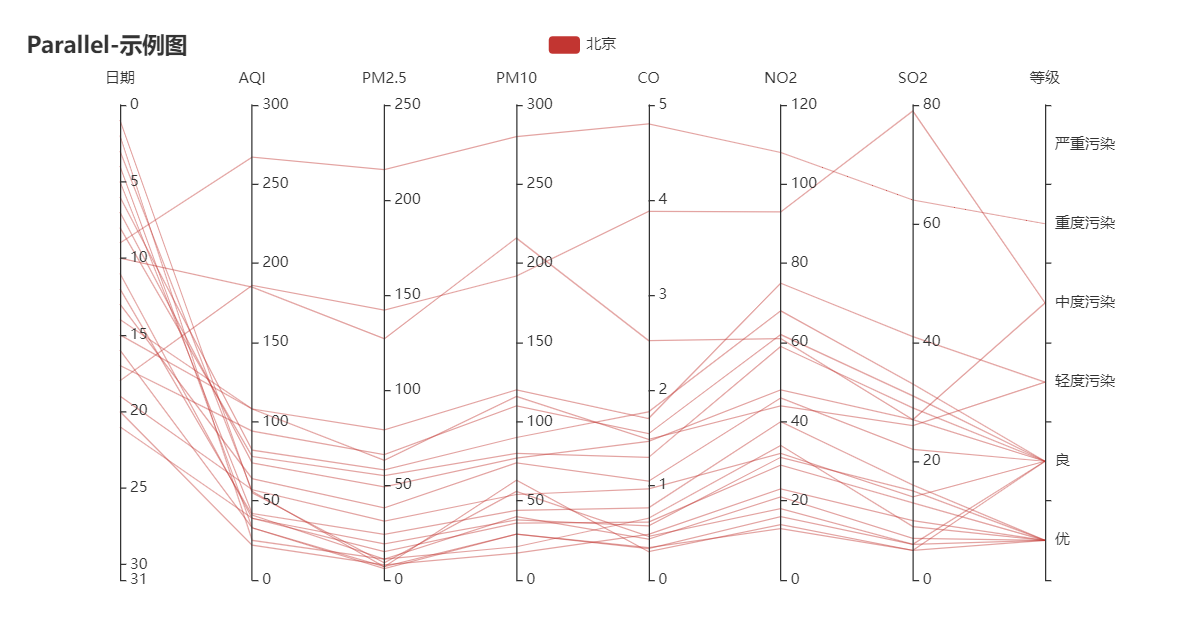
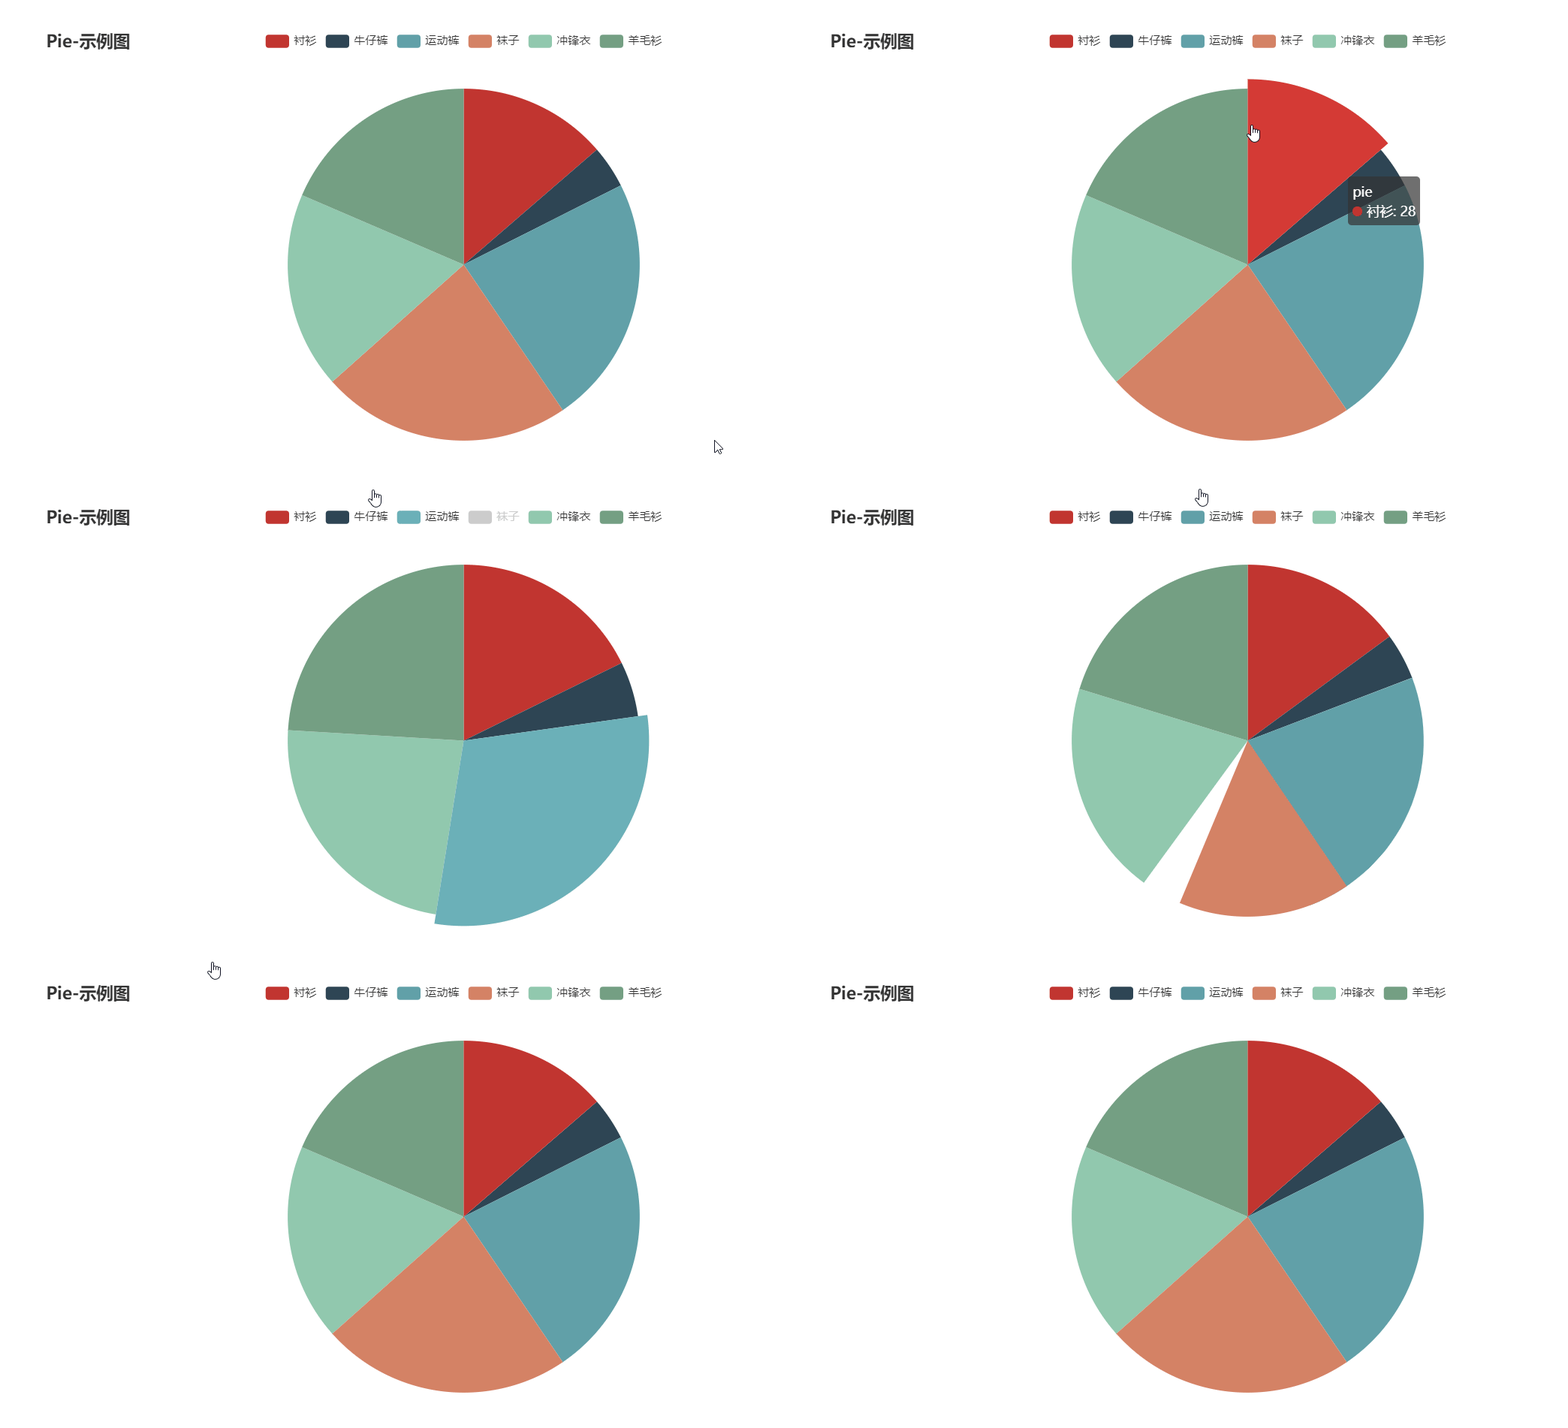
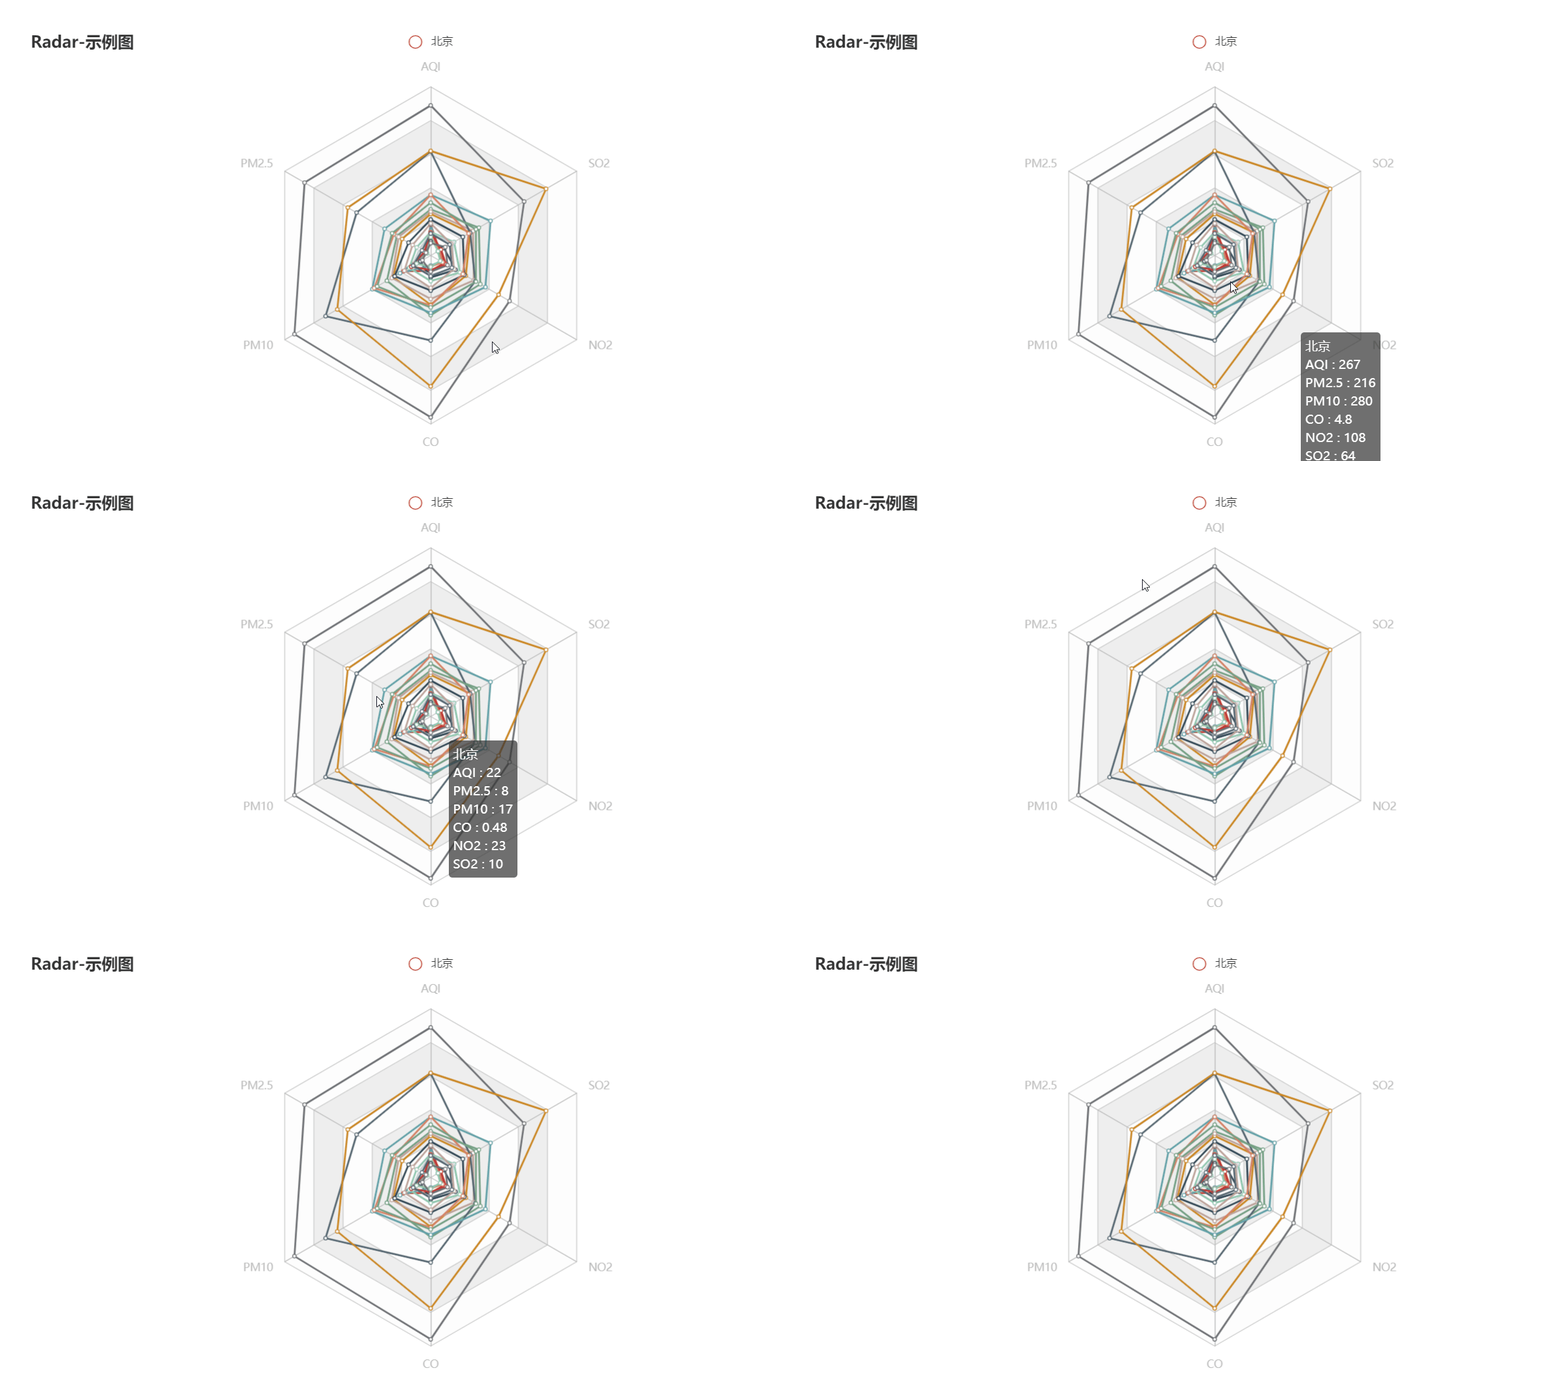
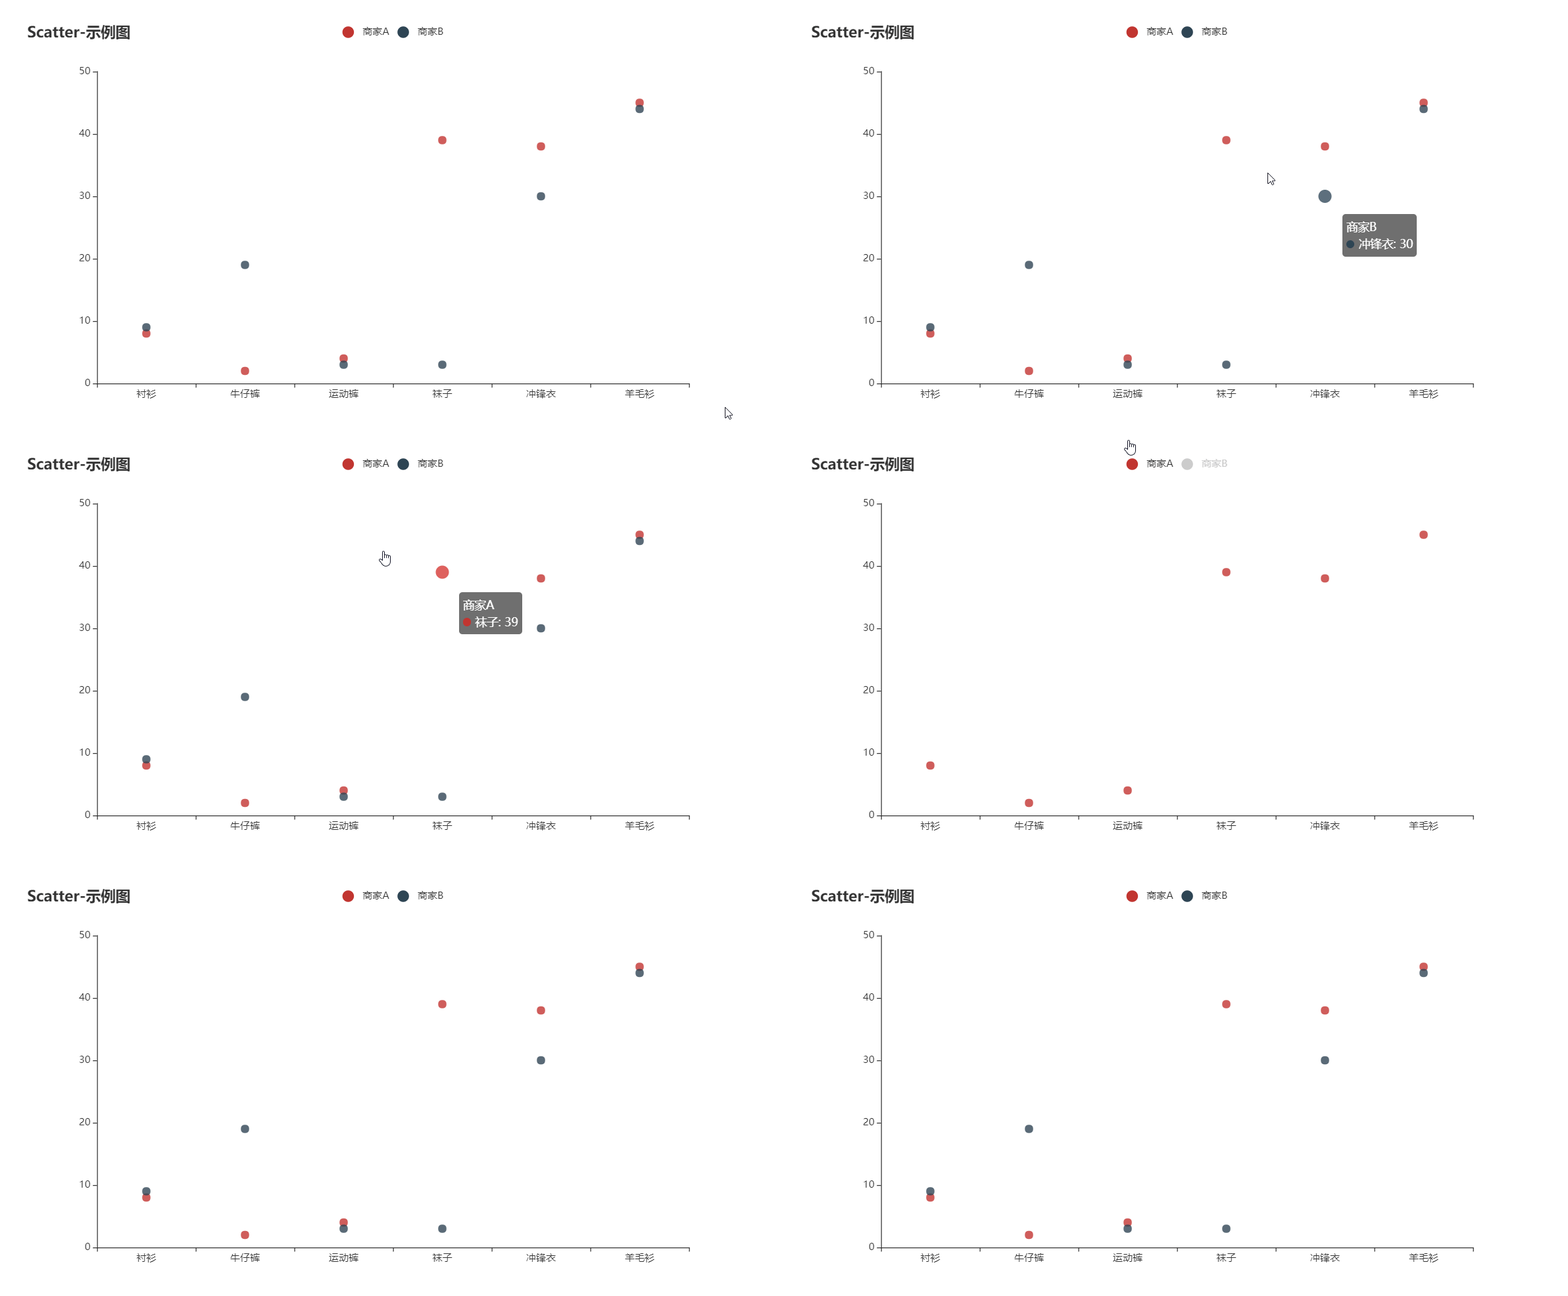
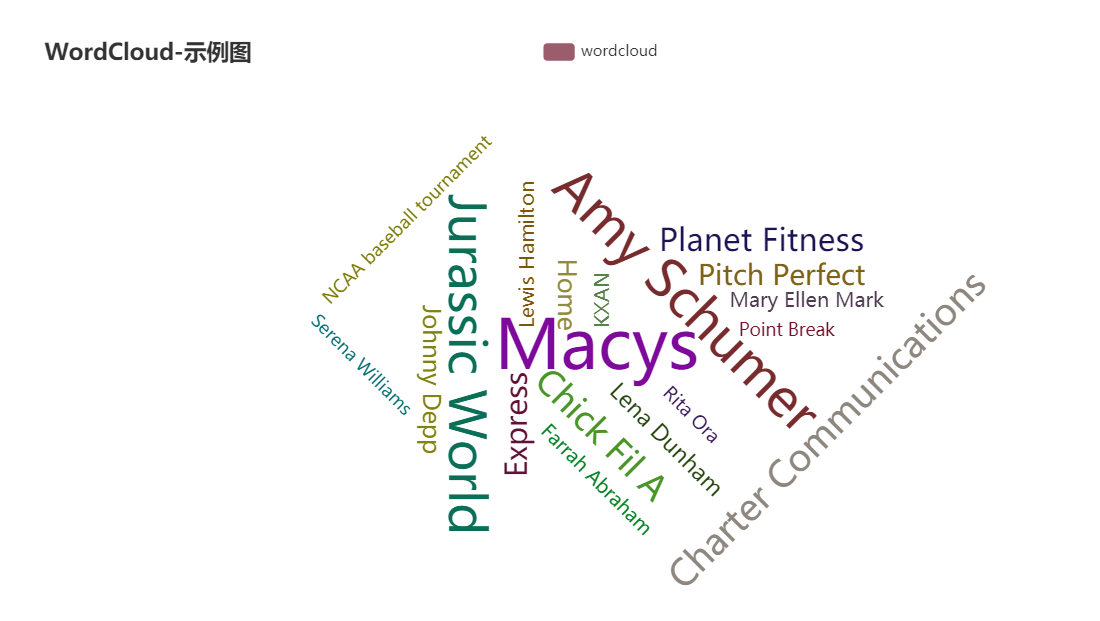
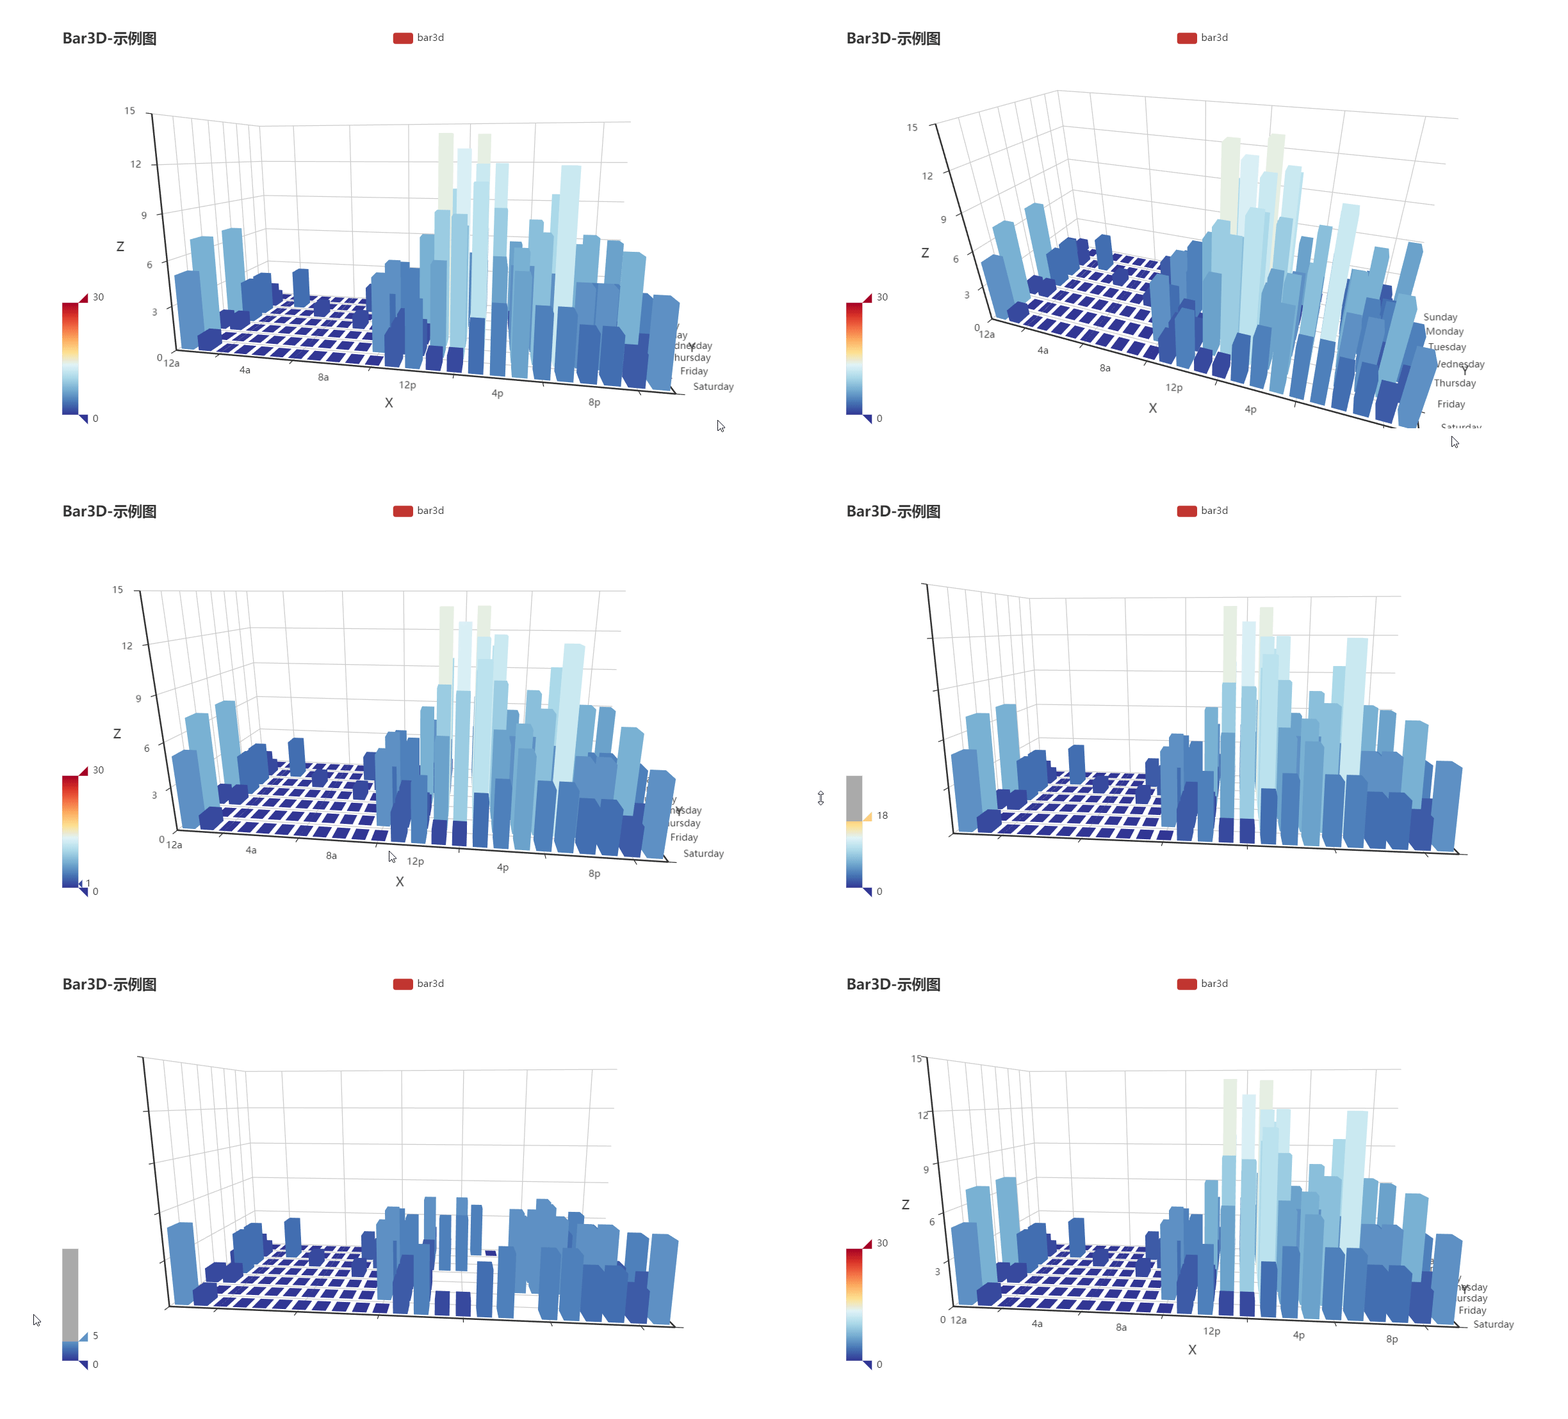
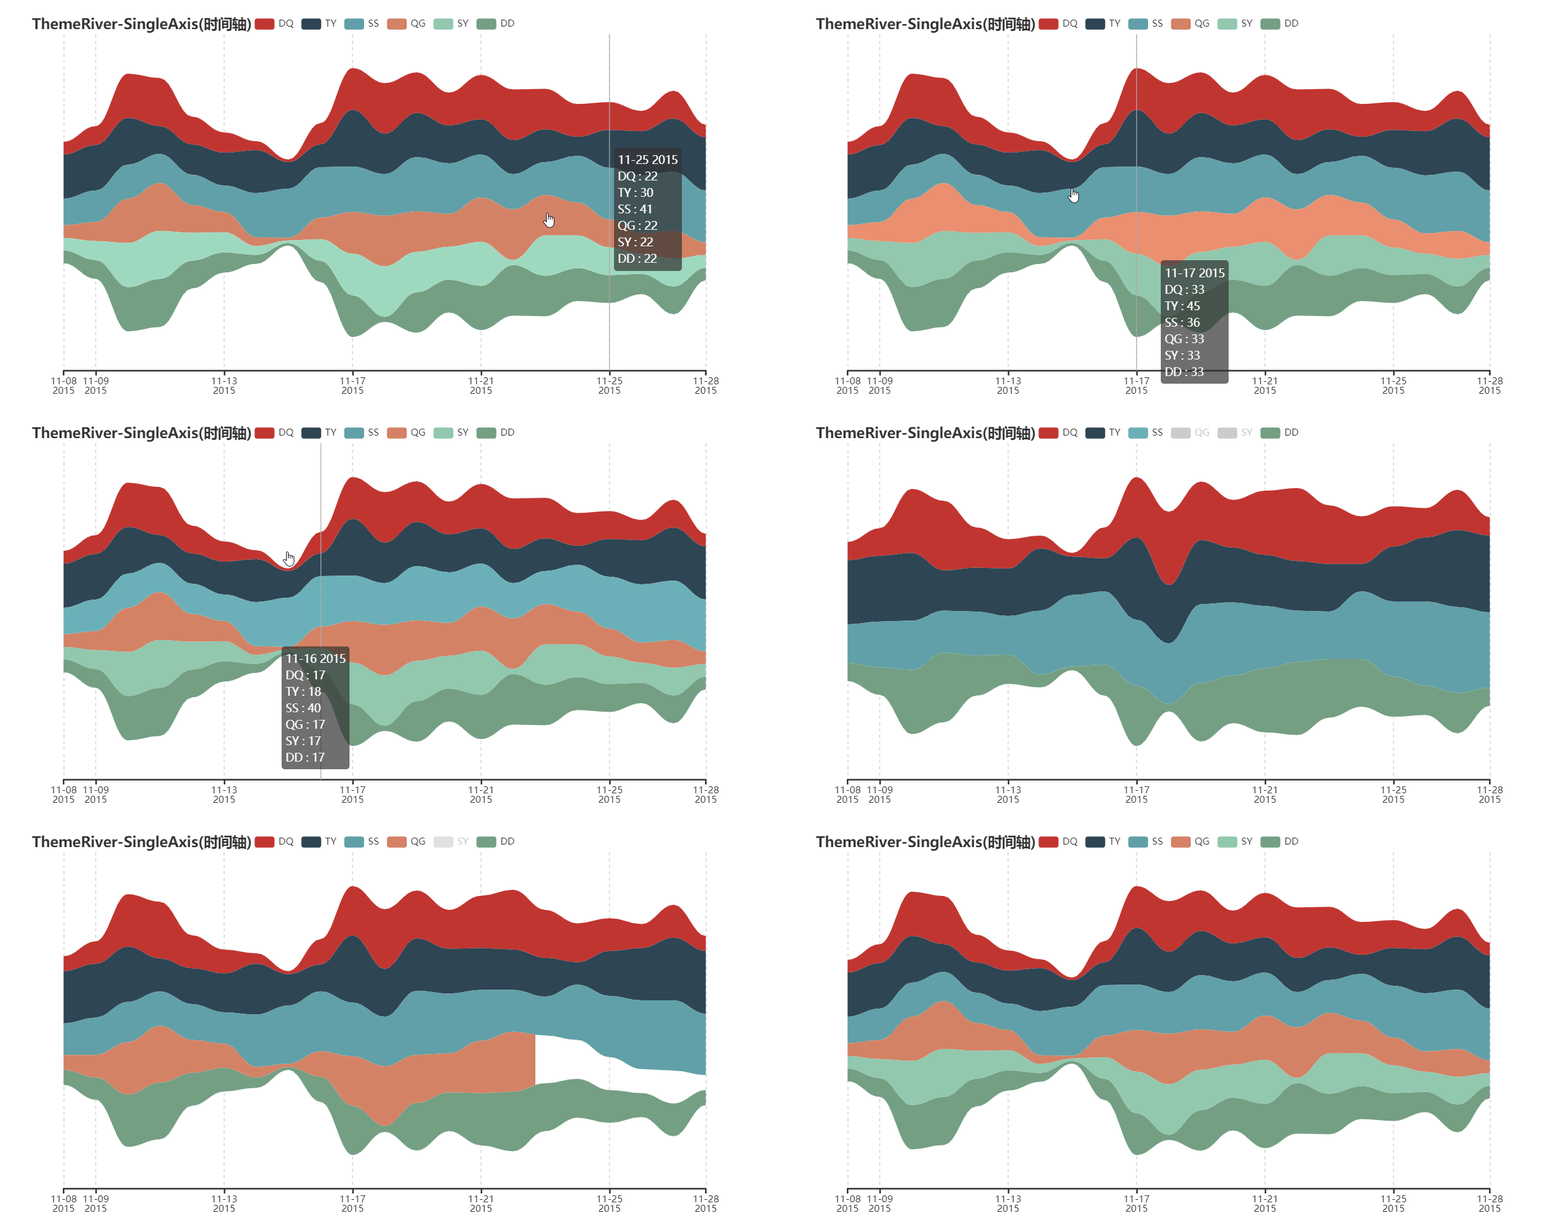
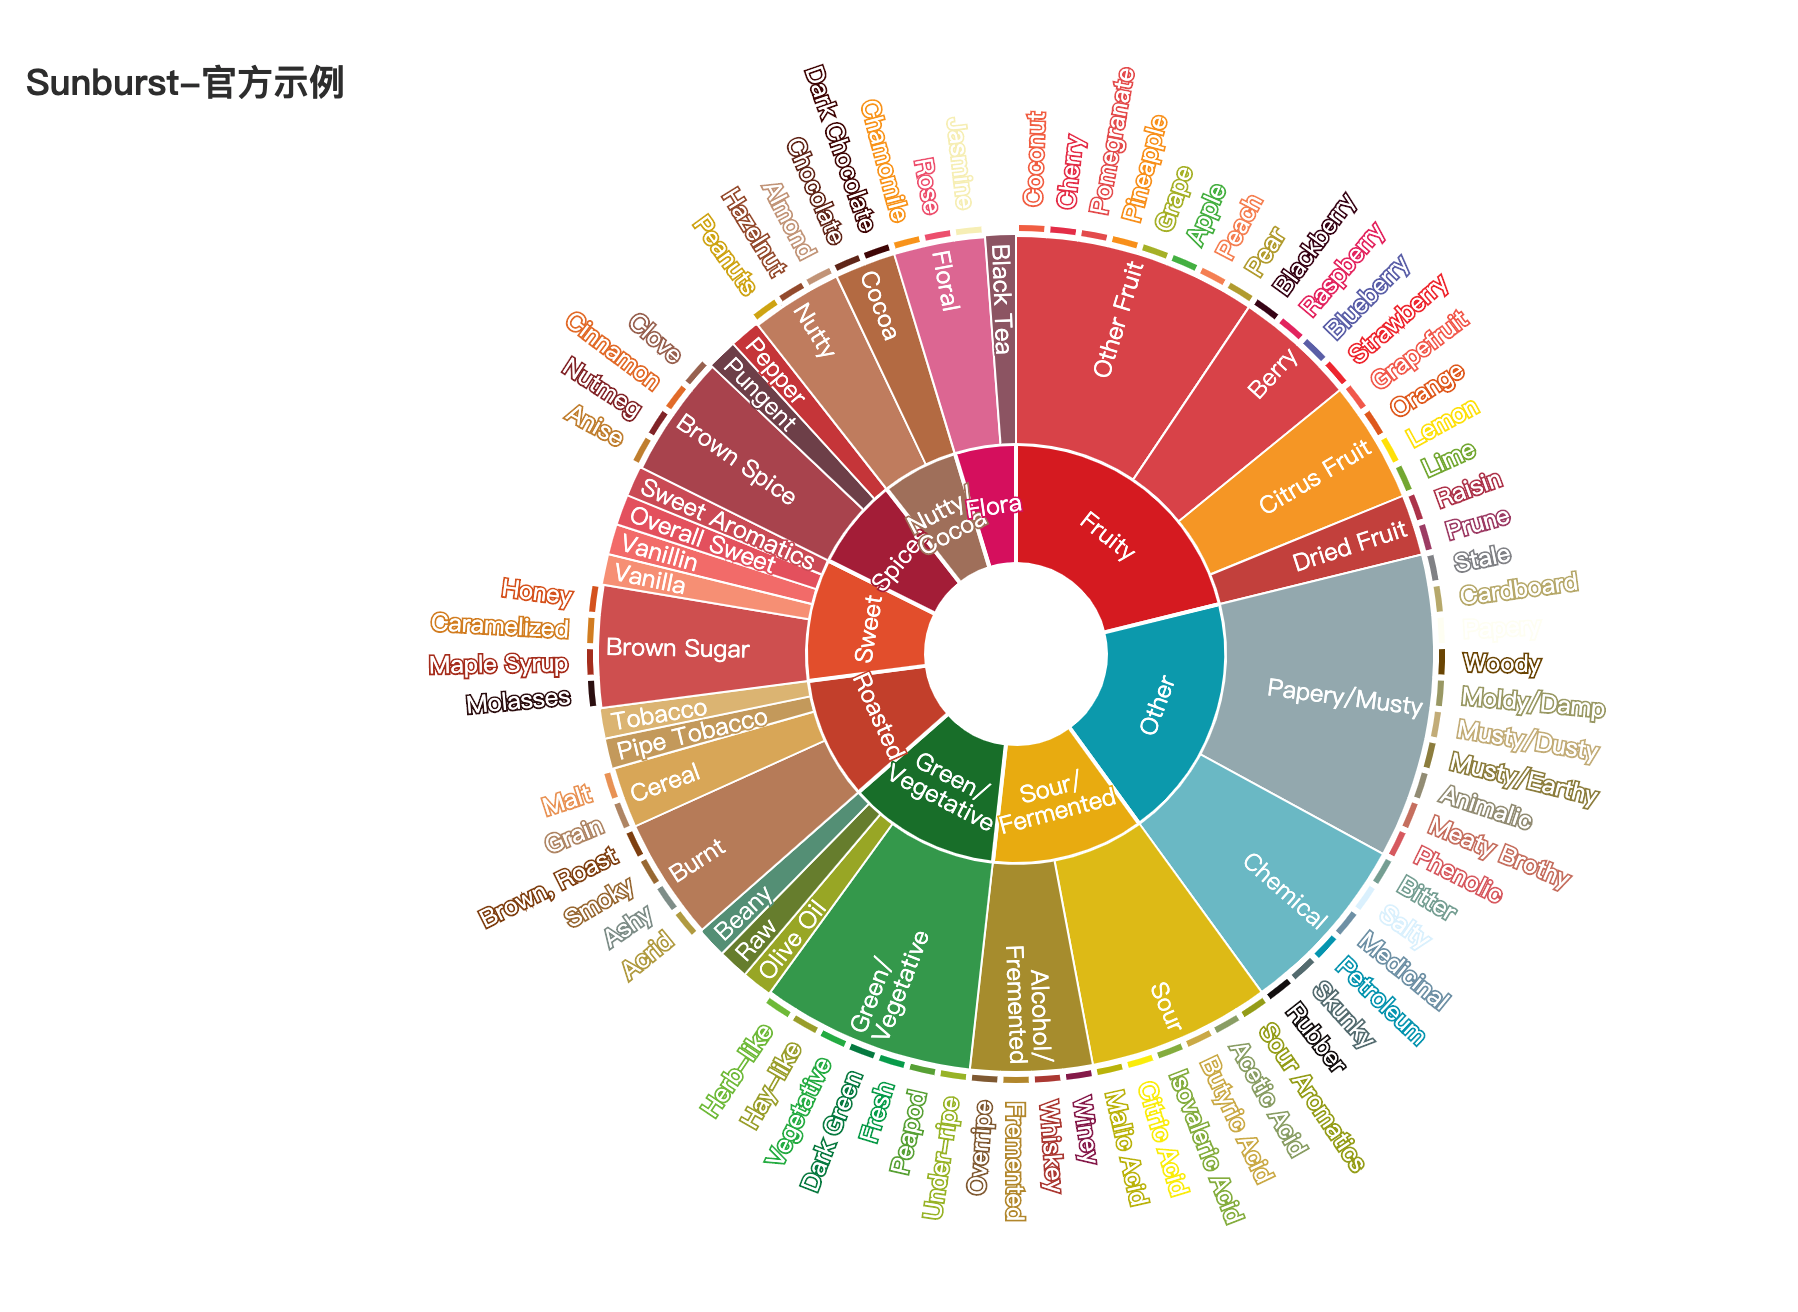
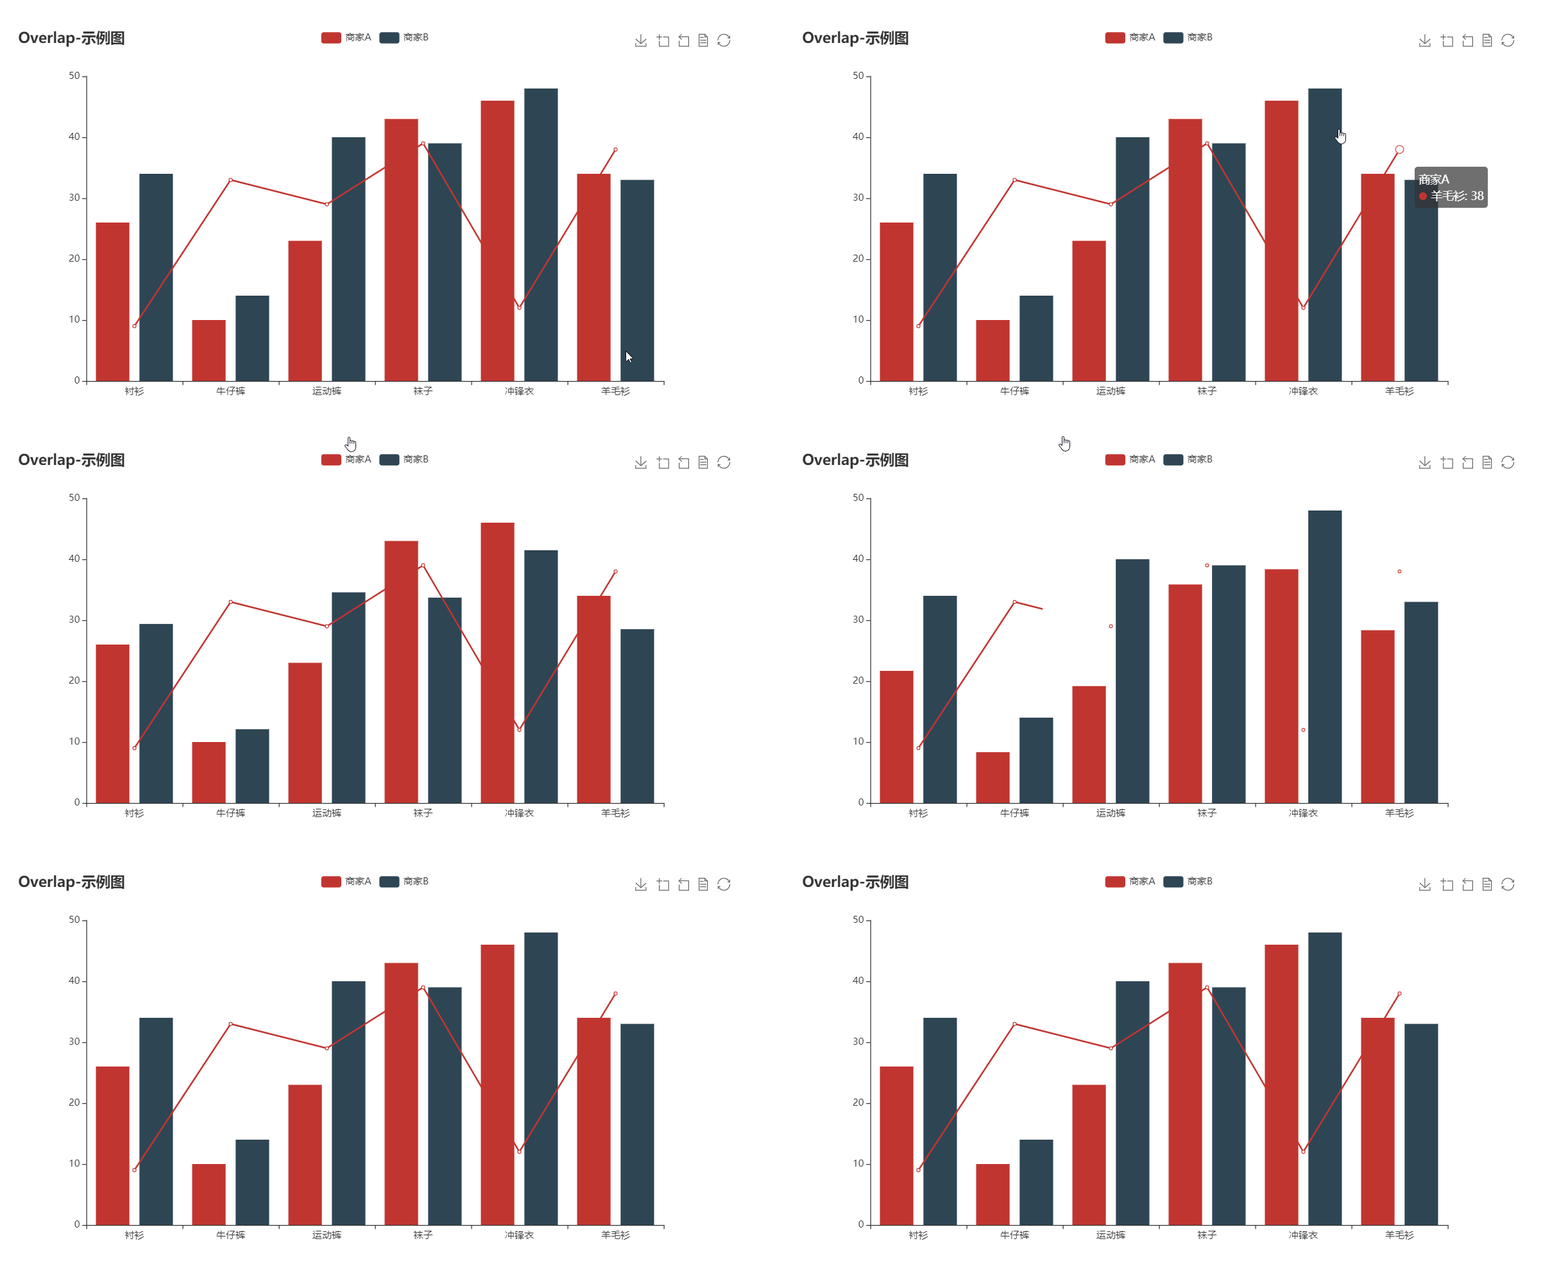
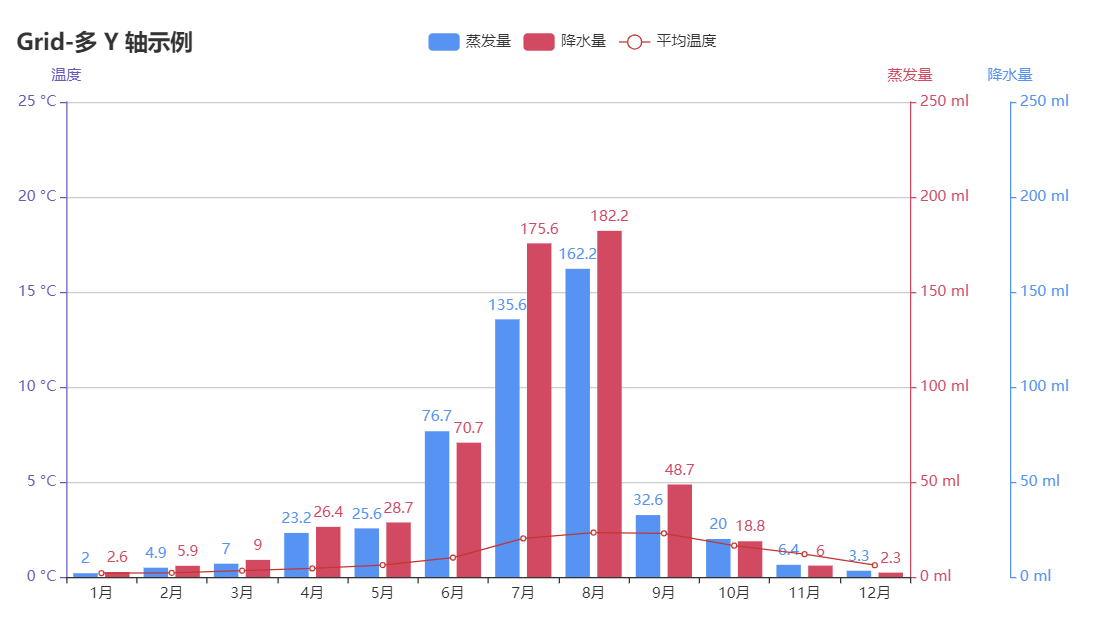
bar boxplot effectScatter funnel gague geo geo graph heatmap kline line liquid map bmap parallel pie ploar radar scatter tree treemap wordCloud bar3D line3D sankey scatter3D surface3D themeRiver sunburst overlap grid grid timeline

更多详细文档,请访问

代码质量

单元测试

$ pip install -r test/requirements.txt
$ make

集成测试

使用 Travis CIAppVeyor 持续集成环境。

代码规范

使用 flake8, Codecov 以及 pylint 提升代码质量。

😉 Author

pyecharts 主要由以下几位开发者开发维护

更多贡献者信息可以访问 pyecharts/graphs/contributors

💌 捐赠

开发和维护 pyecharts 花费了我巨大的心力,如果你觉得项目帮助到您,请认真考虑请作者喝一杯咖啡 😄

微信二维码 支付宝二维码
wechat-code alipay-code

如果其他开发者帮助到了您,也可以请他们喝咖啡 捐赠通道

💡 贡献

期待能有更多的开发者参与到 pyecharts 的开发中来,我们会保证尽快 Reivew PR 并且及时回复。但提交 PR 请确保

  1. 通过所有单元测试,如若是新功能,请为其新增单元测试
  2. 遵守开发规范,使用 black 以及 isort 格式化代码($ pip install -r requirements-dev.txt)
  3. 如若需要,请更新相对应的文档

我们也非常欢迎开发者能为 pyecharts 提供更多的示例,共同来完善文档,文档项目位于 pyecharts/website

📃 License

MIT ©chenjiandongx

Note that the project description data, including the texts, logos, images, and/or trademarks, for each open source project belongs to its rightful owner. If you wish to add or remove any projects, please contact us at [email protected].