
| Package | Description | Status |
|---|---|---|
| PyNHD | Navigate and subset NHDPlus (MR and HR) using web services | |
| Py3DEP | Access topographic data through National Map's 3DEP web service | |
| PyGeoHydro | Access NWIS, NID, WQP, HCDN 2009, NLCD, CAMELS, and SSEBop databases | |
| PyDaymet | Access Daymet for daily climate data both single pixel and gridded | |
| AsyncRetriever | High-level API for asynchronous requests with persistent caching | |
| PyGeoOGC | Send queries to any ArcGIS RESTful-, WMS-, and WFS-based services | |
| PyGeoUtils | Convert responses from PyGeoOGC's supported web services to datasets |
PyGeoHydro: Retrieve Geospatial Hydrology Data


Features
PyGeoHydro (formerly named hydrodata) is a part of
HyRiver software stack that
is designed to aid in hydroclimate analysis through web services. This package provides
access to some public web services that offer geospatial hydrology data. It has three
main modules: pygeohydro, plot, and helpers.
PyGeoHydro supports the following datasets:
- NWIS for daily mean streamflow observations
(returned as a
pandas.DataFrameorxarray.Datasetwith station attributes), - CAMELS for accessing streamflow observations (1980-2014) and basin-level attributes of 671 stations within CONUS.
- Water Quality Portal for accessing current and historical water quality data from more than 1.5 million sites across the US,
- NID for accessing the National Inventory of Dams web service,
- HCDN 2009 for identifying sites where human activity affects the natural flow of the watercourse,
- NLCD 2019 for land cover/land use, imperviousness, imperviousness descriptor, and canopy data. You can get data using both geometries and coordinates.
- WBD for accessing Hydrologic Unit (HU) polygon boundaries within the US (all HUC levels).
- SSEBop for daily actual evapotranspiration, for both single pixel and gridded data.
Also, it has two other functions:
interactive_map: Interactive map for exploring NWIS stations within a bounding box.cover_statistics: Categorical statistics of land use/land cover data.overland_roughness: Estimate overland roughness from land use/land cover data.
The plot module includes two main functions:
signatures: Hydrologic signature graphs.cover_legends: Official NLCD land cover legends for plotting a land cover dataset.descriptor_legends: Color map and legends for plotting an imperviousness descriptor dataset.
The helpers module includes:
nlcd_helper: A roughness coefficients lookup table for each land cover and imperviousness descriptor type which is useful for overland flow routing among other applications.nwis_error: A dataframe for finding information about NWIS requests' errors.
You can find some example notebooks here.
Moreover, under the hood, PyGeoHydro uses AsyncRetriever for making requests asynchronously with persistent caching. This improves the reliability and speed of data retrieval significantly. AsyncRetriever caches all request/response pairs and upon making an already cached request, it will retrieve the responses from the cache if the server's response is unchanged.
You can control the request/response caching behavior by setting the following environment variables:
HYRIVER_CACHE_NAME: Path to the caching SQLite database. It defaults to./cache/aiohttp_cache.sqliteHYRIVER_CACHE_EXPIRE: Expiration time for cached requests in seconds. It defaults to -1 (never expire).HYRIVER_CACHE_DISABLE: Disable reading/writing from/to the cache. The default is false.
For example, in your code before making any requests you can do:
import os

os.environ["HYRIVER_CACHE_NAME"] = "path/to/file.sqlite"
os.environ["HYRIVER_CACHE_EXPIRE"] = "3600"
os.environ["HYRIVER_CACHE_DISABLE"] = "true"
You can also try using PyGeoHydro without installing it on your system by clicking on the binder badge. A Jupyter Lab instance with the HyRiver stack pre-installed will be launched in your web browser, and you can start coding!
Please note that since this project is in early development stages, while the provided functionalities should be stable, changes in APIs are possible in new releases. But we appreciate it if you give this project a try and provide feedback. Contributions are most welcome.
Moreover, requests for additional functionalities can be submitted via issue tracker.
Installation
You can install PyGeoHydro using pip after installing libgdal on your system
(for example, in Ubuntu run sudo apt install libgdal-dev). Moreover, PyGeoHydro has an optional
dependency for using persistent caching, requests-cache. We highly recommend installing
this package as it can significantly speed up send/receive queries. You don't have to change
anything in your code, since PyGeoHydro under-the-hood looks for requests-cache and
if available, it will automatically use persistent caching:
$ pip install pygeohydroAlternatively, PyGeoHydro can be installed from the conda-forge repository
using Conda:
$ conda install -c conda-forge pygeohydroQuick start
We can explore the available NWIS stations within a bounding box using interactive_map
function. It returns an interactive map and by clicking on a station some of the most
important properties of stations are shown.
import pygeohydro as gh

bbox = (-69.5, 45, -69, 45.5)
gh.interactive_map(bbox)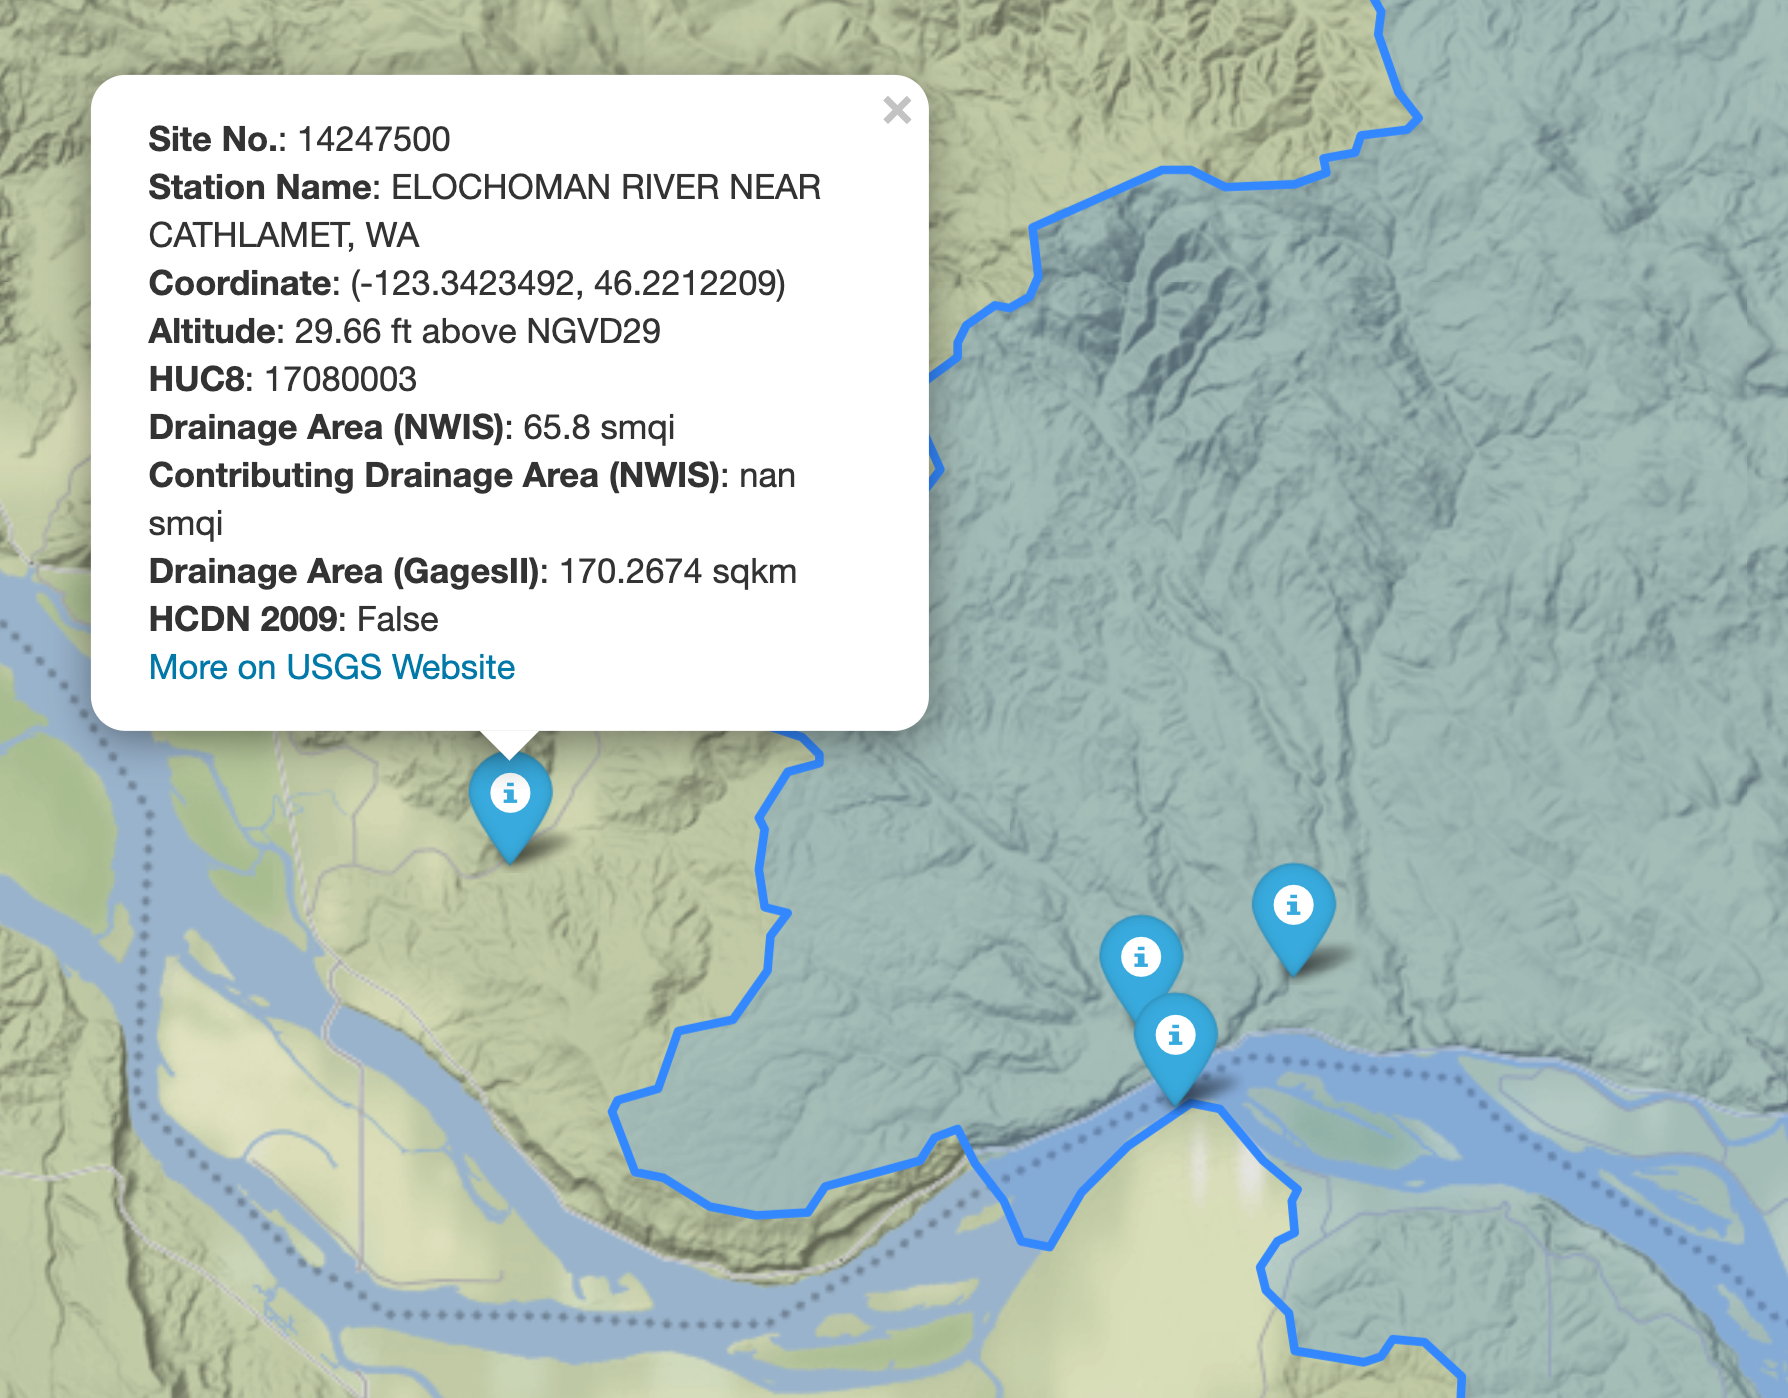
We can select all the stations within this boundary box that have daily mean streamflow data from
2000-01-01 to 2010-12-31:
from pygeohydro import NWIS

nwis = NWIS()
query = {
    **nwis.query_bybox(bbox),
    "hasDataTypeCd": "dv",
    "outputDataTypeCd": "dv",
}
info_box = nwis.get_info(query)
dates = ("2000-01-01", "2010-12-31")
stations = info_box[
    (info_box.begin_date <= dates[0]) & (info_box.end_date >= dates[1])
].site_no.tolist()
Then, we can get the daily streamflow data in mm/day (by default the values are in cms) and plot them:
from pygeohydro import plot

qobs = nwis.get_streamflow(stations, dates, mmd=True)
plot.signatures(qobs)
By default, get_streamflow returns a pandas.DataFrame that has a attrs method
containing metadata for all the stations. You can access it like so qobs.attrs.
Moreover, we can get the same data as xarray.Dataset as follows:
qobs_ds = nwis.get_streamflow(stations, dates, to_xarray=True)This xarray.Dataset has two dimensions: time and station_id. It has
10 variables including discharge with two dimensions while other variables
that are station attitudes are one dimensional.
We can also get instantaneous streamflow data using get_streamflow. This method assumes
that the input dates are in UTC time zone and returns the data in UTC time zone as well.
date = ("2005-01-01 12:00", "2005-01-12 15:00")
qobs = nwis.get_streamflow("01646500", date, freq="iv")
We can get the CAMELS dataset as a geopandas.GeoDataFrame that includes geometry and
basin-level attributes of 671 natural watersheds within CONUS and their streamflow
observations between 1980-2014 as a xarray.Dataset, like so:
attrs, qobs = gh.get_camels()
The WaterQuality has a number of convenience methods to retrieve data from the
web service. Since there are many parameter combinations that can be
used to retrieve data, a general method is also provided to retrieve data from
any of the valid endpoints. You can use get_json to retrieve stations info
as a geopandas.GeoDataFrame or get_csv to retrieve stations data as a
pandas.DataFrame. You can construct a dictionary of the parameters and pass
it to one of these functions. For more information on the parameters, please
consult the Water Quality Data documentation.
For example, let's find all the stations within a bounding box that have Caffeine data:
from pynhd import WaterQuality

bbox = (-92.8, 44.2, -88.9, 46.0)
kwds = {"characteristicName": "Caffeine"}
wq = WaterQuality()
stations = wq.station_bybbox(bbox, kwds)
Or the same criterion but within a 30-mile radius of a point:
stations = wq.station_bydistance(-92.8, 44.2, 30, kwds)Then we can get the data for all these stations the data like this:
sids = stations.MonitoringLocationIdentifier.tolist()
caff = wq.data_bystation(sids, kwds)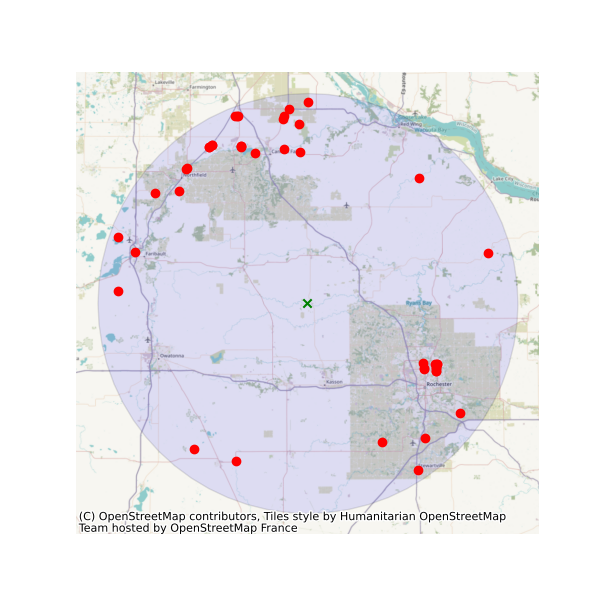
Moreover, we can get land use/land cove data using nlcd_bygeom or nlcd_bycoods functions,
percentages of land cover types using cover_statistics, and overland roughness using
overland_roughness. The nlcd_bycoords function returns a geopandas.GeoDataFrame
with the NLCD layers as columns and input coordinates as the geometry column. Moreover,
the nlcd_bygeom function accepts both a single geometry or a geopandas.GeoDataFrame
as the input.
from pynhd import NLDI

basins = NLDI().get_basins(["01031450", "01318500", "01031510"])
lulc = gh.nlcd_bygeom(basins, 100, years={"cover": [2016, 2019]})
stats = gh.cover_statistics(lulc["01318500"].cover_2016)
roughness = gh.overland_roughness(lulc["01318500"].cover_2019)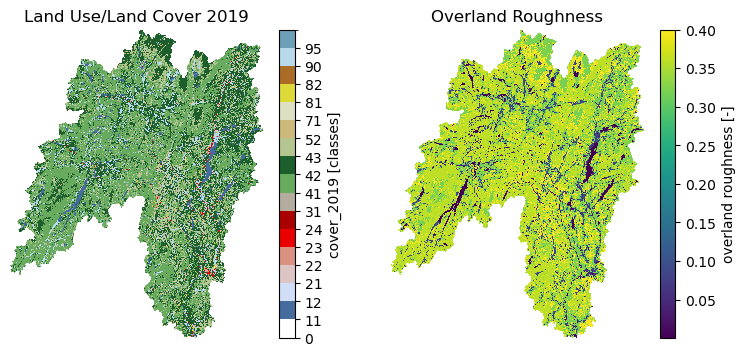
Next, let's use ssebopeta_bygeom to get actual ET data for a basin. Note that there's a
ssebopeta_bycoords function that returns an ETA time series for a single coordinate.
geometry = NLDI().get_basins("01315500").geometry[0]
eta = gh.ssebopeta_bygeom(geometry, dates=("2005-10-01", "2005-10-05"))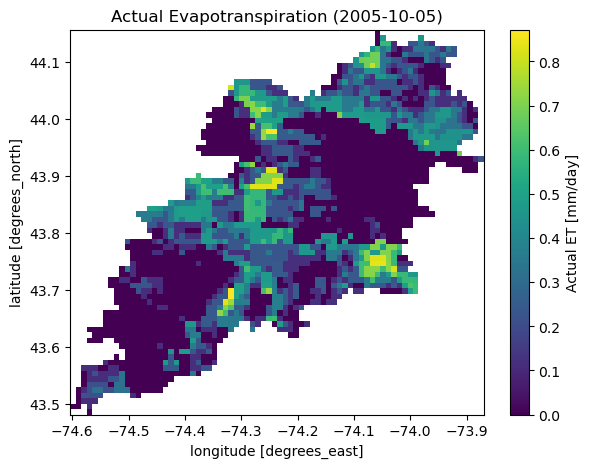
Additionally, we can pull all the US dams data using NID. Let's get dams that are within this
bounding box and have a maximum storage larger than 200 acre-feet.
nid = NID()
dams = nid.get_bygeom((-65.77, 43.07, -69.31, 45.45), "epsg:4326")
dams = nid.inventory_byid(dams.id.to_list())
dams = dams[dams.maxStorage > 200]
We can get also all dams within CONUS in NID with maximum storage larger than 200 acre-feet:
import geopandas as gpd

world = gpd.read_file(gpd.datasets.get_path("naturalearth_lowres"))
conus = world[world.name == "United States of America"].geometry.iloc[0].geoms[0]

dam_list = nid.get_byfilter([{"maxStorage": ["[200 5000]"]}])
dams = dam_list[0][dam_list[0].is_valid]
dams = dams[dams.within(conus)]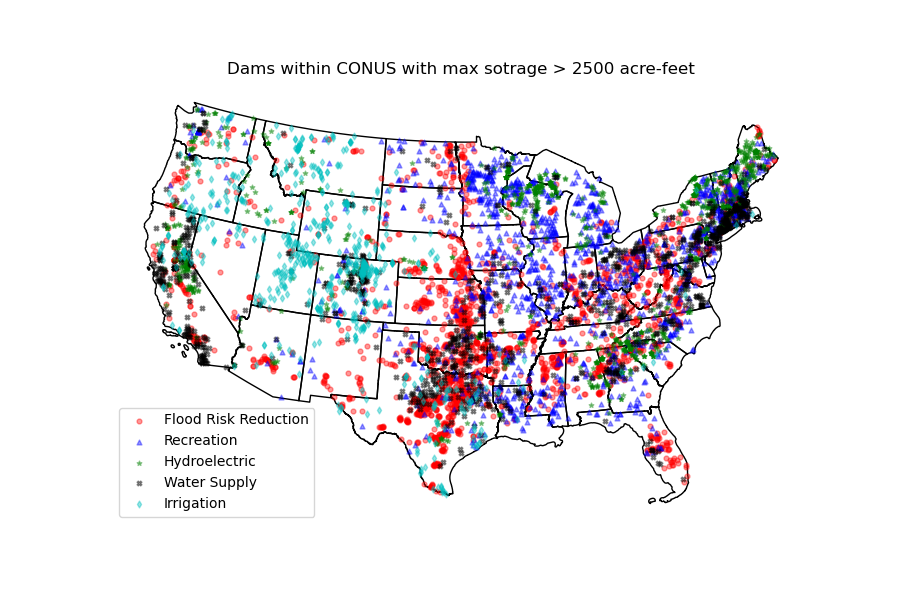
The WBD class allows us to get Hydrologic Unit (HU) polygon boundaries. Let's
get the two Hudson HUC4s:
from pygeohydro import WBD

wbd = WBD("huc4")
hudson = wbd.byids("huc4", ["0202", "0203"])
Contributing
Contributions are very welcomed. Please read CONTRIBUTING.rst file for instructions.
Credits
This package was created based on the audreyr/cookiecutter-pypackage project template.