All Projects → SebastianBocquet → Pygtc

SebastianBocquet / Pygtc

Licence: mit
Make a sweet giant triangle confusogram (GTC) plot

Projects that are alternatives of or similar to Pygtc

Bda py demos
Bayesian Data Analysis demos for Python
Stars: ✭ 781 (+5907.69%)
Mutual labels:  mcmc, jupyter-notebook, bayesian-data-analysis
Dbda Python
Doing Bayesian Data Analysis, 2nd Edition (Kruschke, 2015): Python/PyMC3 code
Stars: ✭ 502 (+3761.54%)
Mutual labels:  mcmc, jupyter-notebook, bayesian-data-analysis
Cookbook 2nd Code
Code of the IPython Cookbook, Second Edition, by Cyrille Rossant, Packt Publishing 2018 [read-only repository]
Stars: ✭ 541 (+4061.54%)
Mutual labels:  jupyter-notebook, data-visualization
Qs ledger
Quantified Self Personal Data Aggregator and Data Analysis
Stars: ✭ 559 (+4200%)
Mutual labels:  jupyter-notebook, data-visualization
Rstan
RStan, the R interface to Stan
Stars: ✭ 760 (+5746.15%)
Mutual labels:  mcmc, bayesian-data-analysis
Bayesian Analysis Recipes
A collection of Bayesian data analysis recipes using PyMC3
Stars: ✭ 479 (+3584.62%)
Mutual labels:  jupyter-notebook, bayesian-data-analysis
Bayesian Stats Modelling Tutorial
How to do Bayesian statistical modelling using numpy and PyMC3
Stars: ✭ 480 (+3592.31%)
Mutual labels:  jupyter-notebook, bayesian-data-analysis
Statistical Rethinking With Python And Pymc3
Python/PyMC3 port of the examples in " Statistical Rethinking A Bayesian Course with Examples in R and Stan" by Richard McElreath
Stars: ✭ 713 (+5384.62%)
Mutual labels:  jupyter-notebook, bayesian-data-analysis
Bap
Bayesian Analysis with Python (Second Edition)
Stars: ✭ 379 (+2815.38%)
Mutual labels:  jupyter-notebook, data-visualization
Facets
Visualizations for machine learning datasets
Stars: ✭ 6,744 (+51776.92%)
Mutual labels:  jupyter-notebook, data-visualization
Visualization Of Global Terrorism Database
📊 Visualization of GTD with py Plotly lib, including amazing graphs and animation 📼
Stars: ✭ 16 (+23.08%)
Mutual labels:  jupyter-notebook, data-visualization
Courses
Quiz & Assignment of Coursera
Stars: ✭ 454 (+3392.31%)
Mutual labels:  jupyter-notebook, data-visualization
Py d3
D3 block magic for Jupyter notebook.
Stars: ✭ 428 (+3192.31%)
Mutual labels:  jupyter-notebook, data-visualization
Datadoubleconfirm
Simple datasets and notebooks for data visualization, statistical analysis and modelling - with write-ups here: http://projectosyo.wix.com/datadoubleconfirm.
Stars: ✭ 24 (+84.62%)
Mutual labels:  jupyter-notebook, data-visualization
Bda r demos
Bayesian Data Analysis demos for R
Stars: ✭ 409 (+3046.15%)
Mutual labels:  mcmc, bayesian-data-analysis
Cookbook 2nd
IPython Cookbook, Second Edition, by Cyrille Rossant, Packt Publishing 2018
Stars: ✭ 704 (+5315.38%)
Mutual labels:  jupyter-notebook, data-visualization
Articles
A repository for the source code, notebooks, data, files, and other assets used in the data science and machine learning articles on LearnDataSci
Stars: ✭ 350 (+2592.31%)
Mutual labels:  jupyter-notebook, data-visualization
Data Science
Collection of useful data science topics along with code and articles
Stars: ✭ 315 (+2323.08%)
Mutual labels:  jupyter-notebook, data-visualization
Boltzmann Machines
Boltzmann Machines in TensorFlow with examples
Stars: ✭ 768 (+5807.69%)
Mutual labels:  mcmc, jupyter-notebook
Bayesian Neural Networks
Pytorch implementations of Bayes By Backprop, MC Dropout, SGLD, the Local Reparametrization Trick, KF-Laplace, SG-HMC and more
Stars: ✭ 900 (+6823.08%)
Mutual labels:  mcmc, jupyter-notebook

pygtc.py

What is a Giant Triangle Confusogram?

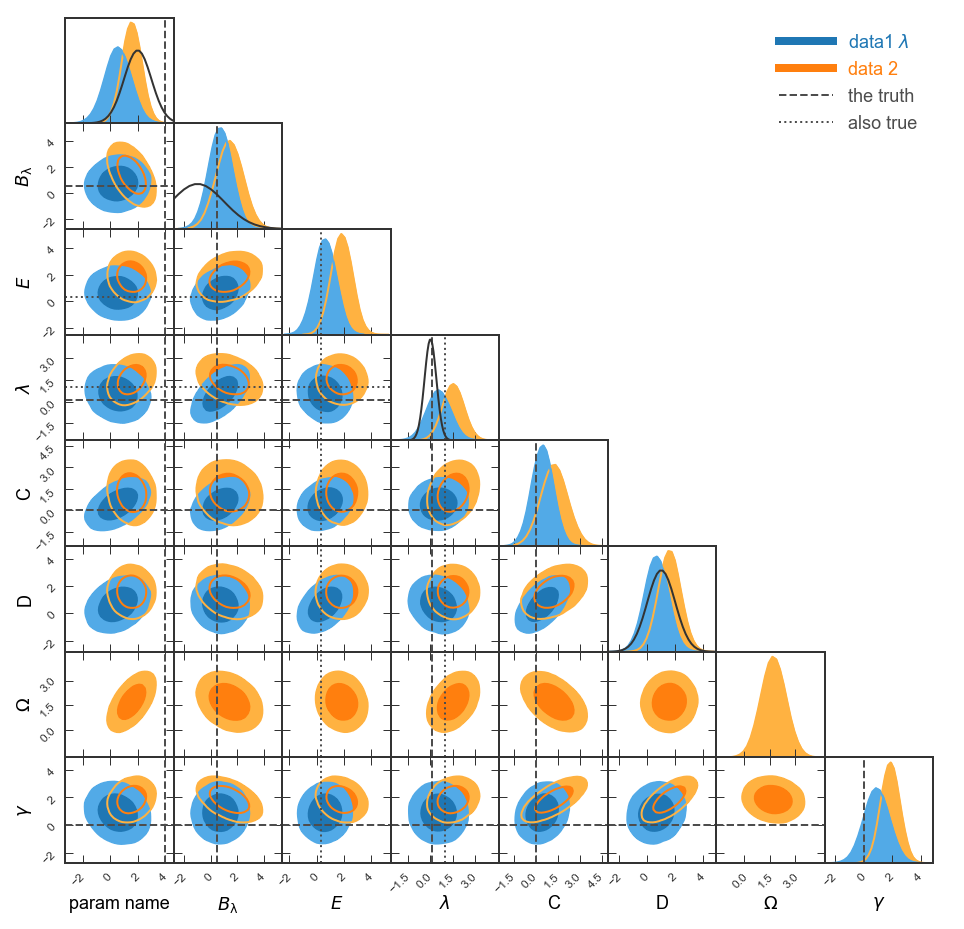
A Giant-Triangle-Confusogram (GTC, aka triangle plot) is a way of displaying the results of a Monte-Carlo Markov Chain (MCMC) sampling or similar analysis. (For a discussion of MCMC analysis, see the excellent emcee package.) The recovered parameter constraints are displayed on a grid in which the diagonal shows the one-dimensional posteriors (and, optionally, priors) and the lower-left triangle shows the pairwise projections. You might want to look at a plot like this if you are fitting a model to data and want to see the parameter covariances along with the priors.

Here's an example of a GTC with some random data and arbitrary labels::

pygtc.plotGTC(chains=[samples1,samples2], paramNames=names, chainLabels=chainLabels, truths=truths, truthLabels=truthLabels, priors=priors, paramRanges=paramRanges, figureSize='MNRAS_page')

.. image:: https://raw.githubusercontent.com/SebastianBocquet/pygtc/master/docs/_static/demo_files/demo_9_1.png

But doesn't this already exist in corner.py, distUtils, etc...?

Although several other packages exists to make such a plot, we were unsatisfied with the amount of extra work required to massage the result into something we were happy to publish. With pygtc, we hope to take that extra legwork out of the equation by providing a package that gives a figure that is publication ready on the first try! You should try all the packages and use the one you like most; for us, that is pygtc!

Installation

For a quick start, you can just use pip. It will install the required dependencies for you (numpy and matplotlib)::

pip install pygtc

For more installation details, see the documentation <http://pygtc.readthedocs.io/>_.

Documentation

Documentation is hosted at ReadTheDocs <http://pygtc.readthedocs.io/>, or check out demo.ipynp <https://github.com/SebastianBocquet/pygtc/blob/master/demo.ipynb>, in this repository, for a working example.

To build your own local copy of the documentation you'll need to install sphinx. Then you can run make html from within the docs folder.

Citation

If you use pygtc to generate plots for a publication, please cite as::

@article{Bocquet2016, doi = {10.21105/joss.00046}, url = {http://dx.doi.org/10.21105/joss.00046}, year = {2016}, month = {oct}, publisher = {The Open Journal}, volume = {1}, number = {6}, author = {Sebastian Bocquet and Faustin W. Carter}, title = {pygtc: beautiful parameter covariance plots (aka. Giant Triangle Confusograms)}, journal = {The Journal of Open Source Software} }

Copyright 2016, Sebastian Bocquet and Faustin W. Carter

.. image:: https://zenodo.org/badge/DOI/10.5281/zenodo.159091.svg :target: https://doi.org/10.5281/zenodo.159091

Note that the project description data, including the texts, logos, images, and/or trademarks, for each open source project belongs to its rightful owner. If you wish to add or remove any projects, please contact us at [email protected].