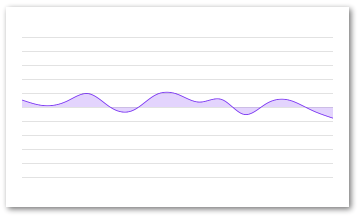
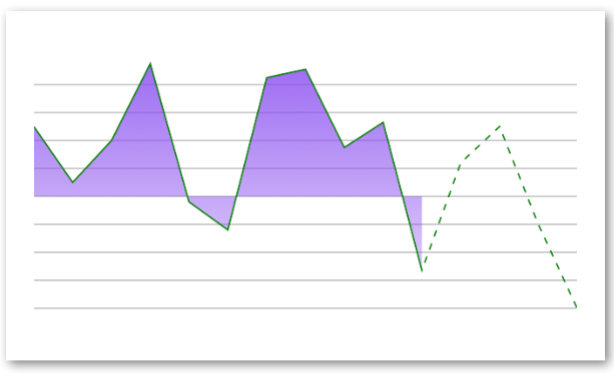
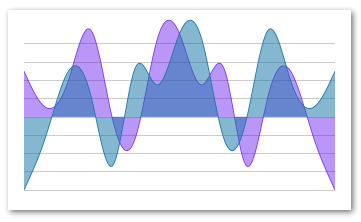
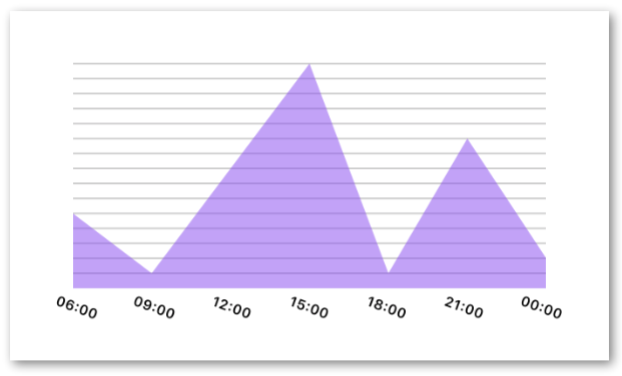
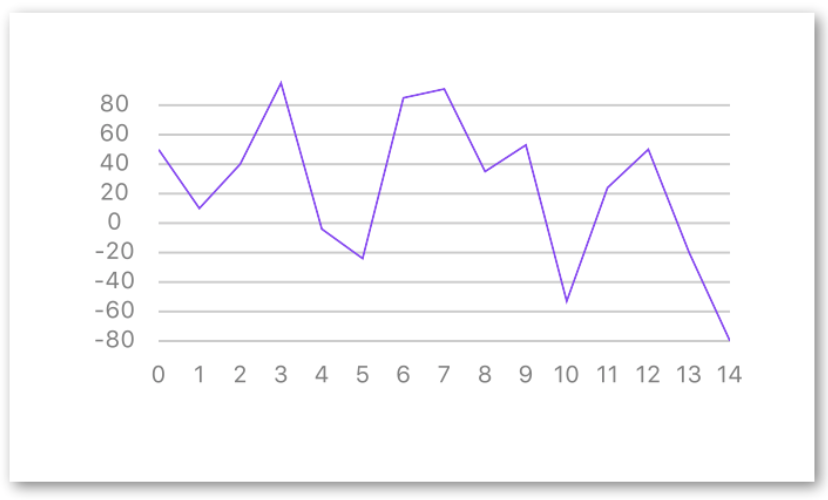
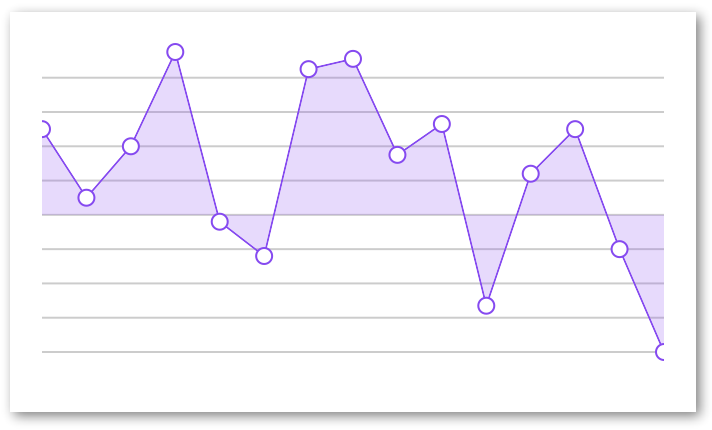
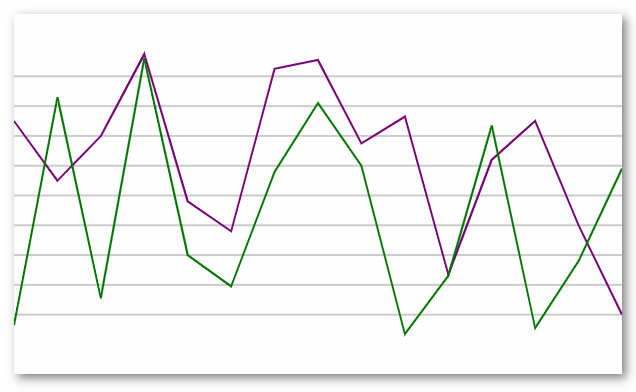
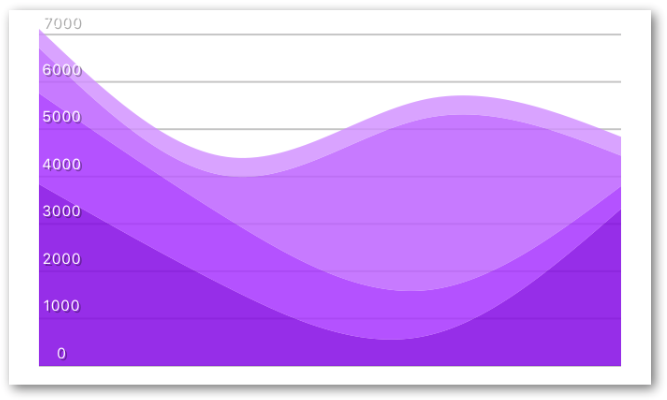
React Native Svg Charts📈 One library to rule all charts for React Native 📊
Stars: ✭ 2,056 (+672.93%)
Mutual labels: svg, charts, d3
RickshawJavaScript toolkit for creating interactive real-time graphs
Stars: ✭ 6,506 (+2345.86%)
Mutual labels: svg, charts, d3
Resonance◾️Resonance | 5kb React animation library
Stars: ✭ 1,011 (+280.08%)
Mutual labels: svg, charts, d3
FineChart-Saikud3.js visualize data for saiku-ui
Stars: ✭ 17 (-93.61%)
Mutual labels: d3, charts
D3tutorial📊📈 A D3 v6 tutorial - interactive bar chart and multiple coordinated views (MCV)
Stars: ✭ 163 (-38.72%)
Mutual labels: svg, d3
Visx🐯 visx | visualization components
Stars: ✭ 14,544 (+5367.67%)
Mutual labels: svg, d3
G2📊 A highly interactive data-driven visualization grammar for statistical charts.
Stars: ✭ 11,020 (+4042.86%)
Mutual labels: svg, charts
datalithSimple, batteries included, components to build beautiful data visualizations
Stars: ✭ 29 (-89.1%)
Mutual labels: d3, charts
dashblocks-templateDashblocks Vue Material Admin Template
Stars: ✭ 143 (-46.24%)
Mutual labels: d3, charts
FloweaverView flow data as Sankey diagrams
Stars: ✭ 266 (+0%)
Mutual labels: svg, d3
reusable-d3-chartsReusable charts built with D3. Built on Web standards, fully customisable.
Stars: ✭ 33 (-87.59%)
Mutual labels: d3, charts
svg-time-seriesSVG time-series charting library
Stars: ✭ 18 (-93.23%)
Mutual labels: d3, charts
silky-chartsA silky smooth D3/React library
Stars: ✭ 38 (-85.71%)
Mutual labels: d3, charts
Vue Tree Chartflexible tree chart using Canvas and Svg, powered by D3.js
Stars: ✭ 149 (-43.98%)
Mutual labels: svg, d3
Laue🖖📈 Modern charts for Vue 2.0
Stars: ✭ 245 (-7.89%)
Mutual labels: svg, charts
EarthjsD3 Earth JS
Stars: ✭ 128 (-51.88%)
Mutual labels: svg, d3
d3-in-angularHow to build reactive charts in Angular 8 using D3
Stars: ✭ 47 (-82.33%)
Mutual labels: d3, charts
visa-chart-componentsVisa Chart Components (VCC) is an accessibility focused, framework agnostic set of data experience design systems components for the web. VCC attempts to provide a toolset to enable developers to build equal data experiences for everyone, everywhere.
Stars: ✭ 81 (-69.55%)
Mutual labels: d3, charts
Vue Crypto DashboardCryptocurrency Dashboard made with Vue
Stars: ✭ 107 (-59.77%)
Mutual labels: svg, charts
Apexcharts.js📊 Interactive JavaScript Charts built on SVG
Stars: ✭ 10,991 (+4031.95%)
Mutual labels: svg, charts


