Seeing Red: PPG Biometrics Using Smartphone Cameras
This repository contains the code for the paper "Seeing Red: PPG Biometrics Using Smartphone Cameras" published in the Proceedings of the IEEE Conference on Computer Vision and Pattern Recognition Workshops (CVPRW) at the 15th IEEE Computer Vision Society Workshop on Biometrics. This work is a collaboration between Giulio Lovisotto, Henry Turner and Simon Eberz from the System Security Lab at University of Oxford.
Idea
In this work we investigated the use of photoplethysmography (PPG) for authentication. An individual's PPG signal can be extracted by taking a video with a smartphone camera as users place their finger on the sensor. The blood flowing through the finger changes the reflective properties of the skin, which is captured by subtle changes in the video color.
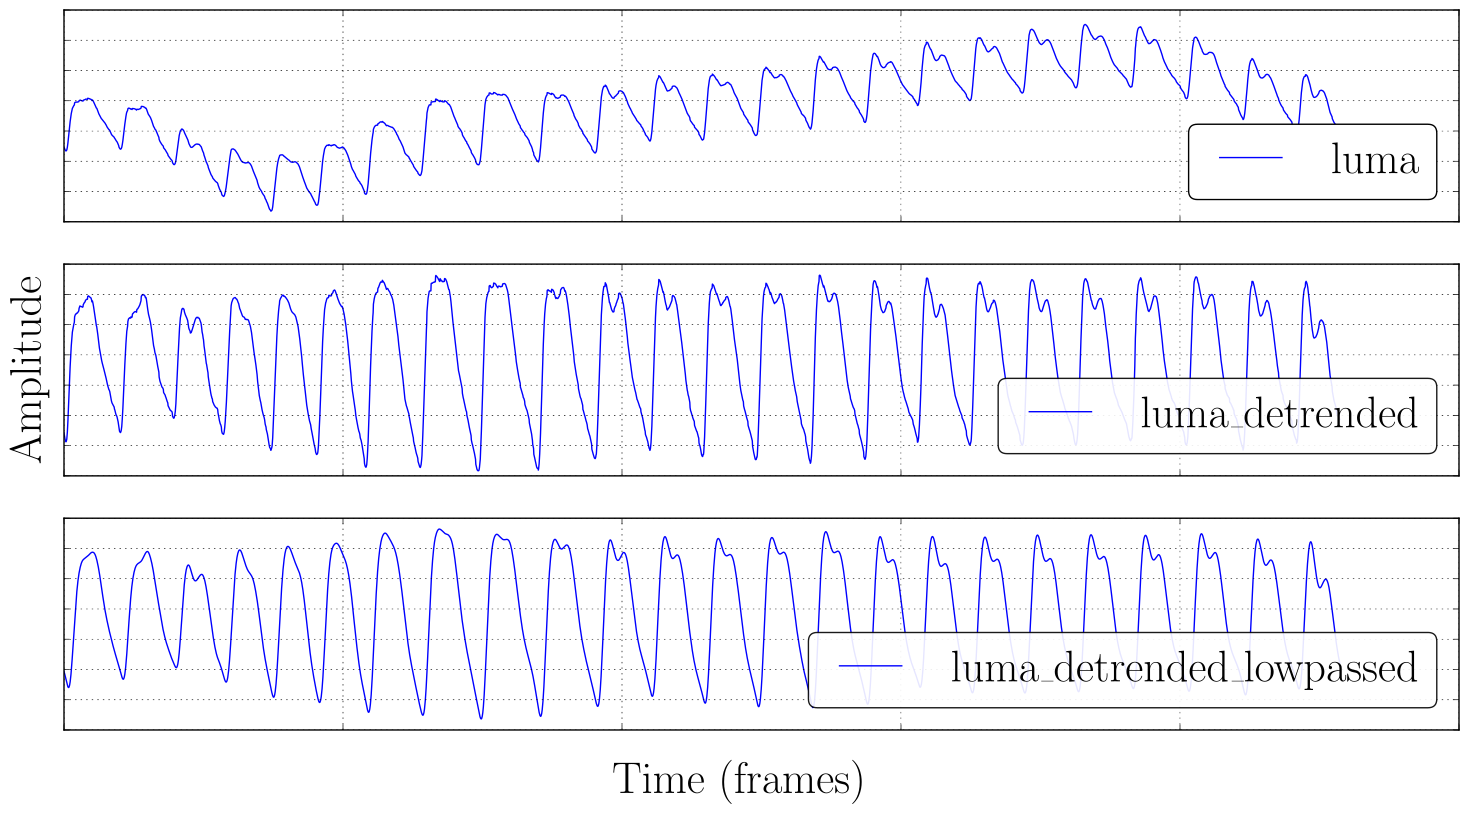
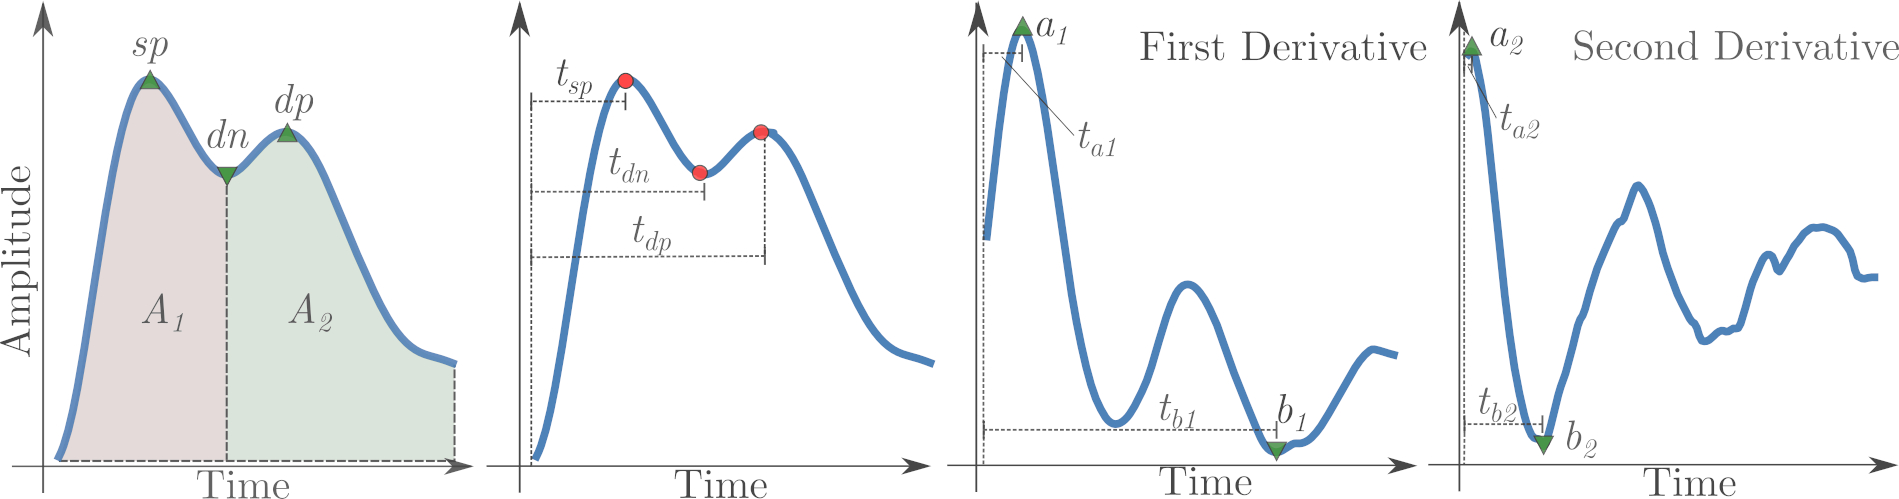
We collected PPG signals from 15 participants over several sessions (6-11), in each session the participant places his finger on the camera while a 30 seconds long video is taken. We extract the raw value of the LUMA component of each video frame to obtain the underlying PPG signal from a video. The signals are then preprocessed with a set of filters to remove trends and high frequency components, and then each individual heartbeat is separated with a custom algorithm.
We designed a set of features that capture the distinctiveness of each individual's PPG signal and we evaluated the authentication performance with a set of experiments (see Reproduce Evaluation).
See the conference presentation slides
Dataset
The dataset used for this paper has been published online on ORA and can be freely downloaded. The dataset contains a set of videos for 14 participants who consented to their data being shared, ethics approval number SSD/CUREC1A CS_C1A_19_032. Each video is a 30 seconds long recording which was taken as the participant kept his index finger on the smartphone camera, see a preview here. The dataset was collected using a custom built app on an iPhone X, the iOS application source code is available in this repository.

Reproduce Evaluation
The code runs inside a Docker container and requires docker and docker-compose to be installed in your system.
You might be able to make this work on a generic python/anaconda environment with some effort.
To reproduce the evaluation, follow these steps:
- read the paper - this is the only way you will understand what you are doing
- Clone this repository
- download the dataset used in the paper, unzip the archive and place the downloaded
videosfolder inseeing-red/data/ - build and start the container by running
docker-compose up -d - attach to the container with
docker attach seeingred_er - in the container,
cd /home/codeand run the entire signal analysis pipeline withpython signal_run_all.py
Results will be produced in several subfolders in seeing-red/data/.
Read EER Results
Resulting Equal Error Rates (EER) are produced by three functions defined in classify.py and saved in subfolders in seeing-red/data/results/<expid>
exp1produces the results used in paper Section 5.1: Multi-class Case, saved indata/results/exp1/all.npyanddata/results/exp1/all-fta.npyexp3produces the results used in paper Section 5.2: One-class Case, saved indata/results/exp3/all.npyanddata/results/exp3/all-fta.npyexp4produces the results used in paper Section 5.3: One-class Cross-Session, saved indata/results/exp4/all.npyanddata/results/exp4/all-fta.npy
NB.: paper Section 5.4: EER User Distribution re-uses the results from exp3 and exp4.
A file results/<expid>/all.npy is a numpy multidimensional array containing EER measurements, each table dimension is described by the descr.json contained in the same folder.
For example, if you load the result file for exp1 and its description file, you can read results this way:
import numpy as np
import json
# load the file
eers = np.load("/home/data/results/exp1/all.npy")
# load the description for the result file
descr = json.load(open("/home/data/results/exp1/descr.json"))

# "header" in descr decribes the dimensions of the eers array
# the number of dimensions of eers should match the length of the header
assert len(descr["header"]) == len(eers.shape)

# ["fold", "clf", "window_size", "user"]
print(descr["header"])
# should be (2, 3, 5, 14) for exp1
print(eers.shape)

# let's print an EER for a specific instance
# select one index across each dimension
fold_index = 0
# one of ["SVM", "GBT", "RFC"]
clf_index = descr["clf"].index("SVM")
# one of [1, 2, 5, 10, 20]
aws_index = descr["window_size"].index(5)
usr_index = 3
print("The EER measured for fold %d, classifier %s, aggregation window size of %d and user %d is %.4f" % (
          fold_index, descr["clf"][clf_index], descr["window_size"][aws_index], usr_index, eers[fold_index, clf_index, aws_index, usr_index]))
In the paper, to get an EER for a (classifier, aggregation window size) pair, we take the average across folds and across users:
## let's take "SVM" and aggregation window size of 5
# load the file
eers = np.load("/home/data/results/exp1/all.npy")
# one of ["SVM", "GBT", "RFC"]
chosen_clf = "SVM"
# one of [1, 2, 5, 10, 20]
chosen_aws = 5
clf_index = descr["clf"].index(chosen_clf)
aws_index = descr["window_size"].index(chosen_aws)
eers = eers[:, clf_index, aws_index, :]
# we average across folds first to produce confidence intervals
eers_mean = eers.mean(axis=0).mean(axis=-1)
eers_std = eers.mean(axis=0).std(axis=-1)
print("The average EER measured for exp1 using %s and aggregation window size of %d is %.4f with standard deviation of %.4f" % (
           chosen_clf, chosen_aws, eers_mean, eers_std))
Citation
If you use this repository please cite the paper as follows:
@INPROCEEDINGS{9150630,
  author={G. {Lovisotto} and H. {Turner} and S. {Eberz} and I. {Martinovic}},
  booktitle={2020 IEEE/CVF Conference on Computer Vision and Pattern Recognition Workshops (CVPRW)},
  title={Seeing Red: PPG Biometrics Using Smartphone Cameras},
  year={2020},
  volume={},
  number={},
  pages={3565-3574},
  doi={10.1109/CVPRW50498.2020.00417}}
Contributors
Acknowledgements
This work was generously supported by a grant from Mastercard and by the Engineering and Physical Sciences Research Council [grant numbers EP/N509711/1, EP/P00881X/1].