All Projects → VIDA-NYU → shadow-accrual-maps

VIDA-NYU / shadow-accrual-maps

Licence: other
Accumulated shadow data computed for New York City

Programming Languages

python
139335 projects - #7 most used programming language

Projects that are alternatives of or similar to shadow-accrual-maps

Osmnx
OSMnx: Python for street networks. Retrieve, model, analyze, and visualize street networks and other spatial data from OpenStreetMap.
Stars: ✭ 3,357 (+22280%)
Mutual labels:  gis, urban-planning, spatial-analysis, geography
urban-pulse
A standalone version of Urban Pulse
Stars: ✭ 49 (+226.67%)
Mutual labels:  urban-planning, new-york-university, nyu
python-for-gis-progression-path
Progression path for a GIS analyst who wants to become proficient in using Python for GIS: from apprentice to guru
Stars: ✭ 98 (+553.33%)
Mutual labels:  gis, spatial-analysis, geography
rafagas
Daily geospatial links curated by Raf Roset
Stars: ✭ 17 (+13.33%)
Mutual labels:  gis, urban-planning, geography
Awesome Gis
😎Awesome GIS is a collection of geospatial related sources, including cartographic tools, geoanalysis tools, developer tools, data, conference & communities, news, massive open online course, some amazing map sites, and more.
Stars: ✭ 2,582 (+17113.33%)
Mutual labels:  gis, spatial-analysis
Geostats
A tiny and standalone javascript library for classification and basic statistics :
Stars: ✭ 183 (+1120%)
Mutual labels:  gis, geography
kdtree
A pure Nim k-d tree implementation for efficient spatial querying of point data
Stars: ✭ 40 (+166.67%)
Mutual labels:  gis, spatial-analysis
geospark
bring sf to spark in production
Stars: ✭ 53 (+253.33%)
Mutual labels:  gis, spatial-analysis
Landsat8 scene calculator
Creates NDVI, SAVI, RBG, NIR, short wave infrared, agriculture, geology, and bathymetric GeoTIFF files using Landsat8 imagery.
Stars: ✭ 37 (+146.67%)
Mutual labels:  gis, spatial-analysis
rsgislib
Remote Sensing and GIS Software Library; python module tools for processing spatial data.
Stars: ✭ 103 (+586.67%)
Mutual labels:  gis, spatial-analysis
spatial efd
A spatial aware implementation of elliptical Fourier analysis
Stars: ✭ 19 (+26.67%)
Mutual labels:  gis, spatial-analysis
bikenwgrowth
Source code for the paper "Growing urban bicycle networks", exploring algorithmically the limitations of urban bicycle network growth
Stars: ✭ 39 (+160%)
Mutual labels:  gis, urban-planning
Peartree
peartree: A library for converting transit data into a directed graph for sketch network analysis.
Stars: ✭ 116 (+673.33%)
Mutual labels:  gis, spatial-analysis
Urbansprawl
Open framework for calculating spatial urban sprawl indices and performing disaggregated population estimates using open data
Stars: ✭ 48 (+220%)
Mutual labels:  gis, spatial-analysis
gis4wrf
QGIS toolkit 🧰 for pre- and post-processing 🔨, visualizing 🔍, and running simulations 💻 in the Weather Research and Forecasting (WRF) model 🌀
Stars: ✭ 137 (+813.33%)
Mutual labels:  gis, urban-planning
Geoserver
geoserver is a Go library for manipulating a GeoServer instance via the GeoServer REST API.
Stars: ✭ 48 (+220%)
Mutual labels:  gis, geography
geog595
Humanistic GIS @ UW-Seattle
Stars: ✭ 33 (+120%)
Mutual labels:  gis, geography
Geography for hackers
Geography for Hackers - Teaching all how to hack geography, use GIS, and think spatially
Stars: ✭ 25 (+66.67%)
Mutual labels:  gis, geography
topo
A Geometry library for Elixir that calculates spatial relationships between two geometries
Stars: ✭ 125 (+733.33%)
Mutual labels:  gis, spatial-analysis
Microsoft.SqlServer.Types
a .NET Standard implementation of the spatial types in `Microsoft.SqlServer.Types`
Stars: ✭ 64 (+326.67%)
Mutual labels:  gis, geography

Shadow Accrual Maps

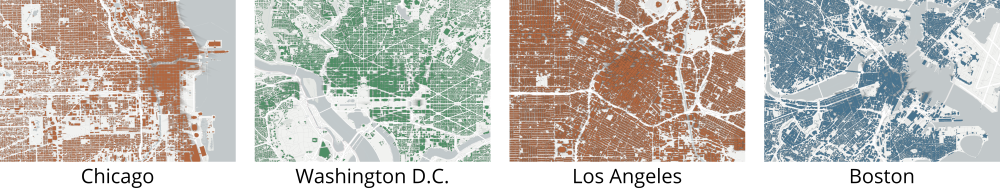
5/12/2020: New shadow data for Chicago, Los Angeles, Washington D.C. and Boston, see below.

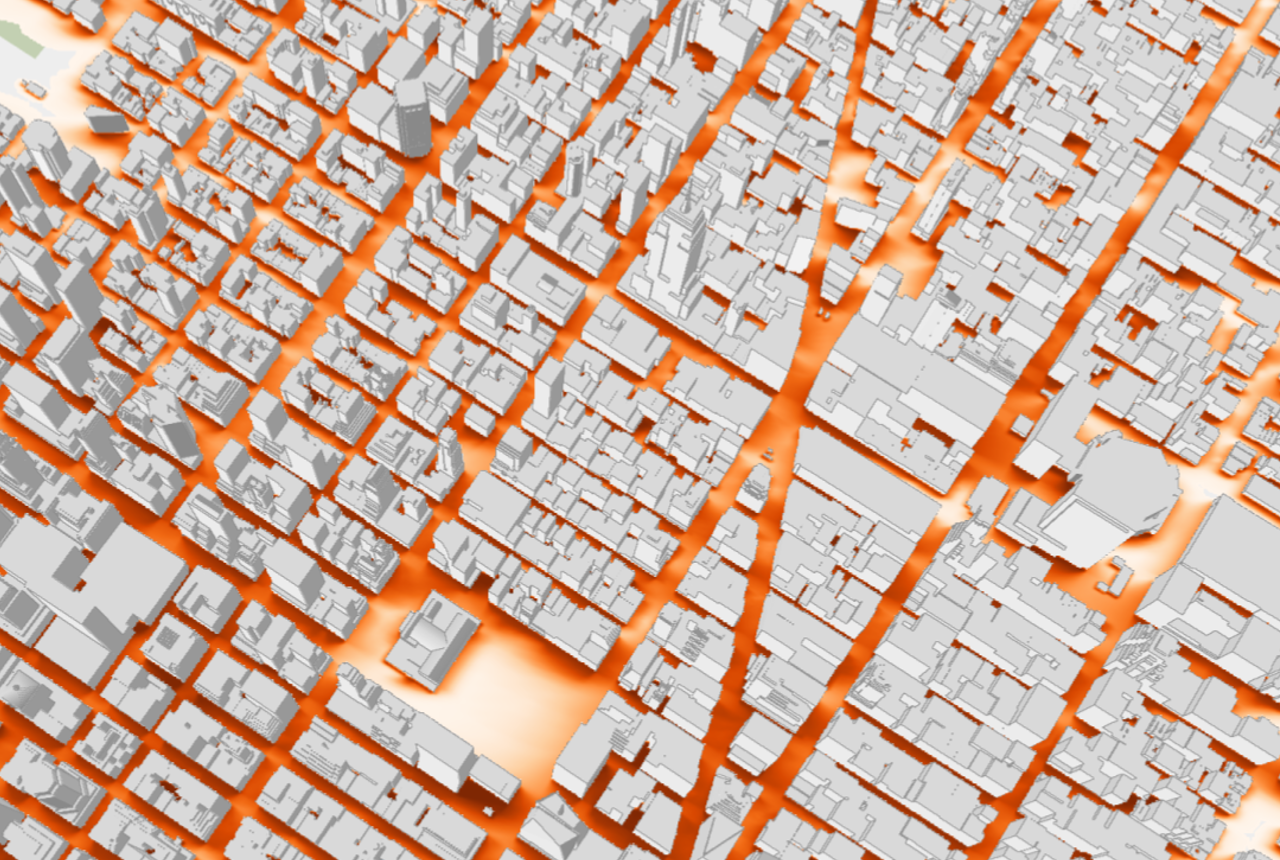
Large-scale shadows from buildings in a city play an important role in determining the environmental quality of public spaces. They can be both beneficial, such as for pedestrians during summer, and detrimental, by impacting vegetation and by blocking direct sunlight. Determining the effects of shadows requires the accumulation of shadows over time across different periods in a year. In our paper Shadow Accrual Maps: Efficient Accumulation of City-Scale Shadows over Time, we present a simple yet efficient class of approach that uses the properties of sun movement to track the changing position of shadows within a fixed time interval. This repository presents the computed shadow information for New York City, Chicago, Los Angeles, Washington D.C., Boston and a script for retrieving the data.

The technique was first presented in the paper:

Shadow Accrual Maps: Efficient Accumulation of City-Scale Shadows over Time
Fabio Miranda, Harish Doraiswamy, Marcos Lage, Luc Wilson, Mondrian Hsieh, Claudio T. Silva
IEEE Transactions on Visualization and Computer Graphics, vol. 25, no. 3, pp. 1559-1574, Mar 2019

Citation:

@ARTICLE{8283638,
author={F. Miranda and H. Doraiswamy and M. Lage and L. Wilson and M. Hsieh and C. T. Silva},
journal={IEEE Transactions on Visualization and Computer Graphics},
title={Shadow Accrual Maps: Efficient Accumulation of City-Scale Shadows Over Time},
year={2019},
volume={25},
number={3},
pages={1559-1574},
keywords={Urban areas;Ray tracing;Buildings;Visual analytics;Sun;Tools;Shadow accumulation;shadow accrual maps;visual analysis;urban development},
doi={10.1109/TVCG.2018.2802945},
ISSN={1077-2626},
month={March}}

Shadow Accrual Maps has been feature on The New York Times, together with an interactive visualization of the accumulated shadows in New York City. It has also been feature on GeoAwesomeness, Technical.ly, among others.

A video is available here.

Shadow accrual map example

Shadow Accumulation Data

Shadow example

The shadow accumulation data can be downloaded through Open Science Framework here, or visualized here. We have made available data for:

The accumulated shadows were computed for three days of the year: June 21 (summer solstice), September 22 (autumnal equinox) and December 21 (winter solstice). Shadows can be greatly distorted when they are near the horizon, so all the shadows in the model are estimated from one and a half hours after sunrise to one and a half hours before sunset.

Each tar.gz or zip file contains a folder structure following the slippy tiles hierarchy (see here), with both png and binary files; the png files can be visualized over any map that uses slippy tiles (e.g., Google Maps, OpenStreetMap). The binary files contain the raw accumulation values for the considered time ranges. We provide a python script to facilitate the retrieval of shadow values, given a lat/lon as an input. For example:

python shadow.py --lat 40.749785 --lon -73.987774 --path ./slippy-nyc-dec-21
Note that the project description data, including the texts, logos, images, and/or trademarks, for each open source project belongs to its rightful owner. If you wish to add or remove any projects, please contact us at [email protected].