SuperQ / Smokeping_prober
Licence: apache-2.0
Prometheus style smokeping
Stars: ✭ 212
Programming Languages
go
31211 projects - #10 most used programming language
Projects that are alternatives of or similar to Smokeping prober
Hastic Server
Hastic data management server for analyzing patterns and anomalies from Grafana
Stars: ✭ 292 (+37.74%)
Mutual labels: prometheus, monitoring-tool
Openitcockpit
openITCOCKPIT is an Open Source system monitoring tool built for different monitoring engines like Nagios, Naemon and Prometheus.
Stars: ✭ 108 (-49.06%)
Mutual labels: prometheus, monitoring-tool
Prometheus Es Exporter
Prometheus Elasticsearch Exporter
Stars: ✭ 184 (-13.21%)
Mutual labels: prometheus
Myperf4j
High performance Java APM. Powered by ASM. Try it. Test it. If you feel its better, use it.
Stars: ✭ 2,281 (+975.94%)
Mutual labels: monitoring-tool
K8s Gitops
GitOps principles to define kubernetes cluster state via code. Community around [email protected] is on discord: https://discord.gg/7PbmHRK
Stars: ✭ 192 (-9.43%)
Mutual labels: prometheus
Microservice Scaffold
基于Spring Cloud(Greenwich.SR2)搭建的微服务脚手架(适用于在线系统),已集成注册中心(Nacos Config)、配置中心(Nacos Discovery)、认证授权(Oauth 2 + JWT)、日志处理(ELK + Kafka)、限流熔断(AliBaba Sentinel)、应用指标监控(Prometheus + Grafana)、调用链监控(Pinpoint)、以及Spring Boot Admin。
Stars: ✭ 211 (-0.47%)
Mutual labels: prometheus
Scouter Paper
scouter-paper is a web client software for scouter
Stars: ✭ 183 (-13.68%)
Mutual labels: monitoring-tool
Meter
Laravel package to find performance bottlenecks in your laravel application.
Stars: ✭ 204 (-3.77%)
Mutual labels: monitoring-tool
Nxplorerjs Microservice Starter
Node JS , Typescript , Express based reactive microservice starter project for REST and GraphQL APIs
Stars: ✭ 193 (-8.96%)
Mutual labels: prometheus
Wgcloud
linux运维监控工具,支持系统信息,内存,cpu,温度,磁盘空间及IO,硬盘smart,系统负载,网络流量等监控,API接口,大屏展示,拓扑图,进程监控,端口监控,docker监控,文件防篡改,日志监控,数据可视化,web ssh,堡垒机,指令下发批量执行,linux面板,探针,故障告警
Stars: ✭ 2,669 (+1158.96%)
Mutual labels: prometheus
Exporter exporter
A reverse proxy designed for Prometheus exporters
Stars: ✭ 194 (-8.49%)
Mutual labels: prometheus
Awesome Prometheus Alerts
🚨 Collection of Prometheus alerting rules
Stars: ✭ 3,323 (+1467.45%)
Mutual labels: prometheus
Satellite
Simple and extensible monitoring agent / library for Kubernetes: https://gravitational.com/blog/monitoring_kubernetes_satellite/
Stars: ✭ 183 (-13.68%)
Mutual labels: monitoring-tool
K8s Deployment Strategies
Kubernetes deployment strategies explained
Stars: ✭ 2,649 (+1149.53%)
Mutual labels: prometheus
Clickhouse exporter
This is a simple server that periodically scrapes ClickHouse stats and exports them via HTTP for Prometheus(https://prometheus.io/) consumption.
Stars: ✭ 193 (-8.96%)
Mutual labels: prometheus
smokeping_prober
Prometheus style "smokeping" prober.
Overview
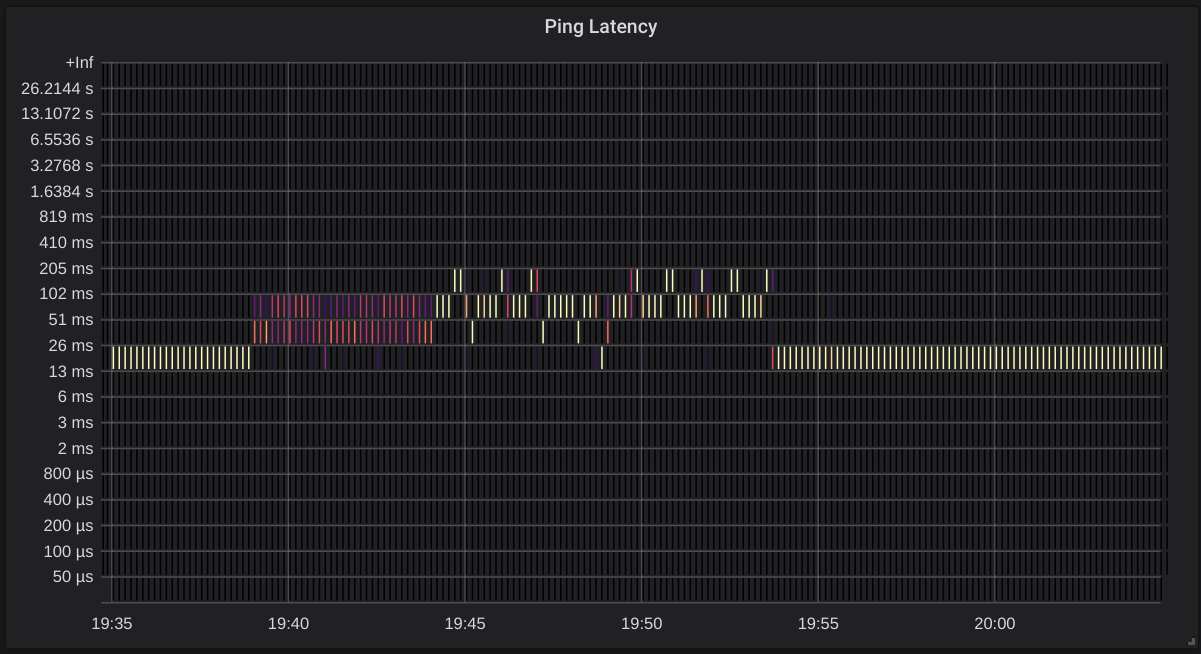
This prober sends a series of ICMP (or UDP) pings to a target and records the responses in Prometheus histogram metrics.
usage: smokeping_prober [<flags>] <hosts>...

Flags:
  -h, --help              Show context-sensitive help (also try --help-long and --help-man).
      --web.listen-address=":9374"
                          Address on which to expose metrics and web interface.
      --web.telemetry-path="/metrics"
                          Path under which to expose metrics.
      --buckets=BUCKETS   A comma delimited list of buckets to use
  -i, --ping.interval=1s  Ping interval duration
      --privileged        Run in privileged ICMP mode
      --log.level="info"  Only log messages with the given severity or above. Valid levels: [debug, info, warn,
                          error, fatal]
      --log.format="logger:stderr"
                          Set the log target and format. Example: "logger:syslog?appname=bob&local=7" or
                          "logger:stdout?json=true"
      --version           Show application version.

Args:
  <hosts>  List of hosts to ping
Building and running
Requires Go >= 1.11
go get github.com/superq/smokeping_prober
sudo setcap cap_net_raw=+ep ${GOPATH}/bin/smokeping_prober
Metrics
| Metric Name | Type | Description |
|---|---|---|
| smokeping_requests_total | Counter | Counter of pings sent. |
| smokeping_response_duration_seconds | Histogram | Ping response duration. |
Note that the project description data, including the texts, logos, images, and/or trademarks,
for each open source project belongs to its rightful owner.
If you wish to add or remove any projects, please contact us at [email protected].

