calebj0seph / Spectro
Programming Languages
Labels
Projects that are alternatives of or similar to Spectro
🎶 Spectro
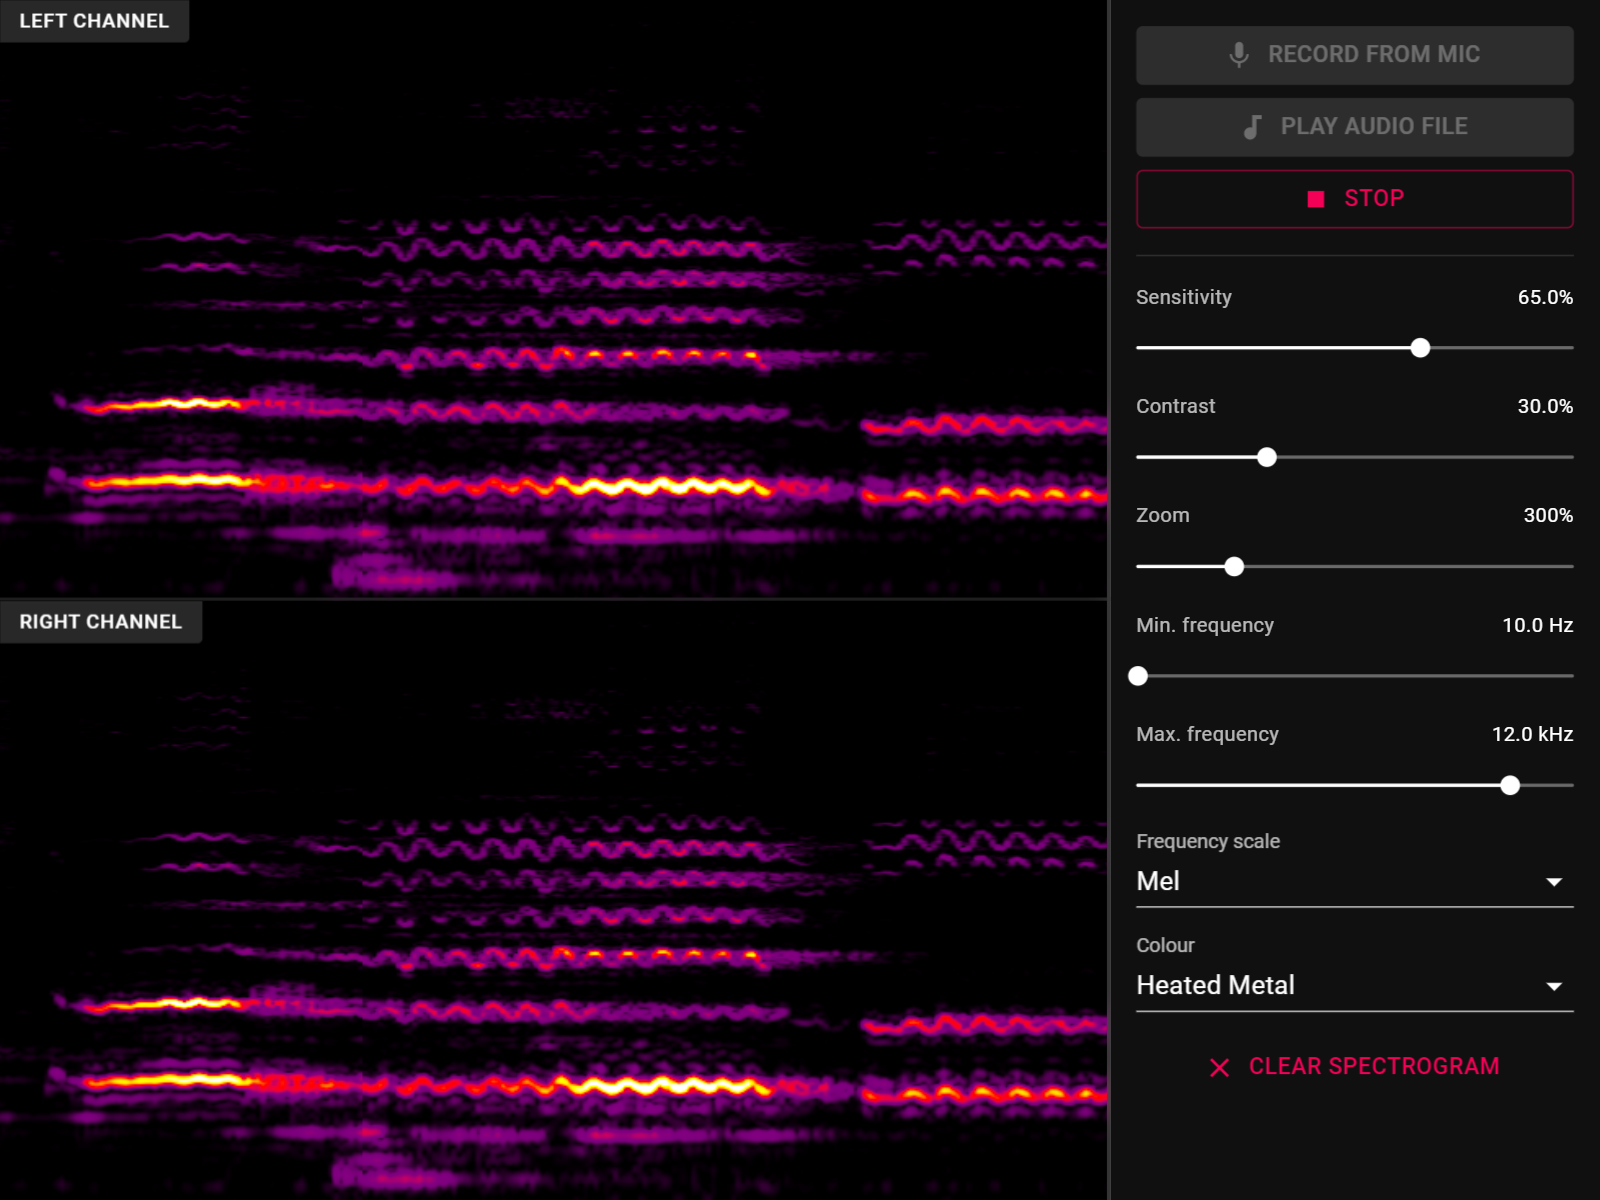
Spectro is a real-time audio spectrogram generator for the web. It can visualise sound from your microphone or audio files on your device.
💻 Usage
Head here to start using Spectro.
To start generating a spectrogram, you can either:
-
Click the 🎤 Record from mic button to start generating a spectrogram from your microphone.
If you want to record audio from your device's audio output, you can enable 'Stereo Mix' on Windows or use BlackHole on macOS and then set this device as your browser's default input device.
-
Click the 🎵 Play audio file button to start generating a spectrogram from an audio file on your device. This will also play the selected audio file.
Any audio format supported by your browser can be played.
The spectrogram generates from right to left, with the most recent audio appearing on the right and oldest on the left.
There are also ⚙ Options available to control the appearance of the spectrogram:
- 🔊 Sensitivity controls how sensitive the spectrogram is to the audio. Changing it has the same effect as changing the volume of the audio.
- 🌗 Contrast applies logarithmic scaling to the spectrogram to add contrast to the image. Changing it can help produce a better image depending on the audio being analysed.
- 🔍 Zoom controls how zoomed in the spectrogram appears along the time axis.
- 📈 Min. and max. frequency control the range of frequencies to display on the spectrogram. Lower frequencies appear at the bottom of the spectrogram, and higher frequencies at the top.
- 🎹 Frequency scale controls the scaling to apply to the frequency axis of the spectrogram. 'Linear' means all frequencies are represented evenly, while 'Mel' gives a more natural appearance by giving more weight to lower frequencies.
- 🌈 Colour controls the colour scheme to display the spectrogram with.
You can click the ⏹ Stop button to stop generating the spectrogram. If playing an audio file, the spectrogram will automatically stop at the end of the track.
❓ FAQ
What is a spectrogram?
A spectrogram is an image produced from sound. It visualises the frequencies present in sound over time, with time represented along the horizontal axis, frequency along the vertical axis, and the loudness of the frequency by colour.
For example if you were to generate a spectrogram of yourself whistling, you would see a bright line at the pitch of the whistle.
What browsers does Spectro work with?
The latest versions of Chrome, Firefox and Safari all work with Spectro. Any other Chromium based browser like the new version of Microsoft Edge should also work.
How does Spectro work?
Here's a blog post describing it all! A quick overview:
- The audio input is broken into frames of 4096 samples, which are overlapped every 1024 samples. I chose 4096 as my window size as it seemed to be the best trade-off between time and frequency resolution – eventually I might make it configurable.
- These overlapping frames are then windowed using a seven-term Blackman-Harris function, which I decided on as it seemed to give the most visual clarity.
- The windows are then run through a Fast Fourier transform (using jsfft) in a dedicated web worker, and the norm of each frequency bin is taken as the basis of the spectrogram.
- This raw spectrogram data is then inserted into a circular queue, which has capacity equal to the width of the spectrogram image.
- The raw spectrogram data is then rendered to the screen with WebGL, using a shader to quickly perform all of the scaling, colourisation and other image adjustments directly on the GPU. Only new raw spectrogram data is uploaded to the GPU each frame to improve performance instead of doing a full upload.
- The settings panel uses React and Material-UI (which accounts for most of the bundle size 😞).
👩💻 Development
Install dependencies:
npm install
Start webpack-dev-server:
npm start
Build a production bundle:
npm run build
Perform Typescript type checking:
npm run type-check
📘 Licence
Spectro is released under the terms of the MIT Licence.

