acouvreur / Ssh Log To Influx
Licence: gpl-3.0
Send SSH authentication logs to influxdb with geohashing IP
Stars: ✭ 49
Programming Languages
javascript
184084 projects - #8 most used programming language
Projects that are alternatives of or similar to Ssh Log To Influx
Solarthing
Monitors an Outback MATE and a Renogy Rover - MPPT Charge Controller. Integrates with Grafana, PVOutput and more!
Stars: ✭ 33 (-32.65%)
Mutual labels: influxdb, grafana
Victoriametrics
VictoriaMetrics: fast, cost-effective monitoring solution and time series database
Stars: ✭ 5,558 (+11242.86%)
Mutual labels: influxdb, grafana
Docker Statsd Influxdb Grafana
Docker Image with Telegraf (StatsD), InfluxDB and Grafana
Stars: ✭ 352 (+618.37%)
Mutual labels: influxdb, grafana
Questdb
An open source SQL database designed to process time series data, faster
Stars: ✭ 7,544 (+15295.92%)
Mutual labels: grafana, influxdb
Varken
Standalone application to aggregate data from the Plex ecosystem into InfluxDB using Grafana for a frontend
Stars: ✭ 829 (+1591.84%)
Mutual labels: influxdb, grafana
Performance Testing Framework
Framework allows to perform load testing with Apache Jmeter, view application/server metrics in real-time with Grafana, analyze errors cause with detailed traces for failed requests, compare different test runs in scripted dashboard and perform frontend performance testing with sitespeed.io+webpagetest
Stars: ✭ 275 (+461.22%)
Mutual labels: influxdb, grafana
Pgwatch2
PostgreSQL metrics monitor/dashboard
Stars: ✭ 960 (+1859.18%)
Mutual labels: influxdb, grafana
cv4pve-metrics
Metrics for Proxmox VE, Grafana with dasboard, InfluxDb
Stars: ✭ 38 (-22.45%)
Mutual labels: influxdb, grafana
Onboarding
A list of resources we at flyeralarm use to get new developers up and running
Stars: ✭ 648 (+1222.45%)
Mutual labels: influxdb, grafana
Monitoring
Monitor ESXi, Synology, Docker, PiHole and Raspberry Pi and Windows using Grafana, InfluxDB and Telegraf
Stars: ✭ 493 (+906.12%)
Mutual labels: influxdb, grafana
MinerDashboards
Metric scrapers, InfluxDB queries, and Grafana dashboards for crypto miners. (XMRig, XMRig-proxy, GMiner, MoneroOcean, Belkin WeMo, Telegraf, CoreTemp, CoinMarketCap, Monero Wallet RCP)
Stars: ✭ 13 (-73.47%)
Mutual labels: influxdb, grafana
Unifiedmetrics
Fully-featured metrics collection agent for Minecraft servers. Supports Prometheus and InfluxDB. Dashboard included out-of-box.
Stars: ✭ 29 (-40.82%)
Mutual labels: influxdb, grafana
yanic
Yet another node info collector - for respondd to be used with meshviewer to Grafana (with influxdb or graphite)
Stars: ✭ 22 (-55.1%)
Mutual labels: influxdb, grafana
Hastic Server
Hastic data management server for analyzing patterns and anomalies from Grafana
Stars: ✭ 292 (+495.92%)
Mutual labels: influxdb, grafana
luftdatenpumpe
Process live and historical data from luftdaten.info, IRCELINE and OpenAQ. Filter by station-id, sensor-id and sensor-type, apply reverse geocoding, store into timeseries and RDBMS databases, publish to MQTT, output as JSON or visualize in Grafana.
Stars: ✭ 22 (-55.1%)
Mutual labels: influxdb, grafana
Awesome Monitoring
INFRASTRUCTURE、OPERATION SYSTEM and APPLICATION monitoring tools for Operations.
Stars: ✭ 356 (+626.53%)
Mutual labels: influxdb, grafana
ruuvitag-demo
Demo of reading Bluetooth Low Energy sensor measurements of RuuviTag environmental sensors and feeding them to MQTT, a database and dashboards
Stars: ✭ 14 (-71.43%)
Mutual labels: influxdb, grafana
Wizzy
Manage & automate Grafana with easy wizzy
Stars: ✭ 461 (+840.82%)
Mutual labels: influxdb, grafana
Docker Compose Grafana Influxdb
Demonstration scripts for running Grafana with InfluxDB as datasource.
Stars: ✭ 29 (-40.82%)
Mutual labels: influxdb, grafana
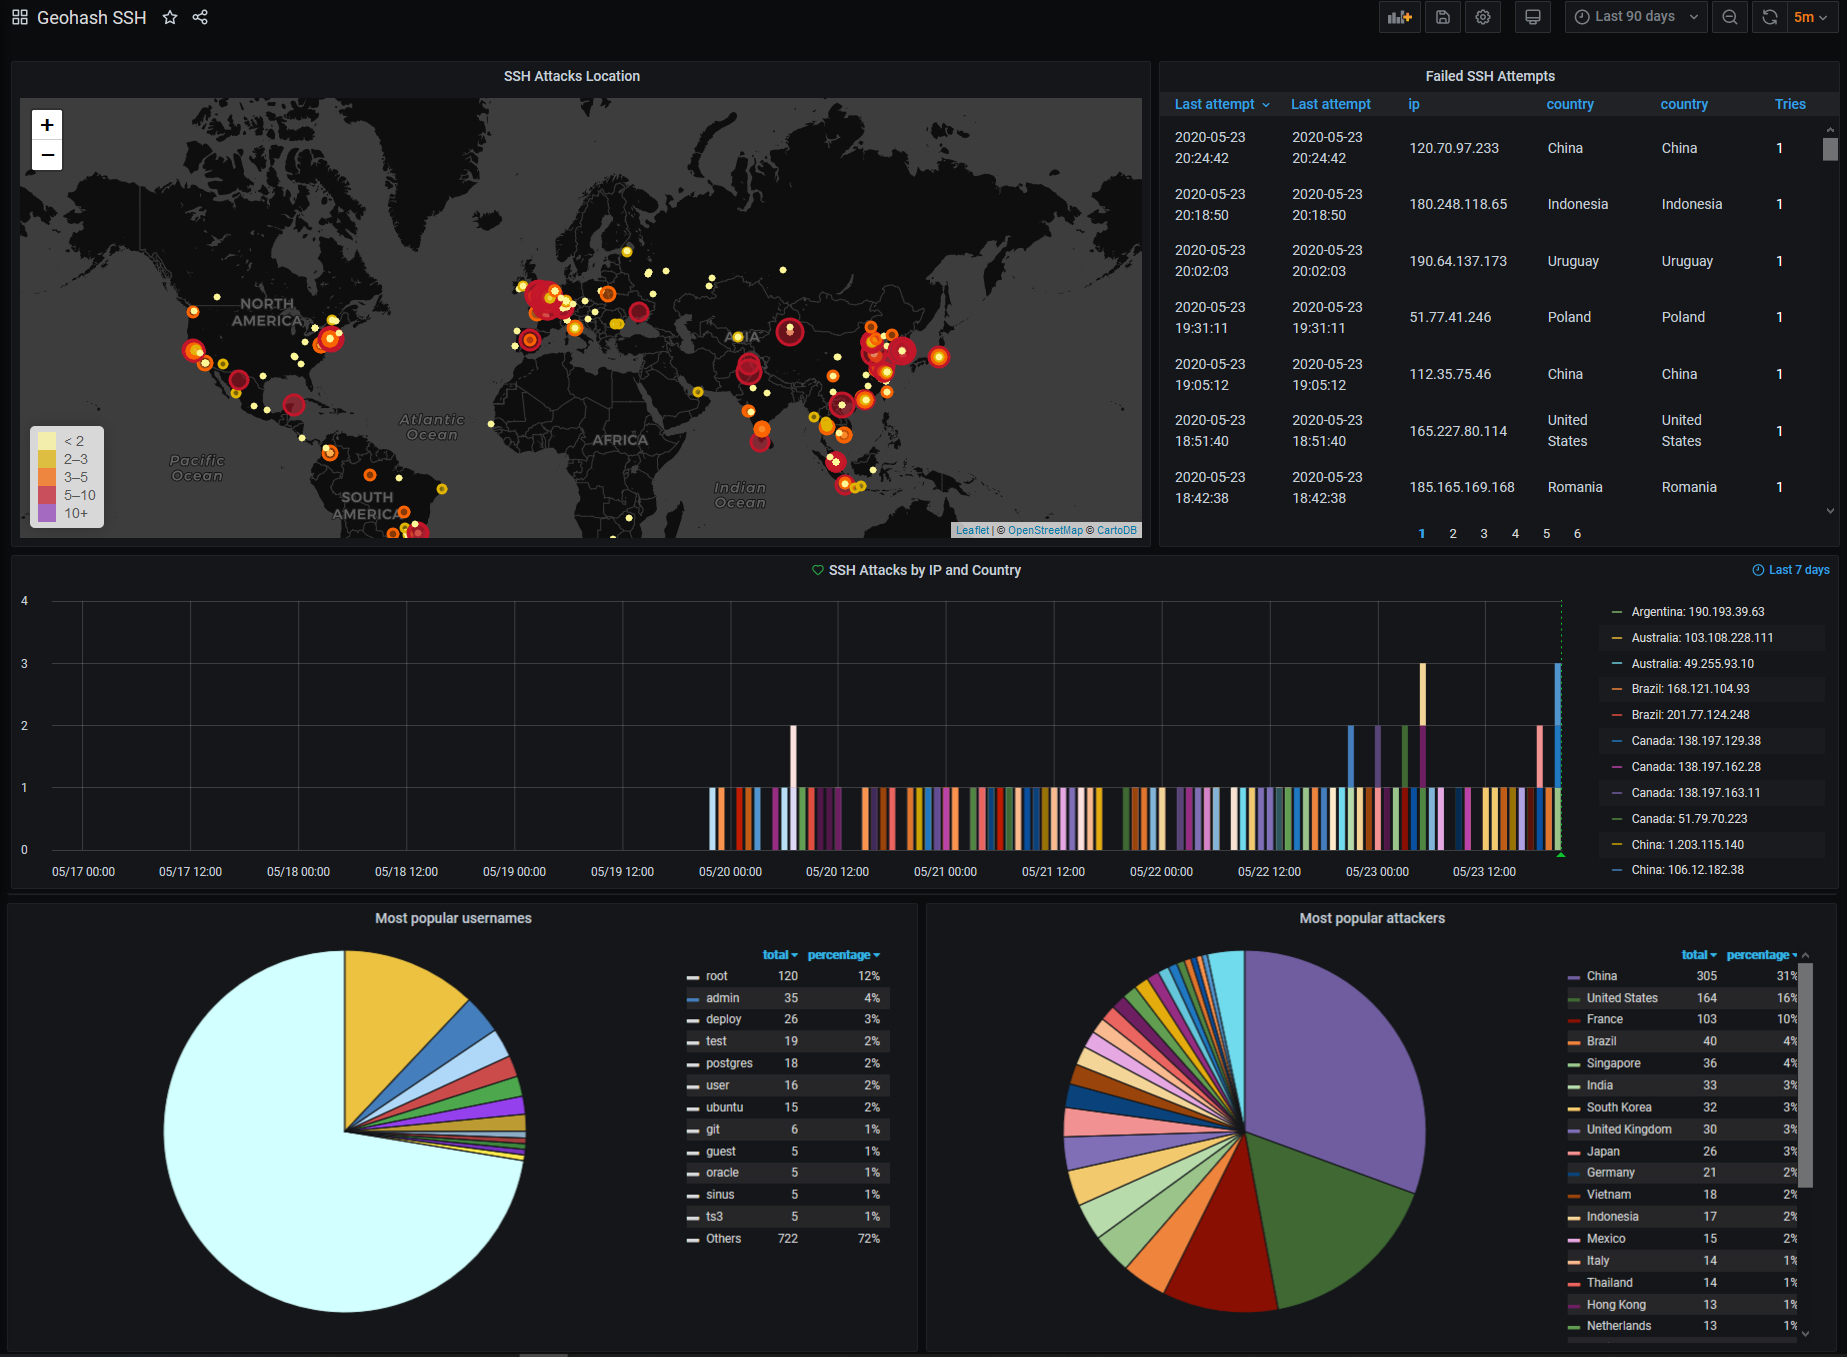
Visualize bruteforce SSH attacker's location in real time
Multiarch supported linux/amd64,linux/arm/v7,linux/arm64 for Raspberry Pis 😄
Thanks to Schkn for its original post https://devconnected.com/geolocating-ssh-hackers-in-real-time/
Preview
Grafana dashboard id : 12323
docker run -e INFLUX_HOST=myinfluxdb.com -e INFLUX_DB=geoloc -p 7070:7070 acouvreur/ssh-log-to-influx
Prerequisites
- Docker
- Rsyslog
- An InfluxDB instance (or use docker-compose.standalone.yml)
- A Grafana instance (or use docker-compose.standalone.yml)
Getting started
With a bundled InfluxDB and Grafana
docker-compose -f docker-compose.standalone.yml up
With an external InfluxDB
-
INFLUX_PROTOCOLoptional default: http Protocol to use, http or https. -
INFLUX_HOSTInflux (FQDN) host to connect to. -
INFLUX_PORToptional default: 8086 Influx port to connect to. -
INFLUX_USERoptional default: root Username for connecting to the database. -
INFLUX_PWDoptional default: root Password for connecting to the database. -
INFLUX_DBDatabase to operate on.
Note: You can use the Docker network FQDN if you put the service in the same Docker network as your InfluxDB instance. INFLUX_HOST will be influx if your service's name is influx.
docker-compose up -d
Test the TCP server
docker-compose -f docker-compose.standalone.yml up-
netcat localhost 7070orncat localhost 7070with Git bash for Windows - type:
Failed password for username from 206.253.167.10 port 11111 ssh2 - Data should be parsed and added
Rsyslog configuration
Add this under /etc/rsyslog.conf to forward ssh auth failures to local server :
I have 'PasswordAuthentication' activated
template(name="OnlyMsg" type="string" string="%msg:::drop-last-lf%\n")
if $programname == 'sshd' then {
   if $msg startswith ' Failed' then {
      action(type="omfwd" target="127.0.0.1" port="7070" protocol="tcp" template="OnlyMsg")
   }
}
I have 'PubkeyAuthentication' activated
template(name="OnlyMsg" type="string" string="%msg:::drop-last-lf%\n")
if $programname == 'sshd' then {
   if $msg startswith ' Invalid' then {
      action(type="omfwd" target="127.0.0.1" port="7070" protocol="tcp" template="OnlyMsg")
   } else if $msg startswith ' Disconnected from authenticating' then {
      action(type="omfwd" target="127.0.0.1" port="7070" protocol="tcp" template="OnlyMsg")
   }
}
Debug configuration
- If you want to skip certificate validation, set
NODE_TLS_REJECT_UNAUTHORIZEDto 0, but don't do this without understanding the implications. -
DEBUG_LEVEL: level of logging in log4js, default is "info".
Note that the project description data, including the texts, logos, images, and/or trademarks,
for each open source project belongs to its rightful owner.
If you wish to add or remove any projects, please contact us at [email protected].


