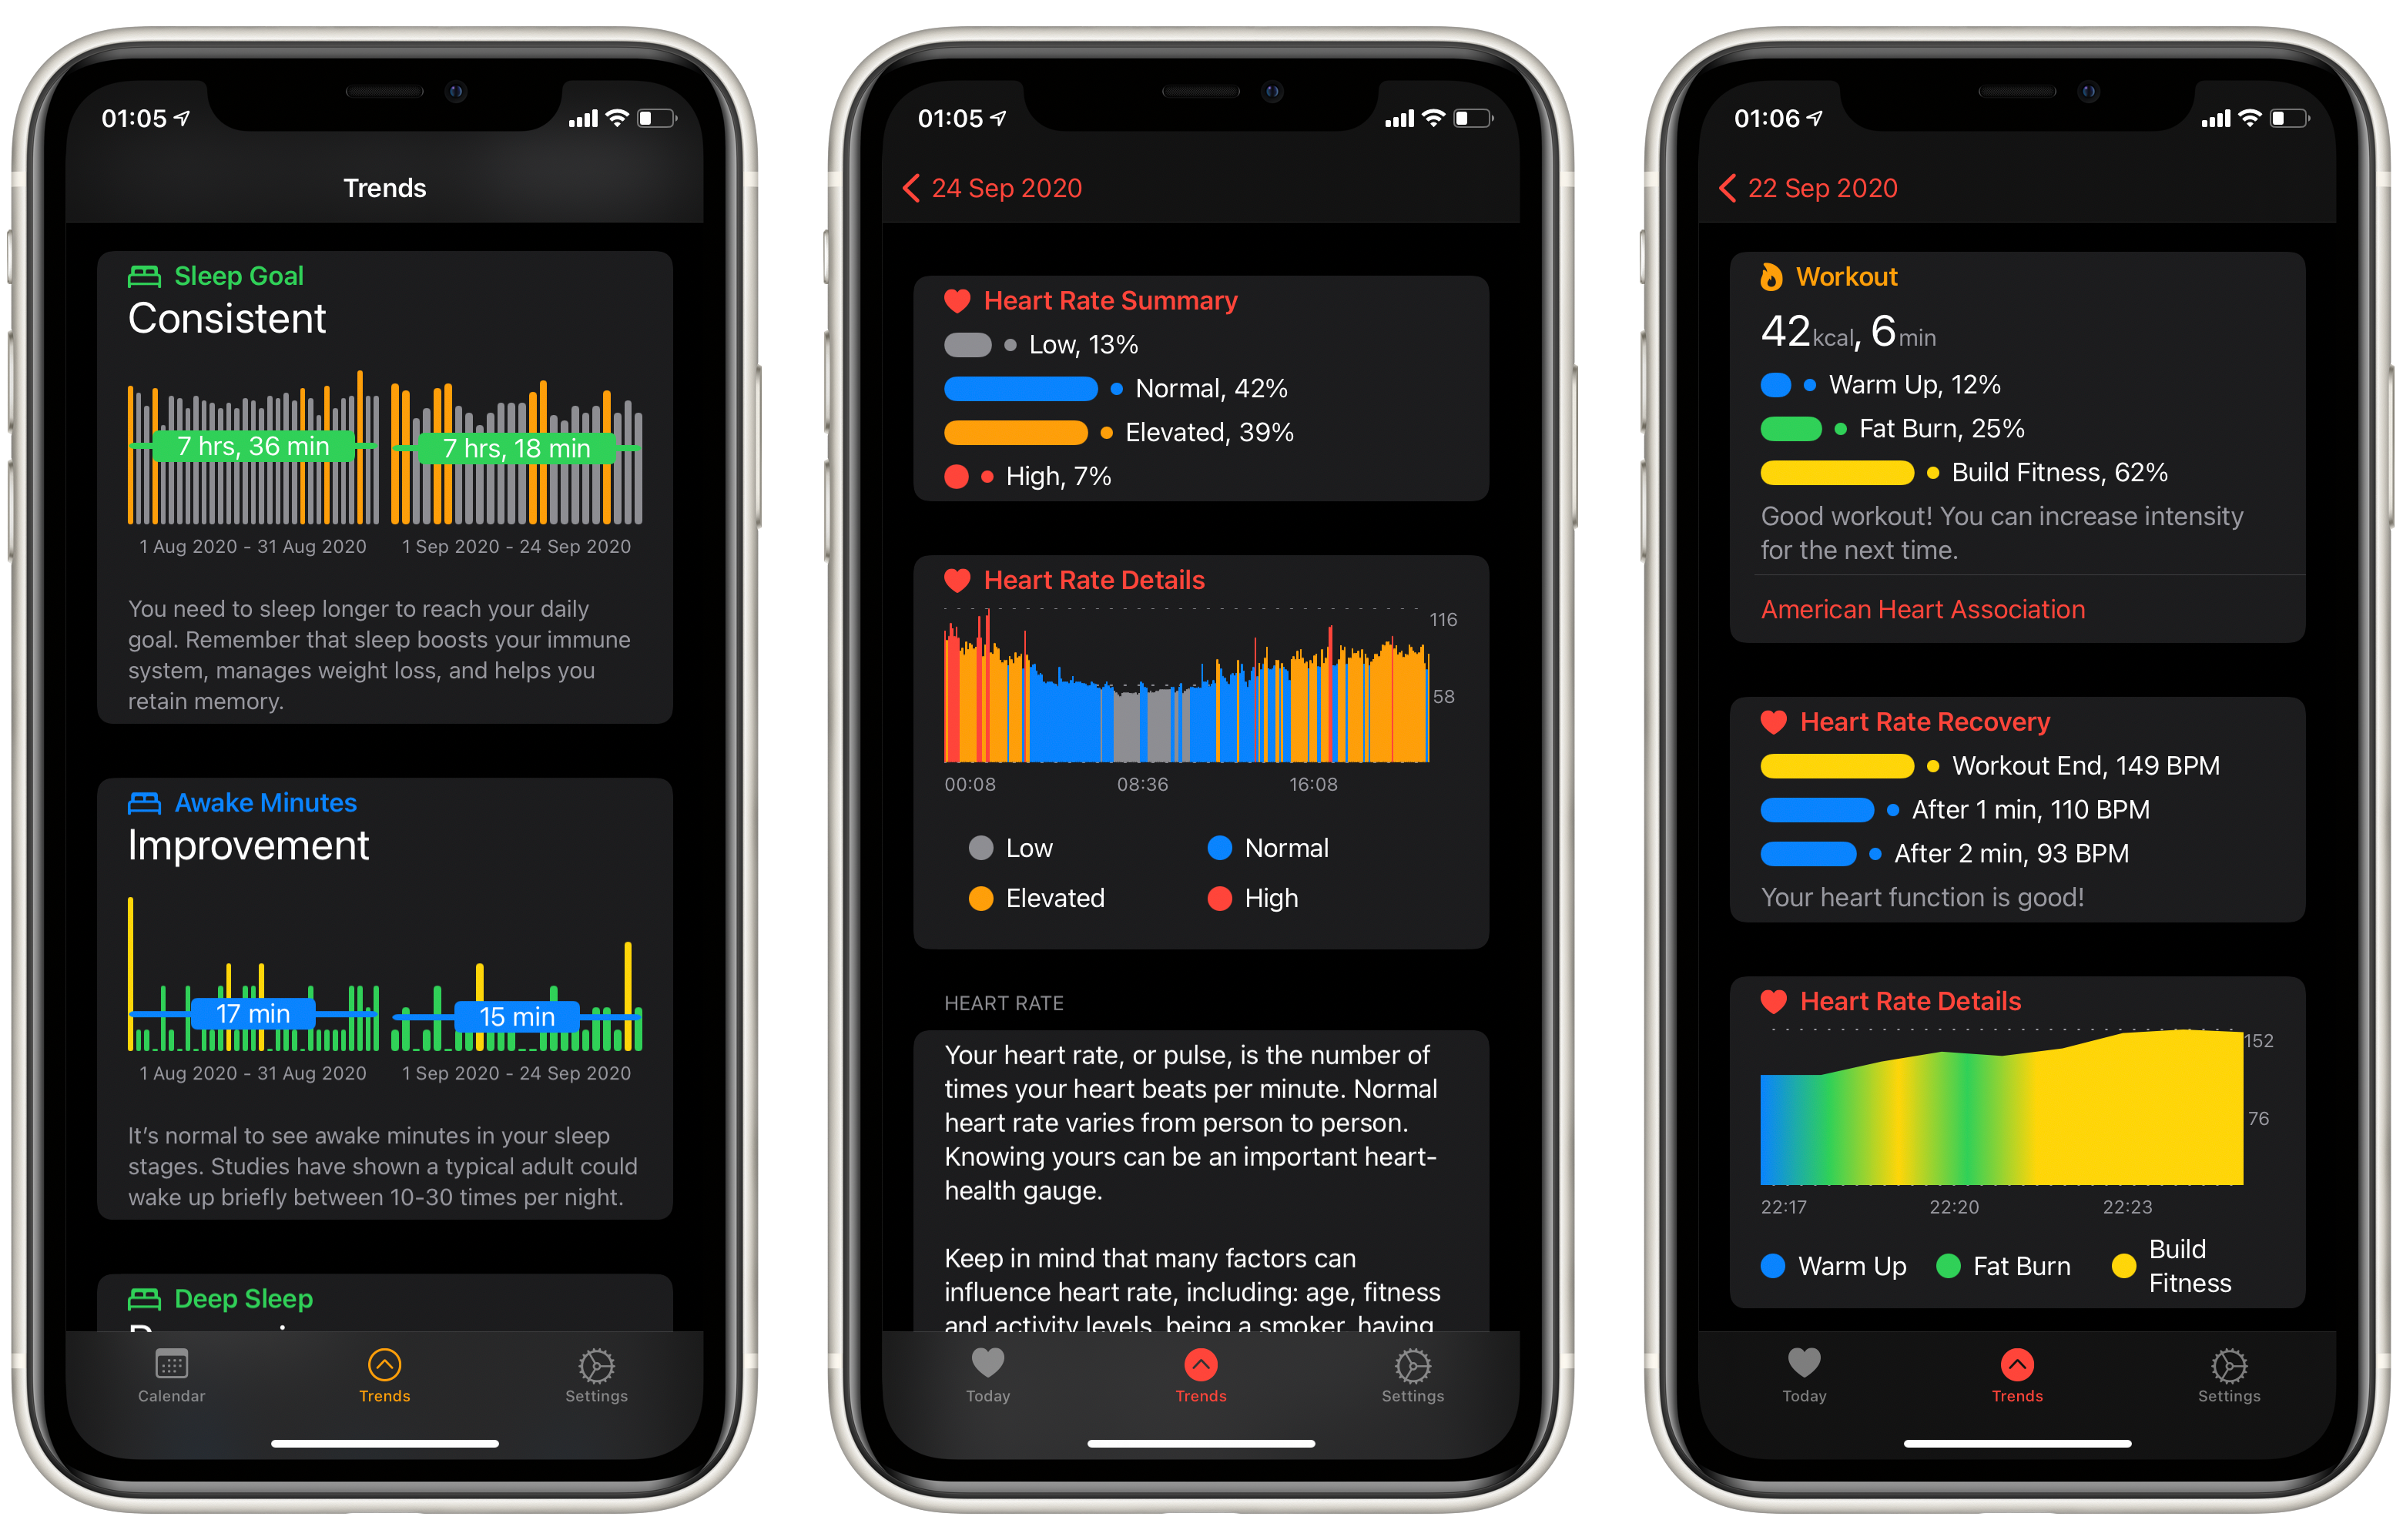
mecid / Swiftuicharts
Licence: mit
A simple line and bar charting library that supports accessibility written using SwiftUI.
Stars: ✭ 778
Programming Languages
swift
15916 projects
Labels
Projects that are alternatives of or similar to Swiftuicharts
Gojs
JavaScript diagramming library for interactive flowcharts, org charts, design tools, planning tools, visual languages.
Stars: ✭ 5,739 (+637.66%)
Mutual labels: chart
Chartify
📊 📈 📉 React.js plugin for building charts using CSS
Stars: ✭ 671 (-13.75%)
Mutual labels: chart
Vis Timeline
📈 Create a fully customizable, interactive timelines and 2d-graphs with items and ranges.
Stars: ✭ 654 (-15.94%)
Mutual labels: chart
Chartkick.py
Create beautiful Javascript charts with minimal code
Stars: ✭ 695 (-10.67%)
Mutual labels: chart
Wunderbar
Simple horizontal bar chart printer for your terminal
Stars: ✭ 572 (-26.48%)
Mutual labels: chart
Bizcharts
Powerful data visualization library based on G2 and React.
Stars: ✭ 5,771 (+641.77%)
Mutual labels: chart
Xychart
XYChart is designed for line & bar of charts which can compare mutiple datas in form styles, and limited the range of values to show, and so on.
Stars: ✭ 707 (-9.13%)
Mutual labels: chart
Hsstockchart
Stock Chart include CandleStickChart,TimeLineChart. 股票走势图,包括 K 线图,分时图,手势缩放,拖动
Stars: ✭ 602 (-22.62%)
Mutual labels: chart
Financialcustomerview
各种金融类的自定义View,基金走势图、分时图、蜡烛图、各种指标等,一步一步构建庞大的基金自定View...
Stars: ✭ 642 (-17.48%)
Mutual labels: chart
Swift Linechart
Line Chart library for iOS written in Swift
Stars: ✭ 589 (-24.29%)
Mutual labels: chart
React Timeseries Charts
Declarative and modular timeseries charting components for React
Stars: ✭ 690 (-11.31%)
Mutual labels: chart
Uplot
📈 A small, fast chart for time series, lines, areas, ohlc & bars
Stars: ✭ 6,808 (+775.06%)
Mutual labels: chart
Ol Ext
Cool extensions for Openlayers (ol) - animated clusters, CSS popup, Font Awesome symbol renderer, charts for statistical map (pie/bar), layer switcher, wikipedia layer, animations, canvas filters.
Stars: ✭ 706 (-9.25%)
Mutual labels: chart
SwiftUICharts
A simple line and bar charting library that support accessibility written using SwiftUI.

Usage
Vertical bar chart
let highIntensity = Legend(color: .orange, label: "High Intensity", order: 5)
let buildFitness = Legend(color: .yellow, label: "Build Fitness", order: 4)
let fatBurning = Legend(color: .green, label: "Fat Burning", order: 3)
let warmUp = Legend(color: .blue, label: "Warm Up", order: 2)
let low = Legend(color: .gray, label: "Low", order: 1)

let limit = DataPoint(value: 130, label: "5", legend: fatBurning)

let points: [DataPoint] = [
    .init(value: 70, label: "1", legend: low),
    .init(value: 90, label: "2", legend: warmUp),
    .init(value: 91, label: "3", legend: warmUp),
    .init(value: 92, label: "4", legend: warmUp),
    .init(value: 130, label: "5", legend: fatBurning),
    .init(value: 124, label: "6", legend: fatBurning),
    .init(value: 135, label: "7", legend: fatBurning),
    .init(value: 133, label: "8", legend: fatBurning),
    .init(value: 136, label: "9", legend: fatBurning),
    .init(value: 138, label: "10", legend: fatBurning),
    .init(value: 150, label: "11", legend: buildFitness),
    .init(value: 151, label: "12", legend: buildFitness),
    .init(value: 150, label: "13", legend: buildFitness),
    .init(value: 136, label: "14", legend: fatBurning),
    .init(value: 135, label: "15", legend: fatBurning),
    .init(value: 130, label: "16", legend: fatBurning),
    .init(value: 130, label: "17", legend: fatBurning),
    .init(value: 150, label: "18", legend: buildFitness),
    .init(value: 151, label: "19", legend: buildFitness),
    .init(value: 150, label: "20", legend: buildFitness),
    .init(value: 160, label: "21", legend: highIntensity),
    .init(value: 159, label: "22", legend: highIntensity),
    .init(value: 161, label: "23", legend: highIntensity),
    .init(value: 158, label: "24", legend: highIntensity),
]

BarChartView(dataPoints: points, limit: limit)
Horizontal bar chart
let warmUp = Legend(color: .blue, label: "Warm Up", order: 2)
let low = Legend(color: .gray, label: "Low", order: 1)

let points: [DataPoint] = [
    .init(value: 70, label: "1", legend: low),
    .init(value: 90, label: "2", legend: warmUp),
    .init(value: 91, label: "3", legend: warmUp),
    .init(value: 92, label: "4", legend: warmUp)
]

HorizontalBarChartView(dataPoints: points)
Line chart
let buildFitness = Legend(color: .yellow, label: "Build Fitness", order: 4)
let fatBurning = Legend(color: .green, label: "Fat Burning", order: 3)
let warmUp = Legend(color: .blue, label: "Warm Up", order: 2)
let low = Legend(color: .gray, label: "Low", order: 1)

let points: [DataPoint] = [
    .init(value: 70, label: "1", legend: low),
    .init(value: 90, label: "2", legend: warmUp),
    .init(value: 91, label: "3", legend: warmUp),
    .init(value: 92, label: "4", legend: warmUp),
    .init(value: 130, label: "5", legend: fatBurning),
    .init(value: 124, label: "6", legend: fatBurning),
    .init(value: 135, label: "7", legend: fatBurning),
    .init(value: 133, label: "8", legend: fatBurning),
    .init(value: 136, label: "9", legend: fatBurning),
    .init(value: 138, label: "10", legend: fatBurning),
    .init(value: 150, label: "11", legend: buildFitness),
    .init(value: 151, label: "12", legend: buildFitness),
    .init(value: 150, label: "13", legend: buildFitness)
]

LineChartView(dataPoints: points)
Installation
Add this Swift package in Xcode using its Github repository url. (File > Swift Packages > Add Package Dependency...)
Author
Majid Jabrayilov: [email protected]
License
SwiftUICharts is available under the MIT license. See the LICENSE file for more info.
Note that the project description data, including the texts, logos, images, and/or trademarks,
for each open source project belongs to its rightful owner.
If you wish to add or remove any projects, please contact us at [email protected].
