DistrictDataLabs / Tribe
Labels
Projects that are alternatives of or similar to Tribe
Tribe
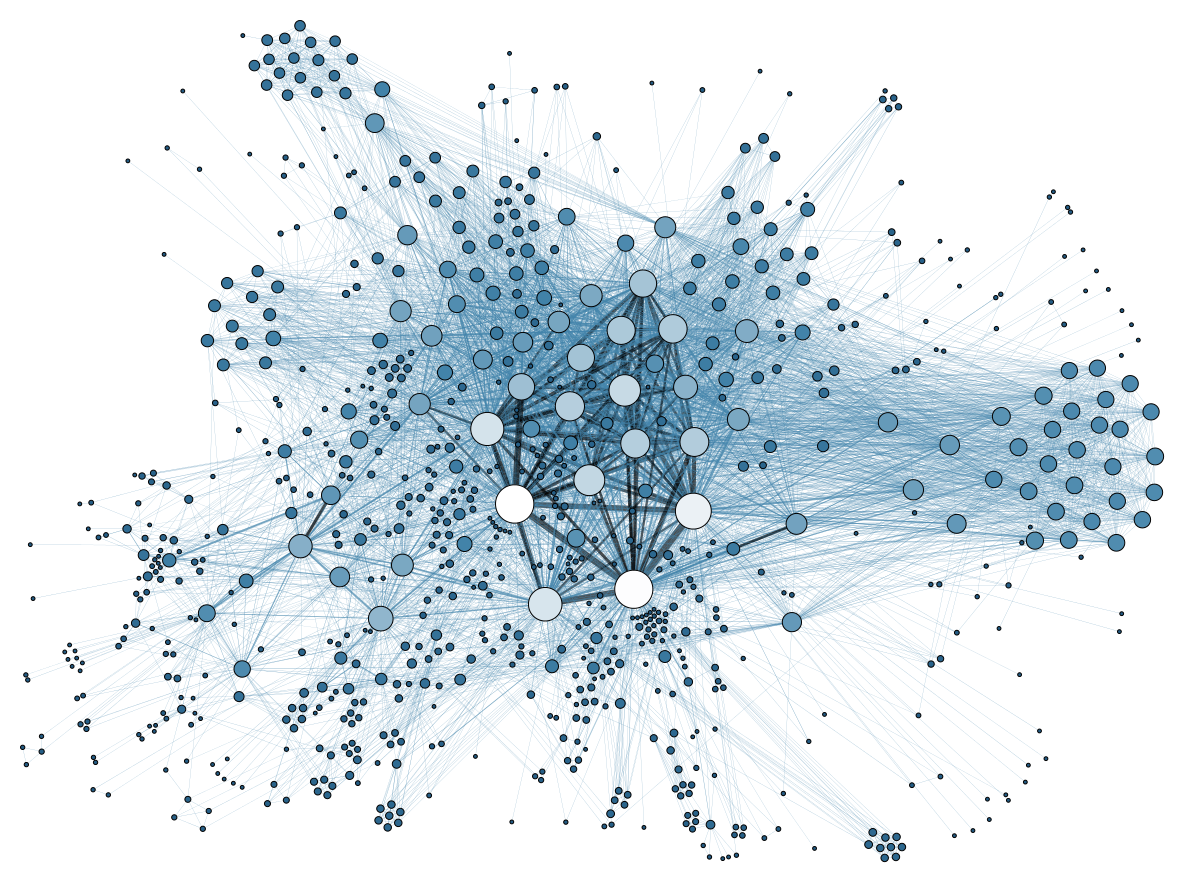
Tribe extracts a network from an email mbox and writes it to a graphml file for visualization and analysis.
Tribe is a utility that will allow you to extract a network (a graph) from a communication network that we all use often - our email. Tribe is designed to read an email mbox (a native format for email in Python)and write the resulting graph to a GraphML file on disk. This utility is generally used for District Data Labs' Graph Analytics with Python and NetworkX course, but can be used for anyone interested in studying networks.
Downloading your Data
One easy place to obtain a communications network to perform graph analyses is your email. Tribe extracts the relationships between unique email addresses by exploring who is connected by participating in the same email address. In particular, we will use a common format for email storage called mbox. If you have Apple Mail, Thunderbird, or Microsoft Outlook, you should be able to export your mbox. If you have Gmail you may have to use an online email extraction tool. For more on downloading your data, see Exporting an MBox from Email
Extracting a Graph from Email
-
Download your email mbox, in this example it's in a file called
myemails.mbox. -
Install the tribe utility with
pip:$ pip install tribeNote that you may need administrator privileges to do this.
-
Extract a graph from your email MBox as follows:
$ python tribe-admin.py extract -w myemails.graphml myemails.mboxBe patient, this could take some time, on my Macbook Pro it took 12 minutes to perform the complete extraction on an MBox that was 7.5 GB.
You're now ready to get started analyzing your email network!
Developing for Tribe
To work with this code, you'll need to do a few things to set up your environment, follow these steps to put together a development ready environment. Note that there are some variations of the methodology for various operating systems, the notes below assume Linux/Unix (including Mac OS X).
-
Fork, then clone this repository
Using the git command line tool, this is a pretty simple step:
$ git clone https://github.com/DistrictDataLabs/tribe.git -
Change directories (cd) into the project directory
$ cd tribe -
(Optional, Recommended) Create a virtual environment for the code and dependencies
Using
virtualenvby itself:$ virtualenv venv $ source venv/bin/activateUsing
virtualenvwrapper(configured correctly):$ mkvirtualenv -a $(pwd) tribe -
Install the required third party packages using
pip:(venv)$ pip install -r requirements.txt -
Test everything is working:
$ python tribe-admin.py --helpYou should see a help screen printed out.
Contributing
Tribe is open source, and we'd love your help. If you would like to contribute, you can do so in the following ways:
- Add issues or bugs to the bug tracker: https://github.com/DistrictDataLabs/tribe/issues
- Work on a card on the dev board: https://waffle.io/DistrictDataLabs/tribe
- Create a pull request in Github: https://github.com/DistrictDataLabs/tribe/pulls
Note that labels in the Github issues are defined in the blog post: How we use labels on GitHub Issues at Mediocre Laboratories.
If you are a member of the District Data Labs Faculty group, you have direct access to the repository, which is set up in a typical production/release/development cycle as described in A Successful Git Branching Model. A typical workflow is as follows:
-
Select a card from the dev board - preferably one that is "ready" then move it to "in-progress".
-
Create a branch off of develop called "feature-[feature name]", work and commit into that branch.
~$ git checkout -b feature-myfeature develop -
Once you are done working (and everything is tested) merge your feature into develop.
~$ git checkout develop ~$ git merge --no-ff feature-myfeature ~$ git branch -d feature-myfeature ~$ git push origin develop -
Repeat. Releases will be routinely pushed into master via release branches, then deployed to the server.
Contributors
Thank you for all your help contributing to make Tribe a great project!
Maintainers
- Benjamin Bengfort: @bbengfort
Contributors
- Your name welcome here!
Changelog
The release versions that are sent to the Python package index (PyPI) are also tagged in Github. You can see the tags through the Github web application and download the tarball of the version you'd like.
The versioning uses a three part version system, "a.b.c" - "a" represents a major release that may not be backwards compatible. "b" is incremented on minor releases that may contain extra features, but are backwards compatible. "c" releases are bug fixes or other micro changes that developers should feel free to immediately update to.
Version 1.3
After some feedback about the length of time it was taking to create the edges in the NetworkX graph, we modified the FreqDist object to memoize calls to N, B, and M. This means that on a per edge basis, far fewer complete traversals of the distribution are carried out. Already we have observed minutes worth of performance improvements as a result. The Graph also now carries more information including edge weights by frequency, count, and by L1 norm. The Graph itself carries email count and file size information data alongside other information.
Version 1.2
In this release we have improved some of the handling code to make things a bit more robust with students who work on a variety of operating systems. For example we have added a progress indicator so that something appears to be happening on very large mbox files (and you're not left wondering). Additionally we have added better error handling so one bad email doesn't ruin your day. We also made the library Python 2.7 and Python 3.5 compatible with a better test suite.
Version 1.1.2
This is the initial release of Tribe that has been used for teaching since the first SNA workshop in 2014. This version was cleaned up a bit, with extra dependency removal and better organization. This is also the first version that was deployed to PyPI.


