Seedarchangel / Tuchart
Programming Languages
Projects that are alternatives of or similar to Tuchart
TuChart 
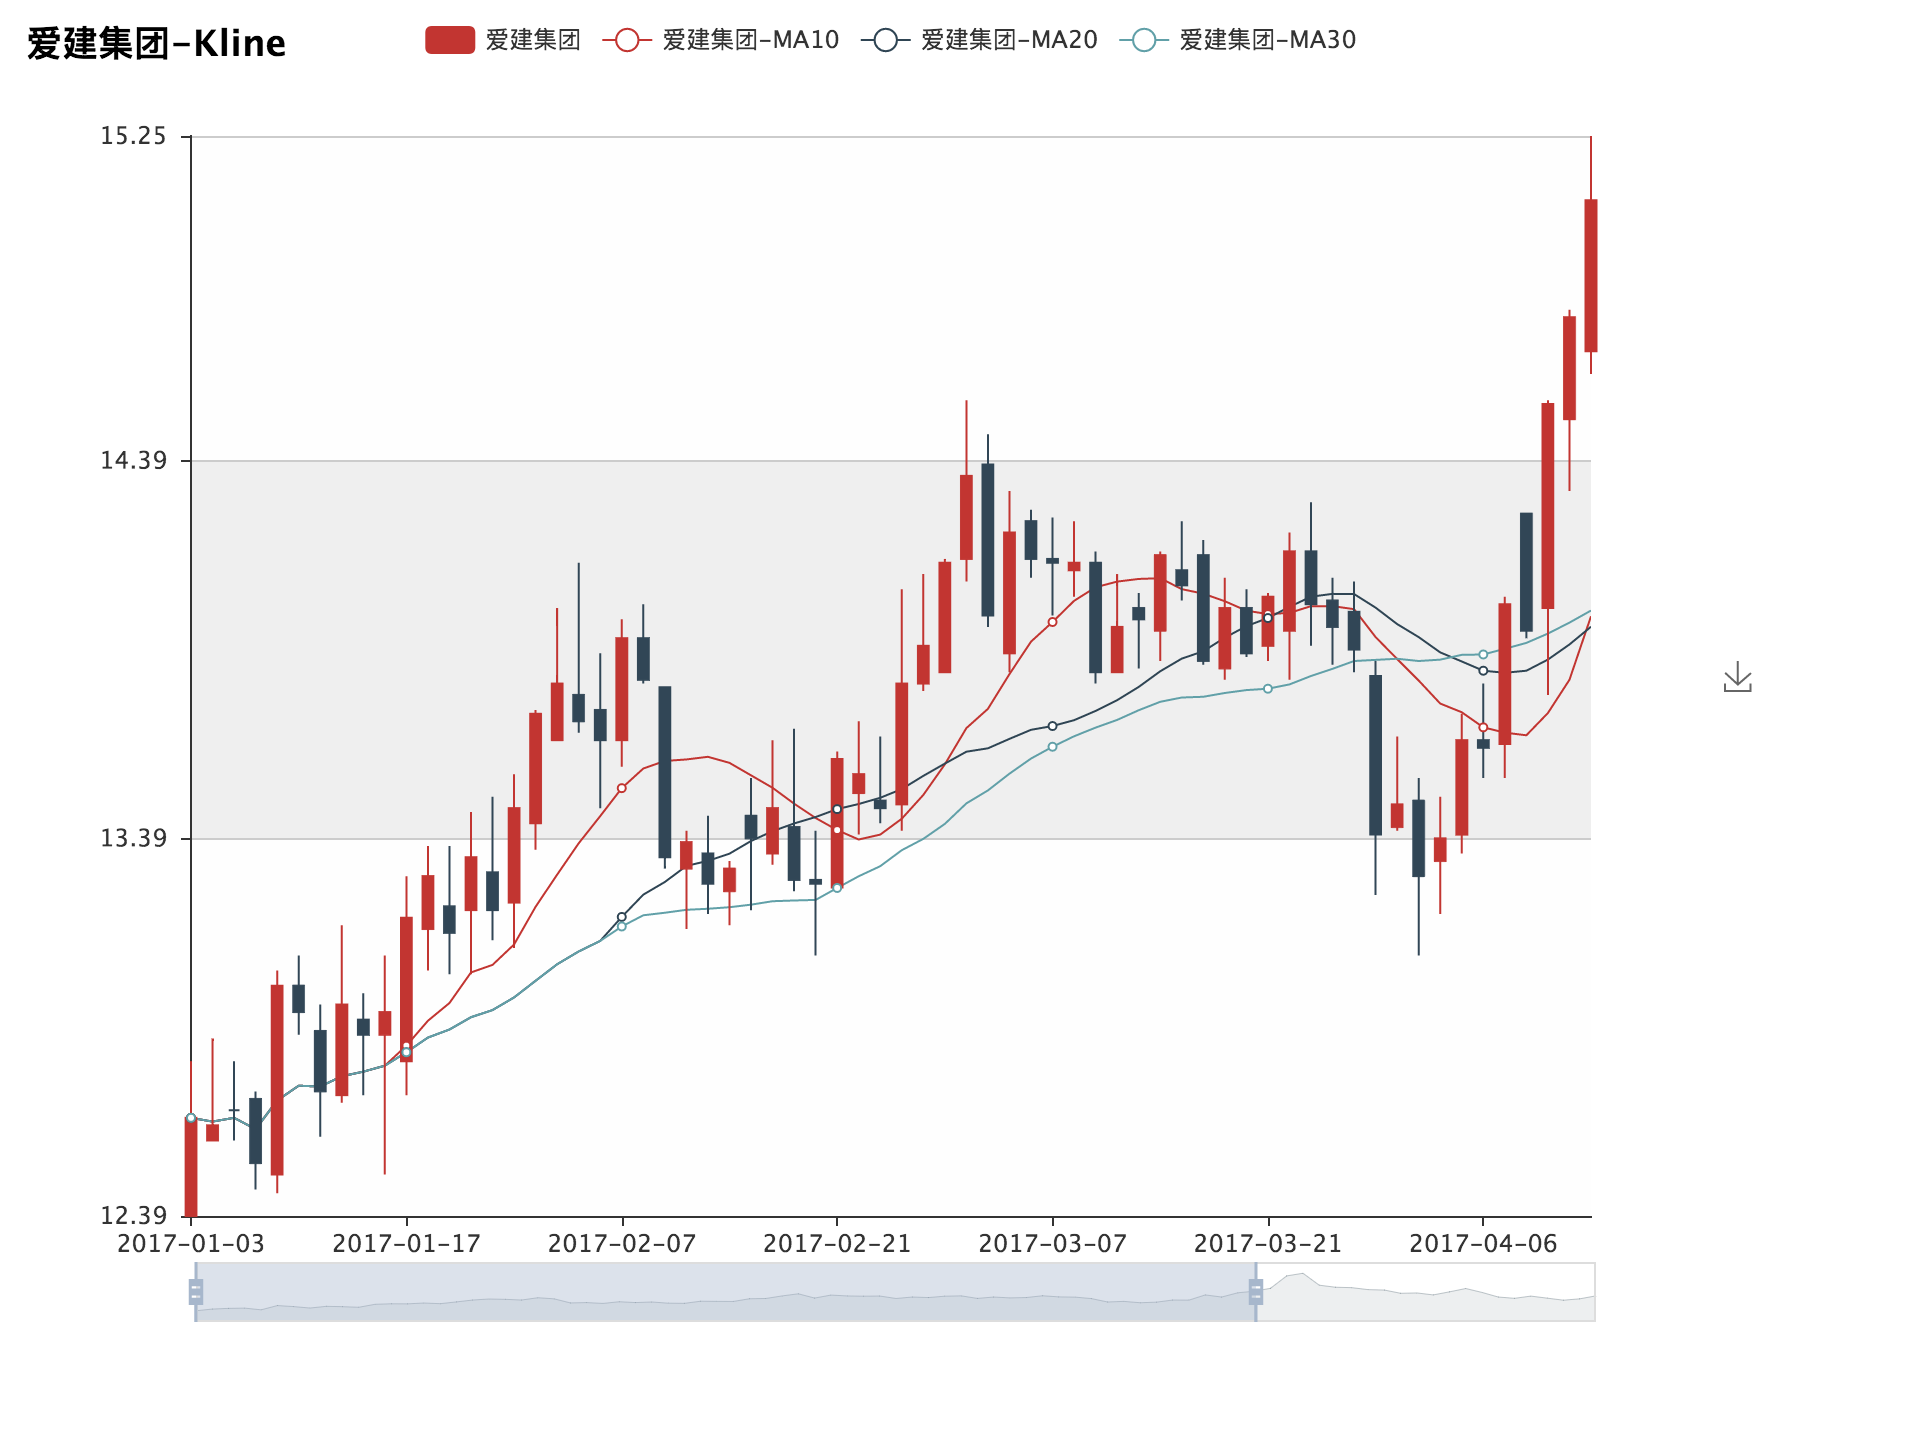
TuChart is a visualization tool for the Chinese stock market, based on Tushare and Echarts.
Examples
Candlestick Charts
Tick Charts

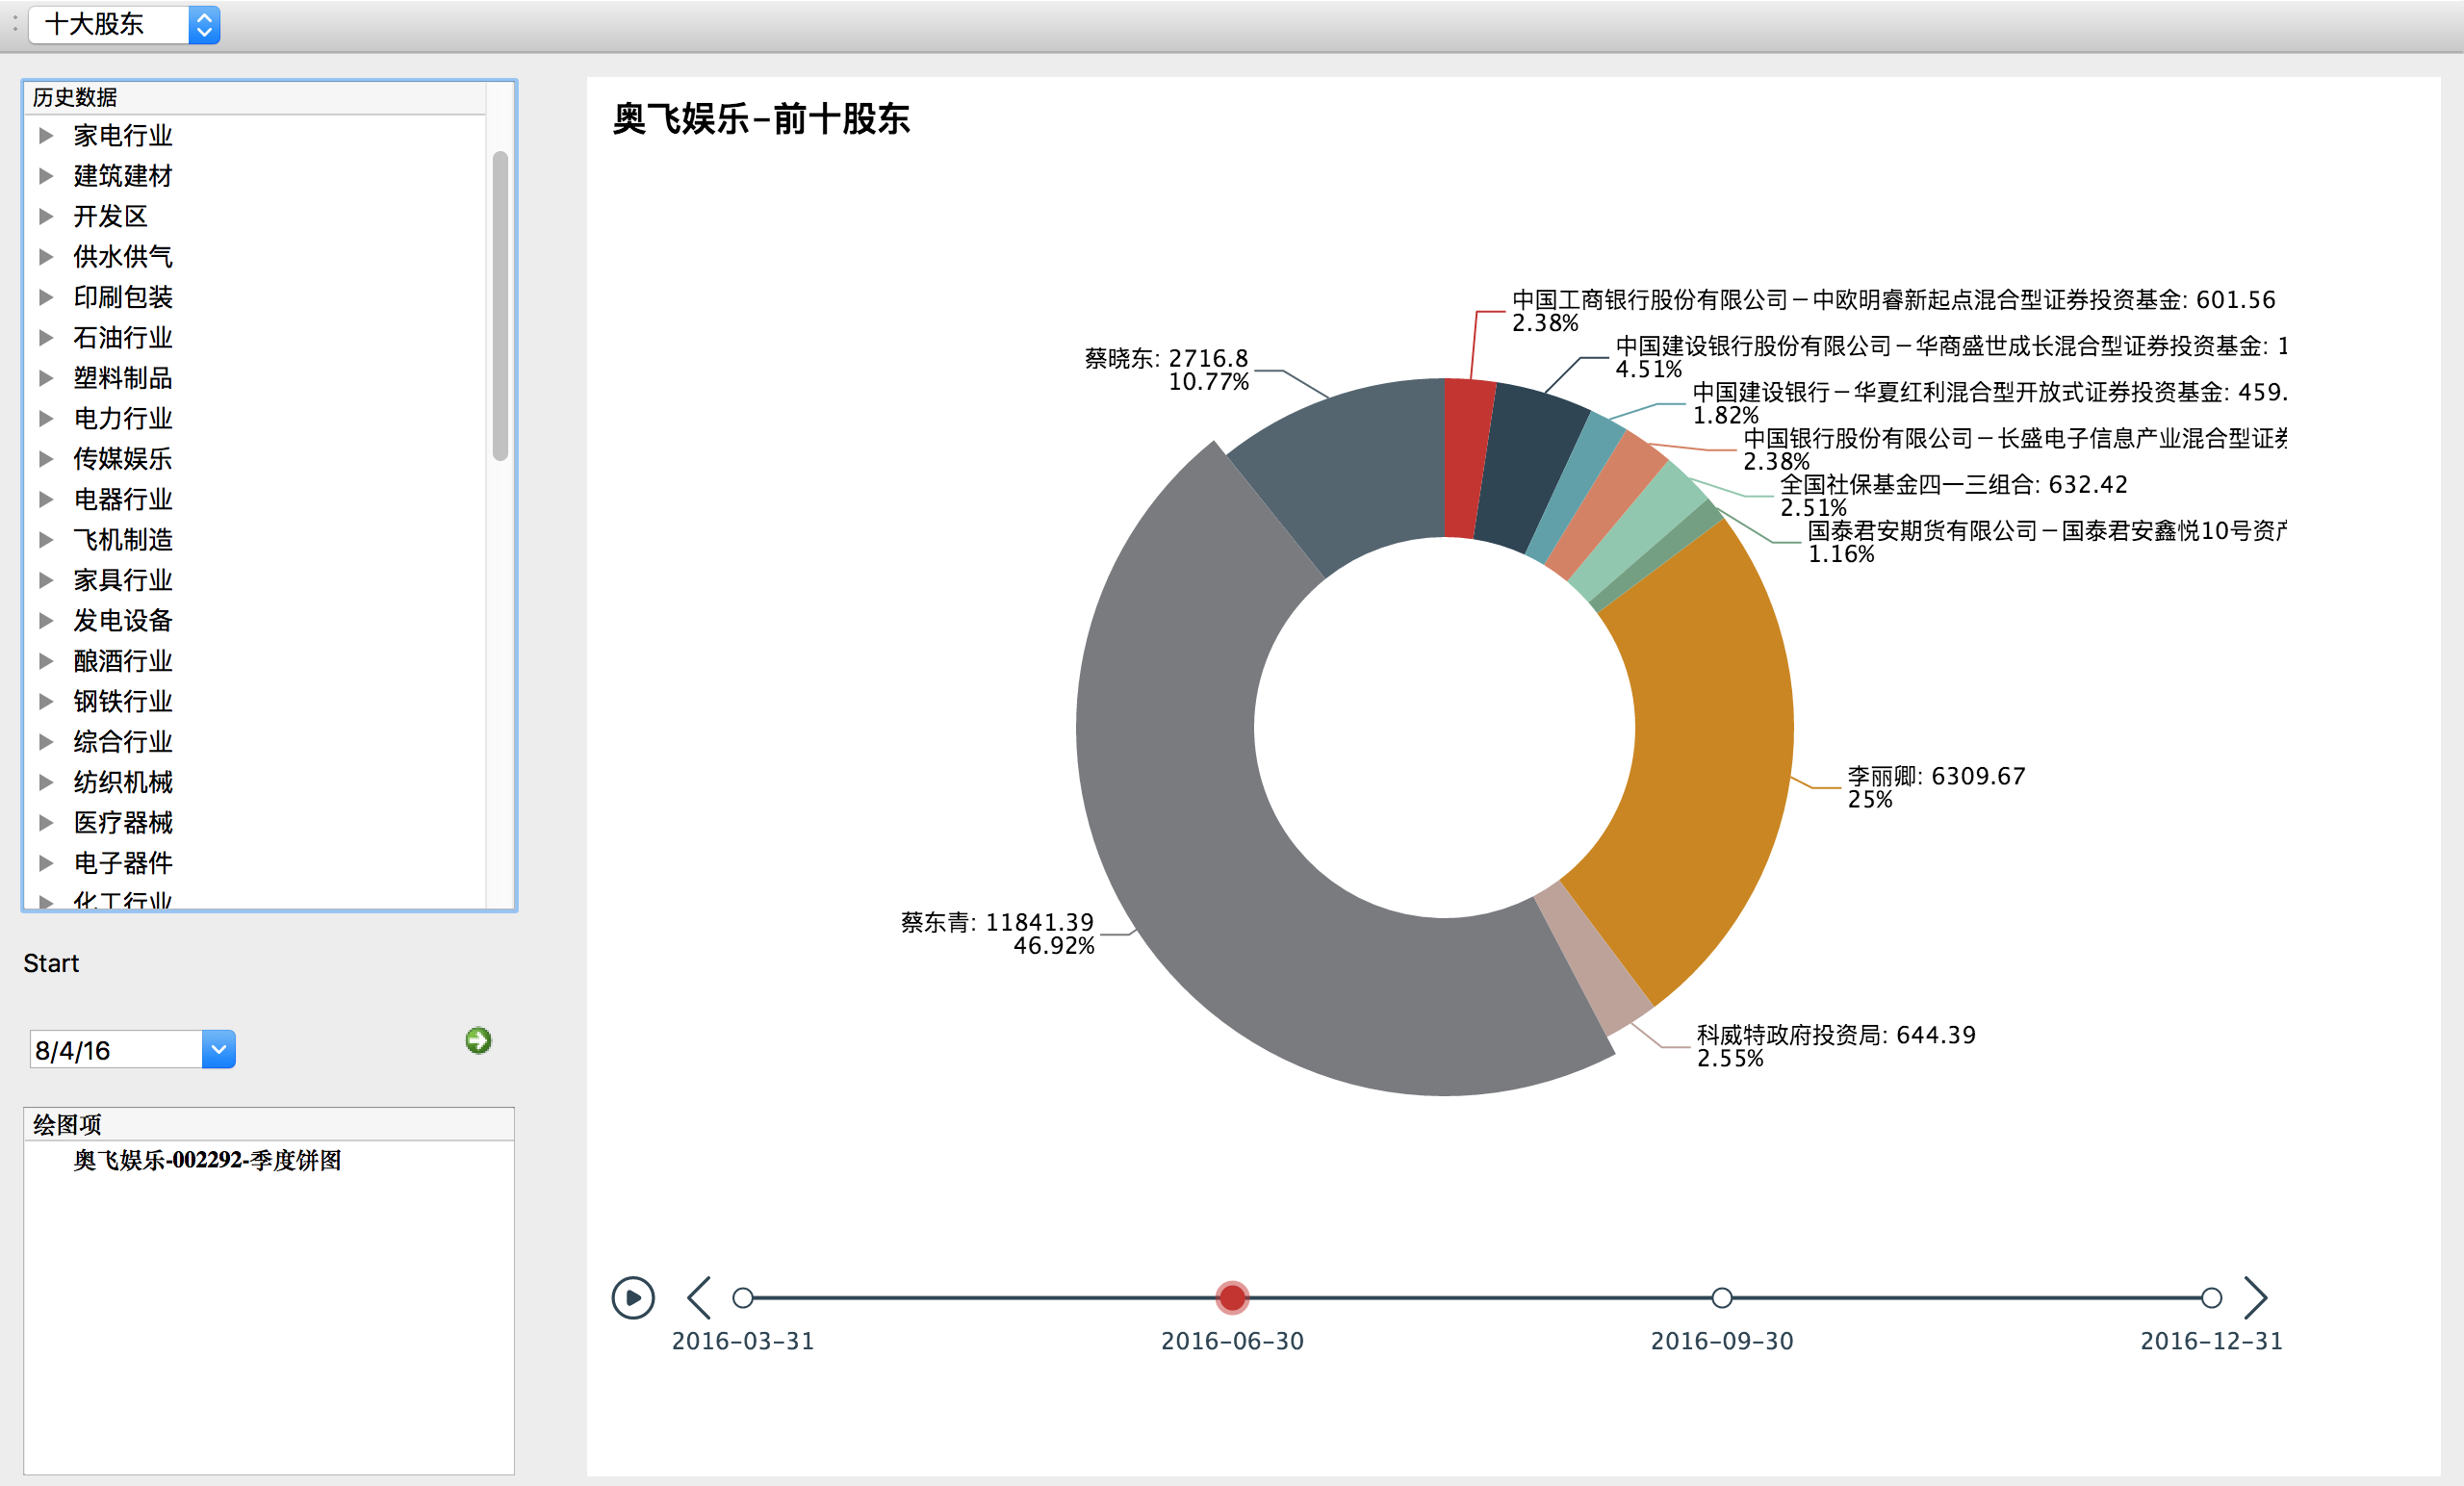
Major Shareholders
Supports dragging and zooming

Setup Instructions
Install all necessary dependencies
pip install pyecharts==0.2.0
pip install tushare==0.8.6
To install Tuchart, enter
pip install tuchart
in your terminal
Notice:For best plotting experience,please download the latest version = 0.1.2.7
then, under your tuchart directory, e.g:
/user/anaconda/lib/python2.7/site-packages/tuchart
runpython main.py
The exact path of tuchart in your directory can be located bypip show tuchart:
 add
add/tuchartto pinpoint the tuchart directory.
Right click to choose the name of stock and type of data you would like to plot. Then, press the green arrow button to plot. Due to the size constraints, it is recommended to plot fewer than 5 graphs at the same time.

Tuchart Currently Supports:
- Raw Stock Data
- Daily average
- Weekly average
- Monthly average
- 15 minute average
- 30 minute average
- Restoration Data
- Daily average
- Weekly average
- Monthly average
- 15 minute average
- 30 minute average
- Tick data of individual stocks
- High frequency data within one day
High frequency data is calculated from tick data of your chosen day. Algorithm: 如何用TICK数据生成分钟线数据
- Distribution of Top Shareholders
Tuchart will return data for top shareholders within your chosen year.
Updates
0.1.2.5
- Supports plotting for High frequency data
- 1 minute average
- 5 minute average
- 15 minute average
- 30 minute average
- Supports plotting of top shareholders within a year.
0.1.2.4
- Fixed dependency issues when user has PYQT4 Layer
0.1.2.3
- Added script to save stock list every 12 hours
- Increased stability
- Auto-resize image according to size of the app
- Added market indexes
Contact:
Email: [email protected]