All Projects โ†’ visjs โ†’ Vis Graph3d

visjs / Vis Graph3d

Licence: other
๐Ÿ“Š Create interactive, animated 3d graphs. Surfaces, lines, dots and block styling out of the box.

Programming Languages

javascript
184084 projects - #8 most used programming language

Projects that are alternatives of or similar to Vis Graph3d

Chart.js
Simple HTML5 Charts using the <canvas> tag
Stars: โœญ 55,646 (+43036.43%)
Mutual labels:  hacktoberfest, chart
Ngx Charts
๐Ÿ“Š Declarative Charting Framework for Angular
Stars: โœญ 4,057 (+3044.96%)
Mutual labels:  hacktoberfest, chart
Fl chart
A powerful Flutter chart library, currently supporting Line Chart, Bar Chart, Pie Chart, Scatter Chart and Radar Chart.
Stars: โœญ 3,882 (+2909.3%)
Mutual labels:  hacktoberfest, chart
V Chart Plugin
Easily bind a chart to the data stored in your Vue.js components.
Stars: โœญ 188 (+45.74%)
Mutual labels:  hacktoberfest, chart
Pyvista
3D plotting and mesh analysis through a streamlined interface for the Visualization Toolkit (VTK)
Stars: โœญ 734 (+468.99%)
Mutual labels:  hacktoberfest, 3d
Nxdk
The cross-platform, open-source SDK to develop for original Xbox: *new* xdk
Stars: โœญ 200 (+55.04%)
Mutual labels:  hacktoberfest, 3d
Limonengine
3D FPS game engine with full dynamic lighting and shadows
Stars: โœญ 331 (+156.59%)
Mutual labels:  hacktoberfest, 3d
Glportal
๐ŸŽฎ Open Source teleportation based first person puzzle-platformer
Stars: โœญ 297 (+130.23%)
Mutual labels:  hacktoberfest, 3d
Vis Timeline
๐Ÿ“ˆ Create a fully customizable, interactive timelines and 2d-graphs with items and ranges.
Stars: โœญ 654 (+406.98%)
Mutual labels:  hacktoberfest, chart
Silk.net
The high-speed OpenAL, OpenGL, Vulkan, and GLFW bindings library your mother warned you about.
Stars: โœญ 534 (+313.95%)
Mutual labels:  hacktoberfest, 3d
Elm 3d Scene
A high-level 3D rendering engine for Elm, with support for lighting, shadows, and realistic materials.
Stars: โœญ 167 (+29.46%)
Mutual labels:  hacktoberfest, 3d
Radixengine
A free and open game engine.
Stars: โœญ 126 (-2.33%)
Mutual labels:  hacktoberfest, 3d
Wechart
Create all the [ch]arts by cax or three.js - Cax ๅ’Œ three.js ๅˆ›้€ ไธ€ๅˆ‡ๅ›พ[่กจ]
Stars: โœญ 152 (+17.83%)
Mutual labels:  3d, chart
Vue Morris
VueJS component wrapping Morris.js
Stars: โœญ 212 (+64.34%)
Mutual labels:  hacktoberfest, chart
Rollup Plugin Visualizer
๐Ÿ“ˆโš–๏ธ Visuallize your bundle
Stars: โœญ 405 (+213.95%)
Mutual labels:  hacktoberfest, chart
Arcchartview
Arc Chart View (Draw Creative Statistic Arc Charts)
Stars: โœญ 96 (-25.58%)
Mutual labels:  hacktoberfest, chart
Npmcharts.com
Compare npm package downloads over time
Stars: โœญ 129 (+0%)
Mutual labels:  hacktoberfest, chart
Oc Mall Plugin
๐Ÿช E-commerce solution for October CMS
Stars: โœญ 128 (-0.78%)
Mutual labels:  hacktoberfest
Handbook
๐Ÿ“– Complete documentation for WP-CLI
Stars: โœญ 129 (+0%)
Mutual labels:  hacktoberfest
Guidetomastodon
An increasingly less-brief guide to Mastodon
Stars: โœญ 129 (+0%)
Mutual labels:  hacktoberfest

vis-graph3d

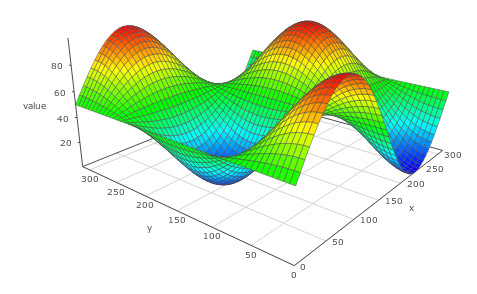
example chart

Graph3d is an interactive visualization chart to draw data in a three dimensional graph. You can freely move and zoom in the graph by dragging and scrolling in the window. Graph3d also supports animation of a graph.

Graph3d uses HTML canvas to render graphs, and can render up to a few thousands of data points smoothly.

Badges

GitHub contributors GitHub stars

Backers on Open Collective Sponsors on Open Collective Greenkeeper badge

Install

Install via npm:

$ npm install vis-graph3d

Example

A basic example on loading a Timeline is shown below. More examples can be found in the examples directory of the project.

<!doctype html>
<html>
<head>
  <title>Graph 3D demo</title>
  <script type="text/javascript" src="https://unpkg.com/[email protected]/dist/vis-graph3d.min.js"></script>
  <script type="text/javascript">
    var data = null;
    var graph = null;

    function custom(x, y) {
      return (Math.sin(x/50) * Math.cos(y/50) * 50 + 50);
    }

    // Called when the Visualization API is loaded.
    function drawVisualization() {
      // Create and populate a data table.
      data = new vis.DataSet();
      // create some nice looking data with sin/cos
      var counter = 0;
      var steps = 50;  // number of datapoints will be steps*steps
      var axisMax = 314;
      var axisStep = axisMax / steps;
      for (var x = 0; x < axisMax; x+=axisStep) {
        for (var y = 0; y < axisMax; y+=axisStep) {
          var value = custom(x,y);
          data.add({id:counter++,x:x,y:y,z:value,style:value});
        }
      }

      // specify options
      var options = {
        width:  '600px',
        height: '600px',
        style: 'surface',
        showPerspective: true,
        showGrid: true,
        showShadow: false,
        keepAspectRatio: true,
        verticalRatio: 0.5
      };

      // Instantiate our graph object.
      var container = document.getElementById('mygraph');
      graph = new vis.Graph3d(container, data, options);
    }
  </script>
</head>
<body onload="drawVisualization();">
<div id="mygraph"></div>
</body>
</html>

Build

To build the library from source, clone the project from github

$ git clone git://github.com/visjs/vis-graph3d.git

The source code uses the module style of node (require and module.exports) to organize dependencies. To install all dependencies and build the library, run npm install in the root of the project.

$ cd vis-graph3d
$ npm install

Then, the project can be build running:

$ npm run build

Test

To test the library, install the project dependencies once:

$ npm install

Then run the tests:

$ npm run test

Contribute

Contributions to the vis.js library are very welcome! We can't do this alone!

Backers

Thank you to all our backers! ๐Ÿ™

Sponsors

Support this project by becoming a sponsor. Your logo will show up here with a link to your website.

License

Copyright (C) 2010-2018 Almende B.V. and Contributors

Vis.js is dual licensed under both

and

Vis.js may be distributed under either license.

Note that the project description data, including the texts, logos, images, and/or trademarks, for each open source project belongs to its rightful owner. If you wish to add or remove any projects, please contact us at [email protected].