cheapsteak / Npmcharts.com
Licence: mit
Compare npm package downloads over time
Stars: ✭ 129
Programming Languages
javascript
184084 projects - #8 most used programming language
Projects that are alternatives of or similar to Npmcharts.com
Clchart
A fast, simple and cross-platform(html5 react-native weex wechat-applet) stock chart library created using canvas.
Stars: ✭ 250 (+93.8%)
Mutual labels: graph, data-visualization, chart
C3
📊 A D3-based reusable chart library
Stars: ✭ 9,163 (+7003.1%)
Mutual labels: graph, data-visualization, chart
Aachartkit Swift
📈📊📱💻🖥️An elegant modern declarative data visualization chart framework for iOS, iPadOS and macOS. Extremely powerful, supports line, spline, area, areaspline, column, bar, pie, scatter, angular gauges, arearange, areasplinerange, columnrange, bubble, box plot, error bars, funnel, waterfall and polar chart types. 极其精美而又强大的跨平台数据可视化图表框架,支持柱状图、条形图、…
Stars: ✭ 1,962 (+1420.93%)
Mutual labels: graph, data-visualization, chart
Uplot
📈 A small, fast chart for time series, lines, areas, ohlc & bars
Stars: ✭ 6,808 (+5177.52%)
Mutual labels: graph, data-visualization, chart
Fl chart
A powerful Flutter chart library, currently supporting Line Chart, Bar Chart, Pie Chart, Scatter Chart and Radar Chart.
Stars: ✭ 3,882 (+2909.3%)
Mutual labels: hacktoberfest, graph, chart
V Chart Plugin
Easily bind a chart to the data stored in your Vue.js components.
Stars: ✭ 188 (+45.74%)
Mutual labels: hacktoberfest, graph, chart
Graphic
A Flutter data visualization library based on Grammar of Graphics.
Stars: ✭ 173 (+34.11%)
Mutual labels: graph, data-visualization, chart
Chart.js
Simple HTML5 Charts using the <canvas> tag
Stars: ✭ 55,646 (+43036.43%)
Mutual labels: hacktoberfest, graph, chart
Gojs
JavaScript diagramming library for interactive flowcharts, org charts, design tools, planning tools, visual languages.
Stars: ✭ 5,739 (+4348.84%)
Mutual labels: graph, data-visualization, chart
Amcharts4
The most advanced amCharts charting library for JavaScript and TypeScript apps.
Stars: ✭ 907 (+603.1%)
Mutual labels: graph, data-visualization, chart
Node Sonic Channel
🦉 Sonic Channel integration for Node. Used in pair with Sonic, the fast, lightweight and schema-less search backend.
Stars: ✭ 101 (-21.71%)
Mutual labels: graph, npm
Highcharts Chart
Polymer Element wrapper for highcharts library. Seamlessly create various types of charts from one element.
Stars: ✭ 97 (-24.81%)
Mutual labels: graph, chart
Arcchartview
Arc Chart View (Draw Creative Statistic Arc Charts)
Stars: ✭ 96 (-25.58%)
Mutual labels: hacktoberfest, chart
Py Ascii Graph
A simple python lib to print data as ascii histograms
Stars: ✭ 107 (-17.05%)
Mutual labels: graph, chart
Asciigraph
Go package to make lightweight ASCII line graph ╭┈╯ in command line apps with no other dependencies.
Stars: ✭ 1,805 (+1299.22%)
Mutual labels: graph, chart
Meteor
Meteor, the JavaScript App Platform
Stars: ✭ 42,739 (+33031.01%)
Mutual labels: hacktoberfest, npm
Bundle Phobia Cli
📦 Cli for the node BundlePhobia Service 😱
Stars: ✭ 108 (-16.28%)
Mutual labels: hacktoberfest, npm
Grafana
The open and composable observability and data visualization platform. Visualize metrics, logs, and traces from multiple sources like Prometheus, Loki, Elasticsearch, InfluxDB, Postgres and many more.
Stars: ✭ 45,930 (+35504.65%)
Mutual labels: hacktoberfest, data-visualization
Thanks and appreciation to
- npm for making their data available to hack on
- Chromatic for providing component screenshot testing
- Embed.ly for bringing npmcharts embeds to Medium and Reddit
- All the open source projects that have linked their READMEs' download-count badges to npmcharts 🙏
Instructions to set up project locally
- Fork this repository.
- Go to your forked copy of this repository. It will be here:
https://github.com/<your-github-username>/npmcharts.com. - On your PC, open terminal and run:
git clone https://github.com/<your-github-username>/npmcharts.com.git. A folder callednpmcharts.comwill be created. - Run
cd npmcharts.comand thenyarn. This will take some time aspuppeteerwill install chromium (150MB). - Now,
cd packages/serverand runyarnagain. - Run
cd ../../and thennpm start. You are all set! The project will be running onport 3896.
Testing
To test your code, open your browser and go to: http://localhost:3896/chart-image/vue.png. If everything is fine, you should see a chart(takes a few seconds to load; it is normal).
Hidden features
A few things that might not be apparent just by looking at the site
-
Charts can be embedded in Medium articles
-
Tweets of a chart should contain previews of the actual chart
-
Same with slack
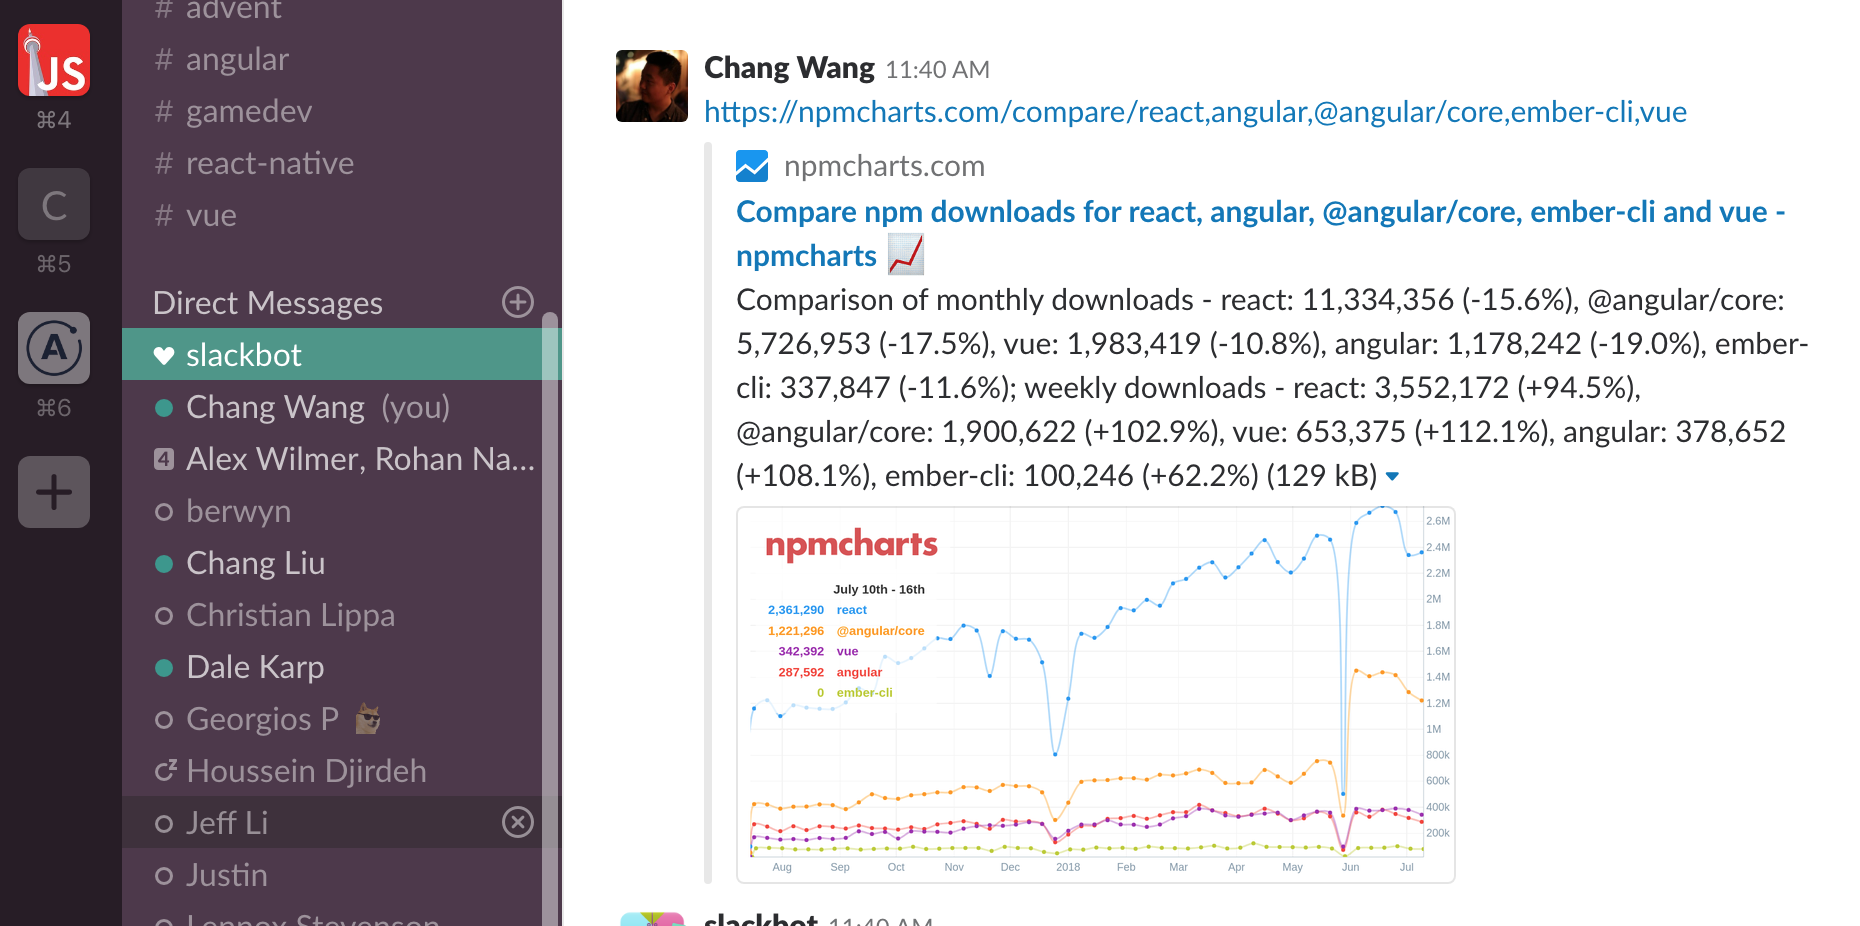


Note that the project description data, including the texts, logos, images, and/or trademarks,
for each open source project belongs to its rightful owner.
If you wish to add or remove any projects, please contact us at [email protected].