whyqd: simplicity, transparency, speed

What is it?
whyqd provides an intuitive method for restructuring messy data to conform to a standardised metadata schema. It supports data managers and researchers looking to rapidly, and continuously, normalise any messy spreadsheets using a simple series of steps. Once complete, you can import wrangled data into more complex analytical systems or full-feature wrangling tools.
It aims to get you to the point where you can perform automated data munging prior to committing your data into a database, and no further. It is built on Pandas, and plays well with existing Python-based data-analytical tools. Each raw source file will produce a json schema and method file which defines the set of actions to be performed to produce refined data, and a destination file validated against that schema.
whyqd ensures complete audit transparency by saving all actions performed to restructure your input data to a separate json-defined methods file. This permits others to read and scrutinise your approach, validate your methodology, or even use your methods to import data in production.
Once complete, a method file can be shared, along with your input data, and anyone can import whyqd and validate your method to verify that your output data is the product of these inputs.
Read the docs and there are two worked tutorials to demonstrate
how you can use whyqd to support source data curation transparency:
Why use it?
If all you want to do is test whether your source data are even useful, spending days or weeks slogging through data restructuring could kill a project. If you already have a workflow and established software which includes Python and pandas, having to change your code every time your source data changes is really, really frustrating.
If you want to go from a Cthulhu dataset like this:
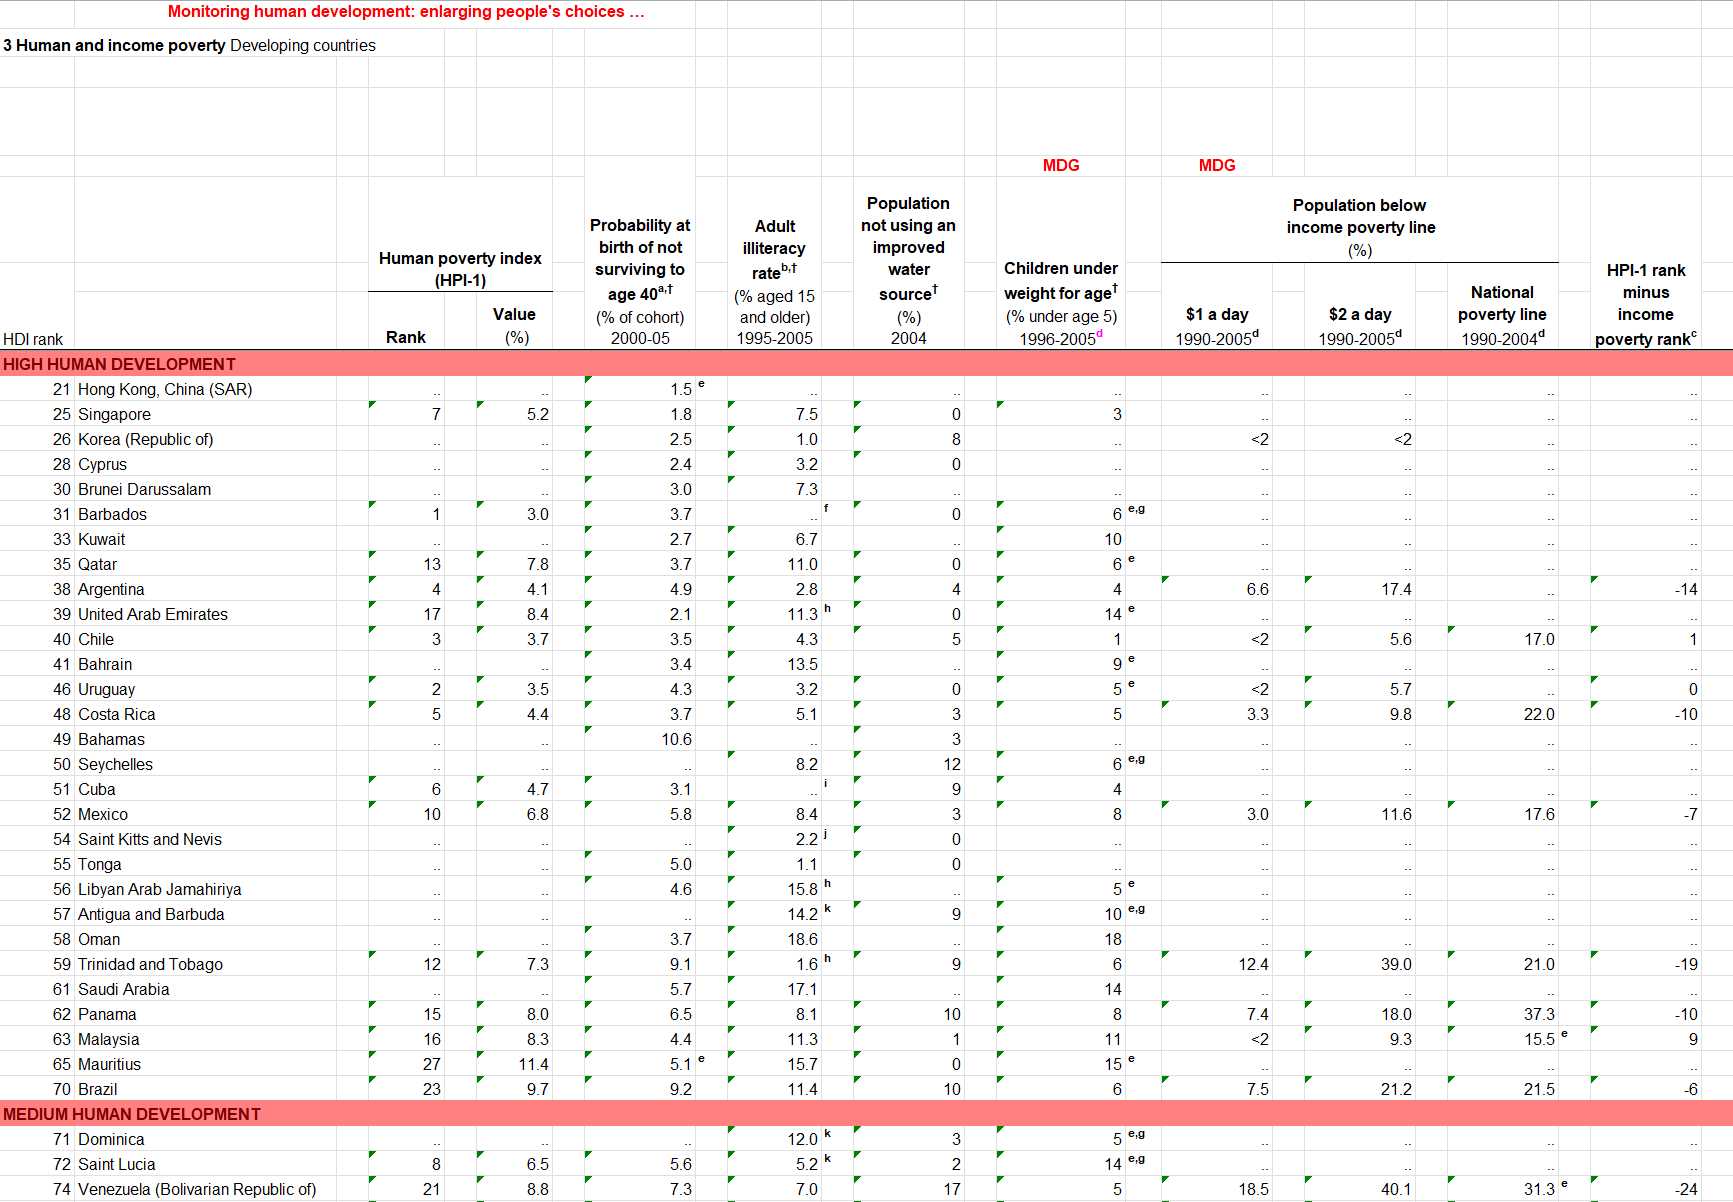
To this:
| country_name | indicator_name | reference | year | values | |
|---|---|---|---|---|---|
| 0 | Hong Kong, China (SAR) | HDI rank | e | 2008 | 21 |
| 1 | Singapore | HDI rank | nan | 2008 | 25 |
| 2 | Korea (Republic of) | HDI rank | nan | 2008 | 26 |
| 3 | Cyprus | HDI rank | nan | 2008 | 28 |
| 4 | Brunei Darussalam | HDI rank | nan | 2008 | 30 |
| 5 | Barbados | HDI rank | e,g, f | 2008 | 31 |
With a readable set of scripts to ensure that your process can be audited and repeated:
scripts = [
     "DEBLANK",
     "DEDUPE",
     "REBASE < [11]",
     f"DELETE_ROWS < {[int(i) for i in np.arange(144, df.index[-1]+1)]}",
     "RENAME_ALL > ['HDI rank', 'Country', 'Human poverty index (HPI-1) - Rank;;2008', 'Reference 1', 'Human poverty index (HPI-1) - Value (%);;2008', 'Probability at birth of not surviving to age 40 (% of cohort);;2000-05', 'Reference 2', 'Adult illiteracy rate (% aged 15 and older);;1995-2005', 'Reference 3', 'Population not using an improved water source (%);;2004', 'Reference 4', 'Children under weight for age (% under age 5);;1996-2005', 'Reference 5', 'Population below income poverty line (%) - $1 a day;;1990-2005', 'Reference 6', 'Population below income poverty line (%) - $2 a day;;1990-2005', 'Reference 7', 'Population below income poverty line (%) - National poverty line;;1990-2004', 'Reference 8', 'HPI-1 rank minus income poverty rank;;2008']",
     "PIVOT_CATEGORIES > ['HDI rank'] < [14,44,120]",
     "RENAME_NEW > 'HDI Category'::['PIVOT_CATEGORIES_idx_20_0']",
     "PIVOT_LONGER > = ['HDI rank', 'HDI Category', 'Human poverty index (HPI-1) - Rank;;2008', 'Human poverty index (HPI-1) - Value (%);;2008', 'Probability at birth of not surviving to age 40 (% of cohort);;2000-05', 'Adult illiteracy rate (% aged 15 and older);;1995-2005', 'Population not using an improved water source (%);;2004', 'Children under weight for age (% under age 5);;1996-2005', 'Population below income poverty line (%) - $1 a day;;1990-2005', 'Population below income poverty line (%) - $2 a day;;1990-2005', 'Population below income poverty line (%) - National poverty line;;1990-2004', 'HPI-1 rank minus income poverty rank;;2008']",
     "SPLIT > ';;'::['PIVOT_LONGER_names_idx_9']",
     f"JOIN > 'reference' < {reference_columns}",
     "RENAME > 'indicator_name' < ['SPLIT_idx_11_0']",
     "RENAME > 'country_name' < ['Country']",
     "RENAME > 'year' < ['SPLIT_idx_12_1']",
     "RENAME > 'values' < ['PIVOT_LONGER_values_idx_10']",
  ]
There are two complex and time-consuming parts to preparing data for analysis: social, and technical.
The social part requires multi-stakeholder engagement with source data-publishers, and with destination database users, to agree structural metadata. Without any agreement on data publication formats or destination structure, you are left with the tedious frustration of manually wrangling each independent dataset into a single schema.
whyqd allows you to get to work without requiring you to achieve buy-in from anyone or change your existing code.
Wrangling process
- Create, update or import a data schema which defines the destination data structure,
- Create a new method and associate it with your schema and input data source/s,
- Assign a foreign key column and (if required) merge input data sources,
- Structure input data fields to conform to the requriements for each schema field,
- Assign categorical data identified during structuring,
- Transform and filter input data to produce a final destination data file,
- Share your data and a citation.
Installation and dependencies
You'll need at least Python 3.7, then:
pip install whyqd
Code requirements have been tested on the following versions:
- numpy>=1.18.1
- openpyxl>=3.0.3
- pandas>=1.0.0
- tabulate>=0.8.3
- xlrd>=1.2.0
Version 0.5.0 introduced a new, simplified, API, along with script-based transformation actions. You can import and
transform any saved method.json files with:
SCHEMA = whyqd.Schema(source=SCHEMA_SOURCE)
schema_scripts = whyqd.parsers.LegacyScript().parse_legacy_method(
            version="1", schema=SCHEMA, source_path=METHOD_SOURCE_V1
        )
Where SCHEMA_SOURCE is a path to your schema. Existing schema.json files should still work.
Changelog
The version history can be found in the changelog.
Background
whyqd was created to serve a continuous data wrangling process, including collaboration on more complex messy sources, ensuring the integrity of the source data, and producing a complete audit trail from data imported to our database, back to source. You can see the product of that at Sqwyre.com.
In 2021, whyqd received financial support from the Mayor's Resilience Fund, the Mayor of London's £1 million challenge fund to incentivize innovators to address socially impactful issues facing London. Sqwyre.com will be contributing to research tools needed during post-COVID economic development as part of the 'Activating High Streets' challenge.
The 'backronym' for whyqd /wɪkɪd/ is Whythawk Quantitative Data, Whythawk is an open data science and open research technical consultancy.